The easiest way to understand what Predictor does is to apply it to a simple example. In this example, you are sales manager for Tropical Cosmetics Co. The company’s latest product, shampoo with tropical ingredients, has been in the marketplace for almost a year. The vice president of marketing wants you to forecast the rest of the year’s shampoo sales and decide whether to recommend investing in advertising or enhancements for this product.
You have the weekly sales numbers for the last nine months.
 To begin the tutorial:
Start Crystal Ball, which automatically starts Microsoft Excel.
Select Resources, and then Example Models in the Crystal Ball ribbon Help group.
In the Model Name list, click Shampoo Sales.
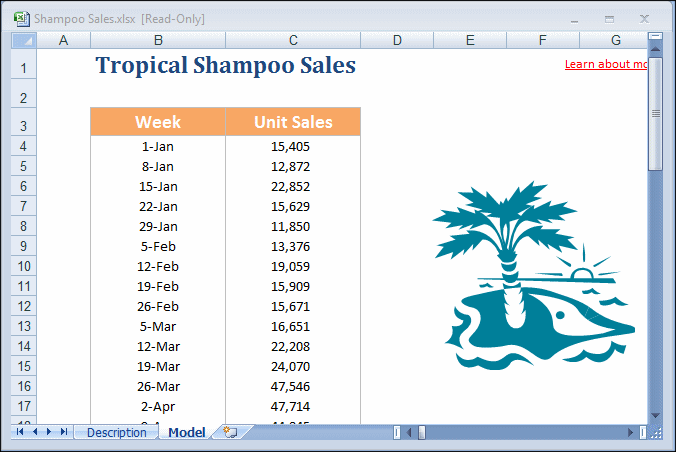
The Shampoo Sales spreadsheet opens (Figure 9, Shampoo Sales Spreadsheet).
In this spreadsheet, column B contains dates from January 1, 2015 until September 24, 2015 and column C contains Tropical Shampoo sales data. You need to forecast sales through the end of the year, December 31, 2015.
Select cell C4, if it is not already selected.
Select any one cell in the data range, headers, or date range, and Predictor selects all the filled adjacent cells.
Select Predictor in the Crystal Ball ribbon.
If necessary, wait for a simulation to stop or reset the last simulation.
The Predictor wizard opens. If this is the first time you started Predictor, the Welcome panel opens. Otherwise, Input Data opens.
If Welcome opens, click Next to display Input Data.
When you select any one cell in the data range before you start the wizard, Predictor determines the following:
Confirm that cell range $B$3:$C$42 is selected and click Next.
The Data Attributes panel opens.
Confirm these settings and correct them if necessary:
Data is in weeks.
AutoDetect is selected to determine whether data has seasonality.
In the Events group, Include events is selected.
In the Data Screening group, Fill-in missing values is selected.
Leave the defaults selected and click Next to open the Options panel.
In Options, confirm that the defaults (RMSE and Standard forecasting) are selected, and then click Run.
The Predictor Results window opens.
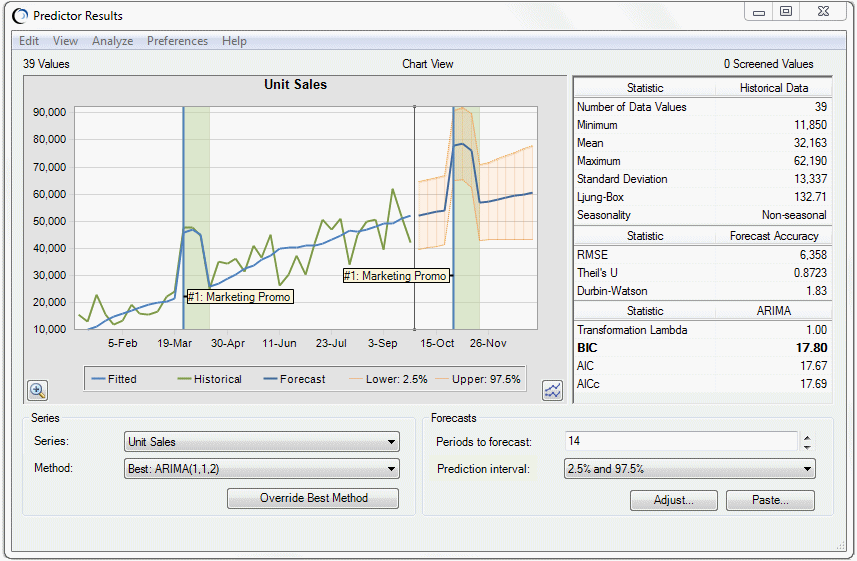
Set Periods to forecast to 14 and review window contents (Figure 10, Predictor Results Window for the Shampoo Sales Spreadsheet Model).
The Predictor Results window contains the following:
A chart of historical and predicted values; predicted values are displayed as a dark blue line extending to the right of the historical data (green) and the fitted values (blue). Above and below the predicted values is the prediction interval (a red dotted line), showing the 2.5th and 97.5th percentiles of the predicted values. This is called a 95% prediction interval.
A marketing event was defined for this model, indicated by vertical bars and labels. Because the historical data showed an increase during the event, the predicted data also shows an increase when the event is scheduled to repeat.
Note:
You can select Preferences, and then Highlight Events to hide the event labels and bars.
A Series list of all data series selected for forecasting; onscreen information pertains to the selected series
A Method list of all the methods Predictor tried, in order from the best-fitting method to the worst-fitting method. Predictor calculates the predicted values from the method that best fits the historical data. In this case, the BEST method is ARIMA(1,1,2).
Historical data statistics for the selected series
Error statistics for predicted data
Parameters for the current BEST method
See Selecting How to Display and Analyze Results for more information about data, buttons, and menus in this window.
Optional: Select View, and then Table to display a table of historical data in place of the chart. Notice that an Event column contains the number and name of defined events. Select View, and then Chart to display the chart again.
Select these settings in the Paste Forecasts to Spreadsheet dialog:
At end of historical data
Paste as Forecast values
Include date series
AutoFormat
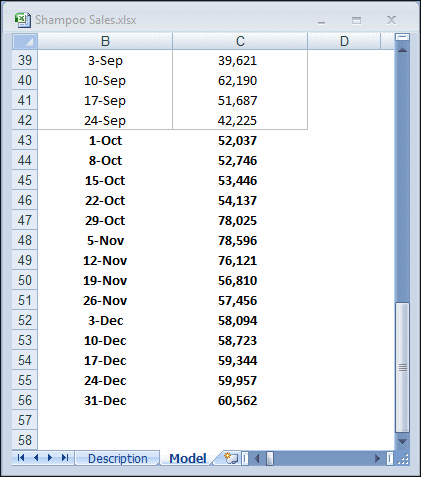
The results paste at the bottom of the table in cells C43 to C56 as the same forecasted values plotted in the Predictor Results window (Figure 11, Pasted Shampoo Sales Forecasted Values). These values were predicted using the BEST method shown in the Predictor Results window.
Note:
Tutorial 2—Toledo Gas explains how to paste using “random walk” formulas.
Based on the results, you complete your memo to upper management. Current strategies seem to be working, so you recommend funding another project instead.


