|
|
|
Potential vs. Actual Comparison (REP_POT_ACT.REP with REP_POT_ACT.FMX)
The Potential vs. Actual Comparison report is available when the OPS<version number> Sales & Catering or the OPF<version number> Sales Force Automation license code is active. This report allows managers to see how potentials for selected sales managers and/or accounts are developing by comparing potential room nights, average rate and revenues to actuals.
Note: Entries into the Stats & Info Tab fields Potential Room Nights and Potential Revenue, at the account profile level are not related to this report or its functionality.
This report has been especially created for Regional Sales Office operations. Hotels can use it if they are using Potentials, but most of its advanced features will not be useful on a property level as the property will mostly book only for itself and keep potentials for itself rather than on a corporate level.
Note: This report requires that the user be granted the BLOCK PRINT permission in the selected property to run the report. Also, the Property LOV in this report is further limited by the properties to which the user has the appropriate access granted.
Account. Select the down arrow to choose one or more accounts to report on. The default is all accounts.
Potential. Select the down arrow to choose one or more specific potential records to report on. The default is all potentials.
Mktg. Region. Select one or more specific marketing regions to report on. The default is all marketing regions. Select the Actuals check box to also filter actuals by the selected Marketing Region. (The Actuals check box is available only when a Marketing Region has been selected.)
Mktg. City. Select one or more specific marketing cities to report on. The default is all marketing cities. Select the Actuals check box to also filter actuals by the selected marketing cities. (The Actuals check box is available only when a Marketing City has been selected.)
Property. Select one or more specific properties to report on. The default is all properties. This filter is more useful in an RSO environment, as it is unlikely that a property will keep potentials configured for other properties. If potentials are used at all, the most common usage on property level would be to only enter an account's potentials for the current property itself, as this in the only property that bookings are going to be created for in the same system. Select the Actuals check box to also filter actuals by the selected properties. (The Actuals check box is available only when a Property has been selected.)
Owner. Select the down arrow to filter the report by one or more owner(s). The default is all owners.
From Year/To Year. Select the start and ending years to define the period for comparing potentials versus actuals. The report will always compare full calendar months or full configured fiscal periods within the range of years.
Forecast Type. Select the down arrow to choose a forecast type. (Forecast types are configured in Configuration>Profiles>Potential Sales>Forecast Types. See Forecast Types for details.)
Actuals. Select the down arrow to choose to report on actuals for GROUP bookings, NON-GROUP bookings, or BOTH. If the Forecast check box on a potential is not checked and GROUP is selected, only those group stay records/ reservation stat daily records that can be linked back directly to groups associated with the potential will be calculated in the actuals. If the Forecast check box on a potential is selected, and GROUP is selected, all group stay records linked to the potential's account will be included in the calculation, irrespective of a direct link of the group record to the potential. When NON-GROUP is selected, only stay records/reservations of the potential's account that have no allotment header link at all will be calculated in the actuals. When BOTH is selected, all group and individual records that are linked to the potential's account in the given time frame will be calculated into the actuals, regardless of a direct link to the potential.
Note: When the application parameter GENERAL>SPLIT POTENTIALS is active, the selected filter for Actuals will also filter the potential forecast records of the same value. The 'Both' option will summarize all existing potential records for the selected time period, including records that may not have been designated for group or non-group.
Rollup Sub-Account Statistics. Select this check box to include sub-account statistics in the actuals calculation. Sub accounts will be included if they have the hierarchical relationship specified in the Relationship field. Actual figures will include statistics rolled up from all accounts that are linked underneath the selected accounts with the selected relationship.
Relationship. Available when the Rollup Sub-Account Statistics check box is selected. Select the down arrow to choose the hierarchical relationship of sub-accounts to be included in the actuals calculation.
Net/Gross. Select the Net or the Gross radio button depending on how you wish to display actual figures. (Net is selected by default.)
Variance Amount/Variance %. Select the Variance Amount or Variance % radio button depending on how you want to display the variance figures. (Variance Amount is selected by default.)
Include Legacy/Manual Statistics. Select this check box to generate this report including any revenues that were manually added or that were migrated from a legacy system.
Period Details. If this check box is selected, the report will show a separate line for each month or fiscal period in the report year range. Periods will be summarized by year with a grand total for potentials spanning multiple years. If this option is not checked the report will show a total for each year with a grand total for potentials that span multiple years. (This check box is selected by default.)
Property Details. If this check box is selected, the report will show actuals broken down by property (without potentials and variance) above the period total line. When the Application Parameter>General>POTENTIAL PROPERTY DETAILS is active and this check box is selected, and if property-specific potentials have been created, the report will break down potentials and actuals by property.
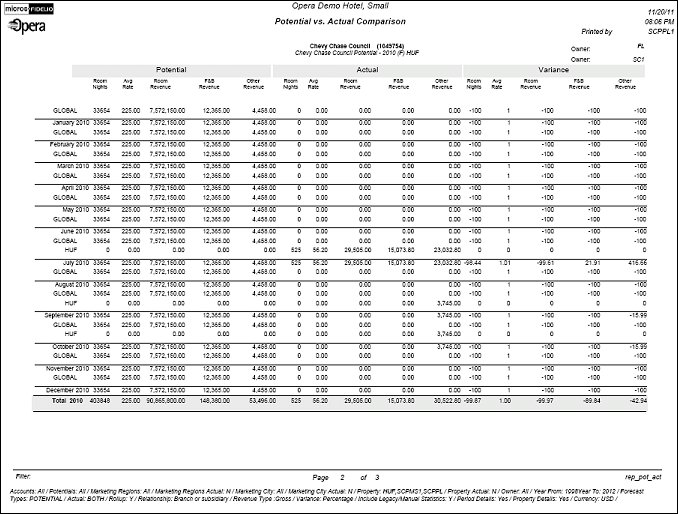
The account name and the potential name appear at the top of the report for the property. If the ‘Property Details’ check box has been selected, potentials and actual will print per property, provided property specific potentials exist. For properties that do not have property specific potential forecasts defined, only the Actual figures will print. If a Global Potential record is defined, a line with Property Code Global will print and show the values for that Potential (there will be no Actual figures displaying in that record.)
The leftmost column shows the report periods when the Period Details report option is selected. When the Period Details report option is not selected, only a total for each year is shown, with a grand total following the last year's total if the potential spans multiple years.
The main report body is comprised of 3 sections:
Actual figures will be shown net or gross depending on the transaction code and revenue bucket configuration and based on the Net / Gross radio button selection for this report. Actual figures are not by default always net.