|
|
|
Day/MTD/YTD Statistics (stat_dmy_seg with STA3.FMX)
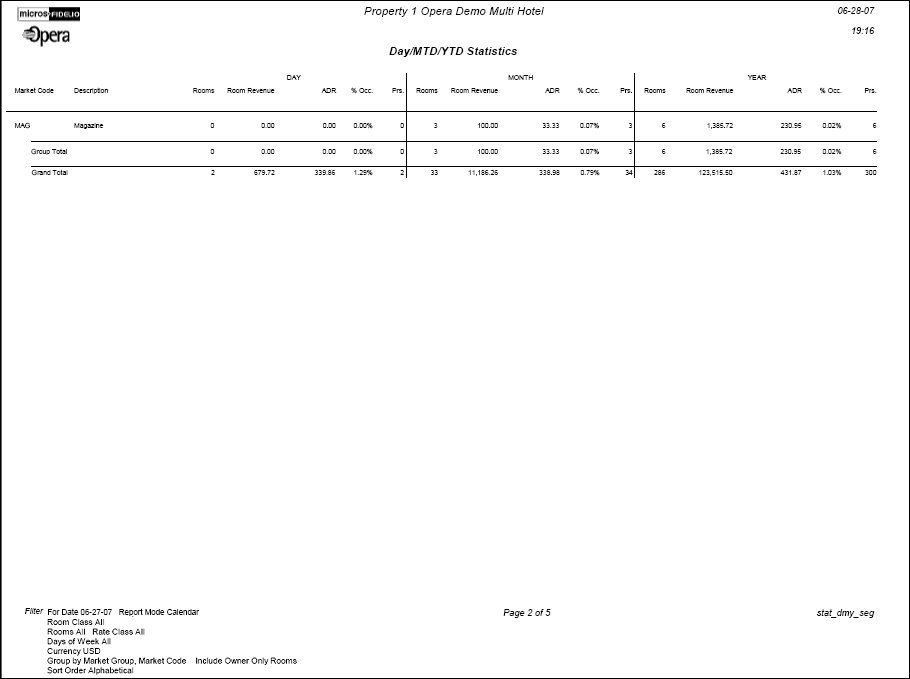
The Day/MTD/YTD Statistics Report displays a breakdown of reservations by the selected grouping and sub grouping. The output displays a breakdown per day, per month and per year.
The daily (Day column) totals match the Manager’s Report for the same date. Postings in Accounts Receivable or Passerby will display Revenue, however, the number of rooms would be 0.
For those Reservations without a filtered value, the Reservation count will be grouped into a row labeled ‘No Code’.
Report output selects from reservation_stat_daily to obtain data.
Note: If a transaction is routed from one room to another room, the transaction will be recorded under the receiving room (target room). One exception to this rule is if the transaction is routed from a non-PM room to a PM room, then the transaction will be recorded under the source reservation. This applies to all statistic types that are reservation specific, which includes market code, source code, and rate code statistics.
This section is only displayed when the General>Period Definition application function is active.
Calendar. Display the statistics in the format of Day, Month and Year
Fiscal. Display the statistics in the format of Day, Period, Fiscal Year
When run for the Report Period of ‘Fiscal’ the filter section of the report (bottom left hand corner) will display the Fiscal Period the selected Date falls within.
Date. Manually type or select the calendar button to choose a date for the report.
Room Class. Multi Select LOV for filtering on specific Room Classes. Room Classes may be configured to define groupings of Room Types that have some characteristics in common. The Room Class filter is only displayed when the General>Room Class application function is active.
Rooms. Select the down arrow to choose a specific room or rooms from the list of values. The list will contain all configured rooms in the property. If a Room Class has been selected in the previous field, this list of values will only include those rooms within the selected Room Class.
Currency Code. Single Select LOV for selection of the currency the revenue values should be displayed. The Currency Code filter is only displayed when the General>Multi Currency application function is active.
Rate Class. Multi-select LOV for filtering based on one or more specific rate classes in the report.
Day of Week. Multi-select LOV that allows the user to select one or more specific days of the week to display in the report.
Unused Codes. Select to include all codes since the beginning of the year.
Day Use. Select to include Day Use rooms in the report for Rooms, Prs., ADR, and Occ%. (This check box can be configured to be selected by default from Configuration>Setup>Report Setup>Reports.)
No Show. Select to include No Show rooms in the report for Rooms, Prs., ADR, and Occ%. (This check box can be configured to be selected by default from Configuration>Setup>Report Setup>Reports.)
Owner Only Rooms. Available when the Opera VOS (OPV_<version_number>) license code is active. Select this check box to include owner-only rooms (owner rooms that are not part of the rental program) in the report output.
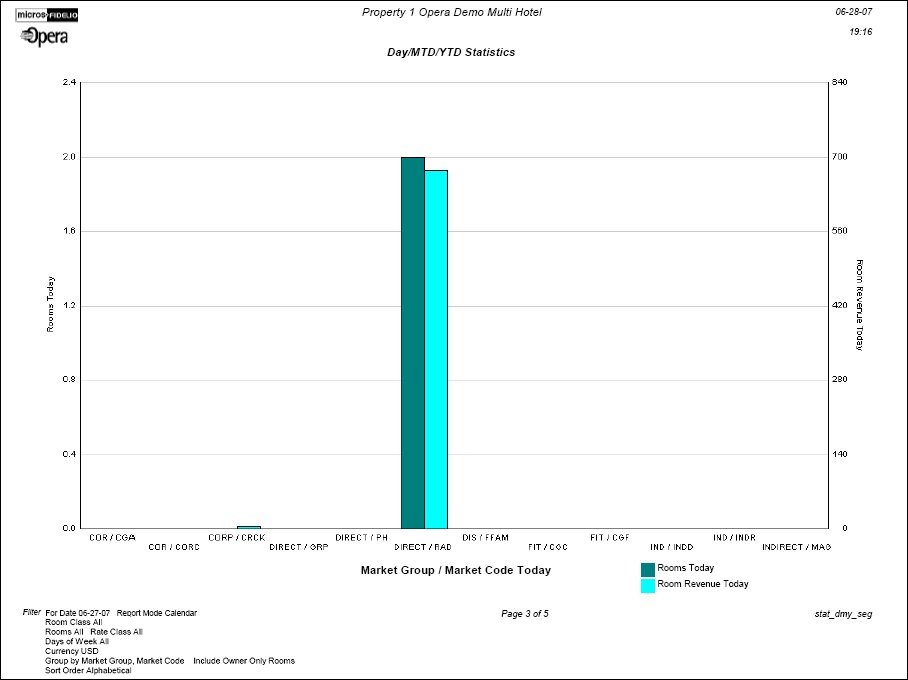
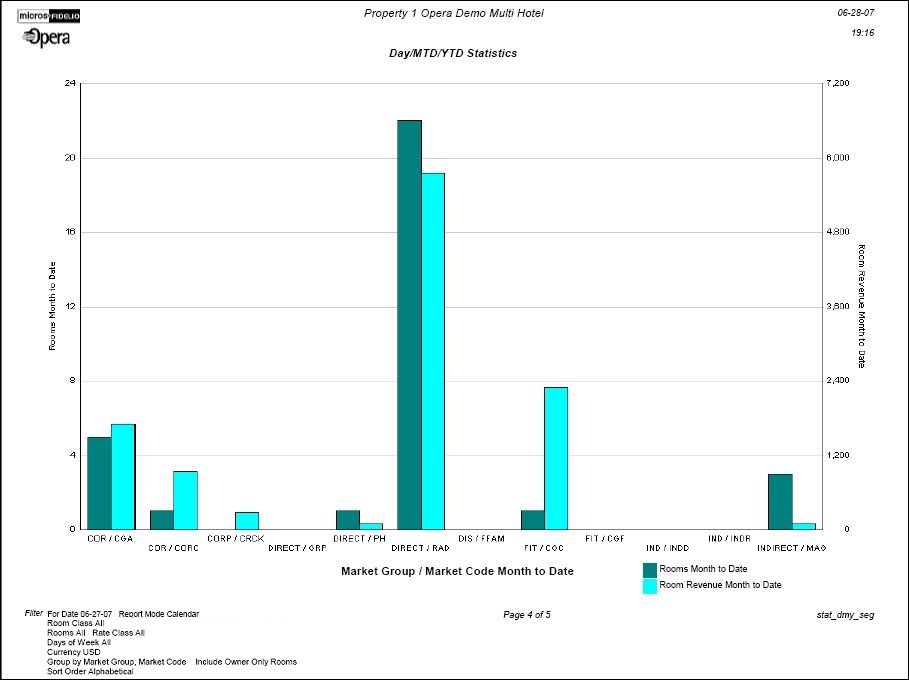
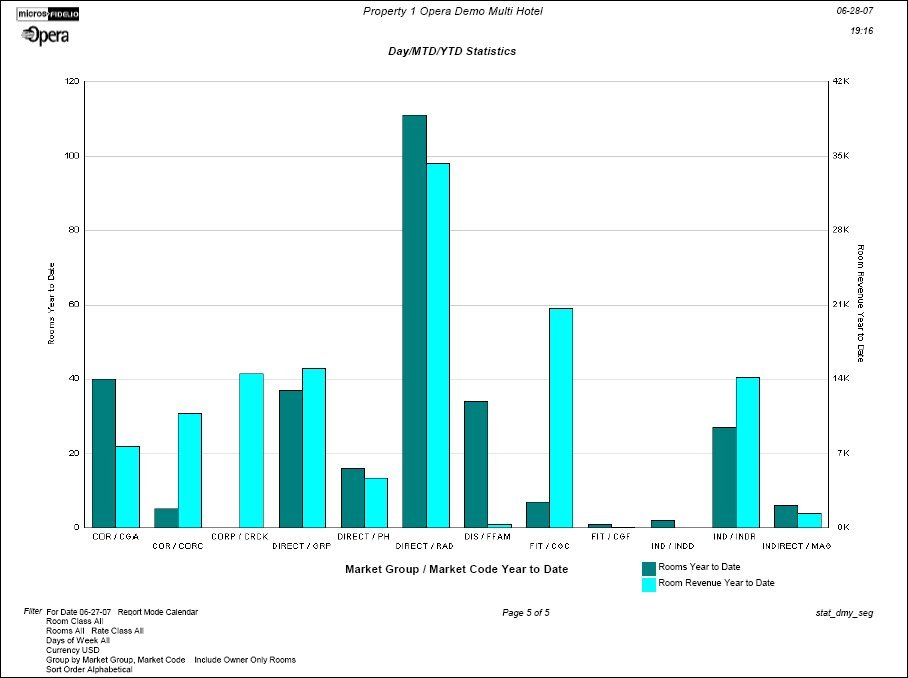
Graph. When selected, a graph will be generated at the end of the report for the Day, Month to Date, and Year to Date comparisons of Room Nights and Revenue.
Group By. All options to select in the Group By are also available in the SubGroup By option. When the same Group By and Subgroup By are selected (i.e. Market Code for both options), there will not be a single Group by of Market Code.
Options to select are:
Subgroup By. A Single Select LOV option – only one item may be selected and are the same options as the Group By options. The selected value will be the subgroup of the Group By selected. i.e. Select to Group By Market Group and Subgroup by Market Code. Within each Market Group, there will be a breakdown per Market Code displayed on the report.
Sort Order. Alphabetical, Sequence.
First Column. The value that is populated for this column is based on the values that were selected for the Group By and Subgroup By options.
Description. Description of the values selected for the Group By and Subgroup By options.
Rooms. (Day,Month,Year) Number of rooms associated to reservations that have the code attached that was selected for the Group By and Subgroup By options for the Day/Month/Year.
Room Revenue. (Day,Month,Year) Total amount of room revenue from the reservations based on the rate for the room.
Note: Room revenue can be displayed as a negative amount due to multiple transfers from a room to a Pseudo room to another Pseudo room. It will not display a 0 because the revenue is now considered as part of the Pseudo room and cannot be considered against the source market code (non PM room).
ADR. (Day,Month,Year) Average Daily Rate for a room. This is calculated by dividing the Room Revenue by the number of Rooms.
% Occ. (Day,Month,Year) Occupancy percentage for the values that were selected for the Group By and Subgroup By options.
Prs. (Day,Month,Year) Total number of persons attached to the reservations.
If the Graph Display option is selected, day, month, and year to date graphs are included.