OXI Central Monitor
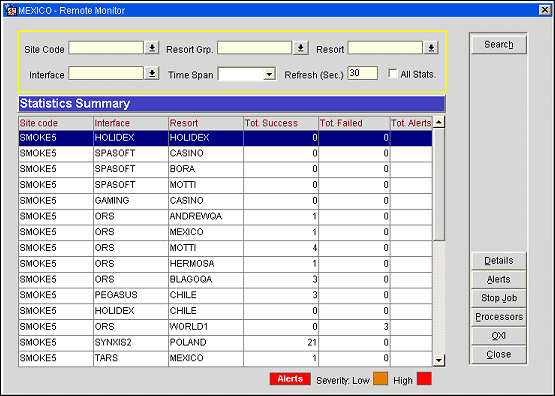
The OXI Central Monitor is a central tool that allows for the monitoring and management of remote OXI interfaces from one location. For large scale clients who do not deploy OPERA in a centralized fashion, the OXI Central Monitor provides real-time monitoring of distant interfaces, their activity and their health. This tool also allows the issuance of some basic commands to the remote location, as well as the remote access to OXI.
A few items that are required to run the OXI Central Monitor are:
To access the OXI Central Monitor select the Utilities option from the Single Sign On page, then select Processors>Remote Monitor>Monitor. By default, the Remote Monitor screen displays a Statistics Summary of the most recent snapshot for a particular resort and interface.

Site Code. Use the down arrow to select a specific site code to search for.
Resort Group. Use the down arrow to select a specific resort group to search for. Resort Groups are configured via the Processors>Remote Monitor>Resort Group screen.
Resort. Use the down arrow to select a specific resort to search for.
Interface. Use the down arrow to select a specific interface to search for.
Note: The Resort, Interface, and Site Code LOVs will exclude those values marked as inactive on the Site Code configuration, so that only values that are currently active will display.
Time Span. Select 1, 4, 8, 24, 48, 72, hours from this LOV to view snapshots captured in the selected time interval. Each selection will 'roll-up' the data for all snapshots that make up the requested time span. For example, if 8 hours has been selected, and three snapshots have been captured in that time, then one record will display the combined data for all 3 snapshots accumulated in the selected time span. The default for this screen is always the last snapshot captured.
Refresh (sec.). Enter an interval of time (in seconds) in which the information displayed on this screen should be refreshed. The default for refreshing this screen is 30 seconds. However, if this field is cleared and left blank, this screen will not refresh at all.
All Statistics. Select this option to view all statistics captured for the last 3 days for all interfaces/resorts.
Note: This screen auto-refreshes every 30 seconds or every time the Search button is selected.
Site Code. Site Code entered in the Site Code field on the Site Configuration screen.
Interface. Name of the OXI Interface.
Resort. Resort Name.
Tot. Success. Total of all messages (incoming and outbound) that have processed successfully.
Tot. Failed. Total of all messages (incoming and outbound) that have failed.
Tot. Alerts. Displays the total number of active alerts.
Severity High/Low. The Severity High and Low flags determine the position of the alert in the grid (highest alerts at the beginning of the result grid, followed by the lowest) and how these alerts will display in the grid; for instance, high alerts display in red text, low alerts display in orange text.
Search. Select the Search button to search for alerts as filtered by any of the selected search options: Resort, Interface Id, Resort Group. The Search button can also be used to refresh the results of the Statistics Summary display grid.
Details. Select this option to view a summary of Detailed Statistics (by phase).
Alerts. Select this option to see the active alerts for all affected interfaces and resorts.
Start/Stop Job. Starts and Stops the background processor job that collects the snapshots from the remote OXI interfaces. When this is stopped, no snapshots will be collected for any site code.
Processors. Launches the Processor Status screen, from which you can view the status of the processor and associated sub-processes as well as start, stop or restart the processor.
OXI. Launches the Single Sign On page for the OXI interface. This is configured in the Site Configuration>Edit site App Server field.
Close. Exits the central Monitor.
See Also