
|
|
|
Form Details
The Form Details screen provides diagnostic information that may be useful to the MICROS-Fidelio Support Team when called upon to investigate a problem you have reported. If requested by Support you may access this screen by selecting Ctrl+Shift+Page Down from any OPERA screen.
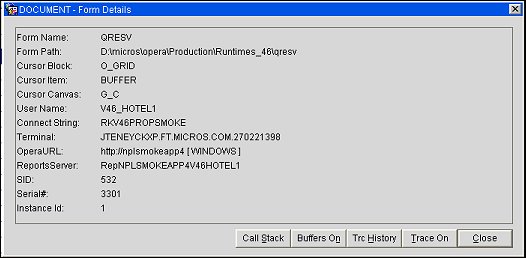
The following information is provided on this screen.
Form Name. OPERA's internal FMX form name for the screen from which Form Details is accessed.
Form Path. Location where this form is stored on the application server.
Cursor Block. Block position of your cursor on the form.
Cursor Item. Field, check box or other form object where the cursor is positioned.
Cursor Canvas. Named area of the form where the cursor item is located.
User Name. Database schema name.
Connect String. Database connection string for the Oracle database server.
Terminal. Network name and IP address of your PC.
OPERAURL. Network URL of the OPERA application server.
ReportsServer. Network name of the OPERA Reports server.
SID. Oracle database session ID. Each OPERA user's database connection has a unique session ID.
Serial#. Oracle database connection serial number.
Instance ID. Number of the instance of this database connection. (In a RAC database environment there may be more than one database connection per user session, each having its own instance.)
Call Stack. Select this button to display the path used to access the OPERA screen from which Form Details was called.
Buffers On/Buffers Off. Select the Buffers On button then close the Form Details screen and perform an action in OPERA as directed by Support. Then return to the Form Details screen and select the Buffers Off button to display a summary of system resources consumed by the OPERA activity you performed.
Trace On/Trace Off. Trace files provide details on the OPERA activity while performing a task. To create a trace file, select the Trace On button. When prompted, confirm the name of the trace file that will be created to hold the trace data. Close the Form Details screen and perform an action in OPERA as directed by Support. Then return to the Form Details screen and select the Trace Off button. Use the Trc History button option to download and review the trace file that was created.
Trc History. Display a list of the trace files that are available to be viewed. From this screen you may select a particular trace file and download it for review. See Trace History for details.
Hidden by default, the CL_GEM and GEM Trace detail screen can be displayed by pressing the CTRL and SHIFT keys and clicking on the Call Stack button on the Help form.
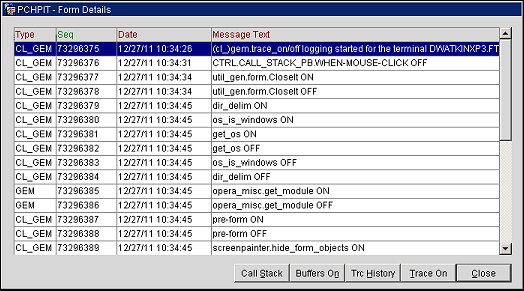
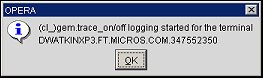
When the screen is first displayed, the grid will not display any trace details. To initiate the trace, press the CTRL and ALT keys and click the Call Stack button. The following message will be displayed to notify the user that the trace has been started.
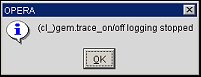
Click the OK button and close out of the Help screen. Now re-enter the Help screen, Ctrl+Shift+Page Down, and select the CTRL and SHIFT keys and click on the Call Stack button. Now the grid will be populated with trace details. To stop the trace, press the CTRL and ALT keys and click the Call Stack button and the following message is displayed to notify the user that the trace has been stopped.
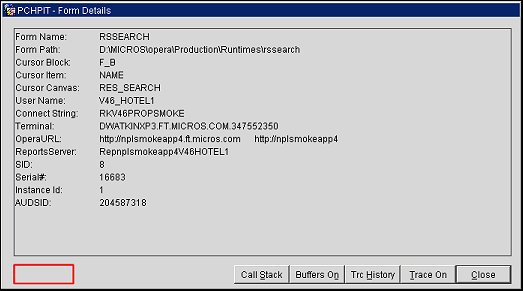
The Open Cursor details can be viewed by clicking in the hidden area, identified by the red rectangle in the image above, on the Help screen. When clicking in this area, the Open Cursor Details Grid will be displayed.
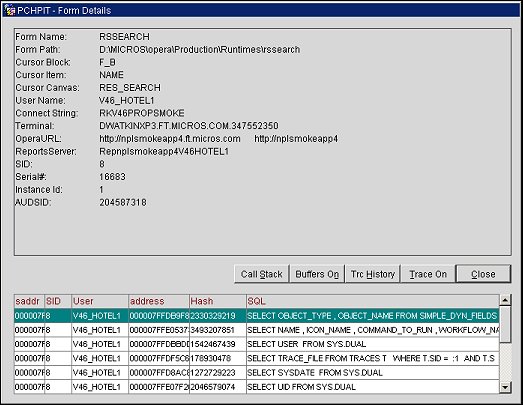
To close the Open Cursor details grid, simply click in the same area of the Help screen.