|
|
|
Matrix Report (matrix_report with STA7.FMX)
Note: When printing this Report help topic, we recommend printing with Landscape page orientation.
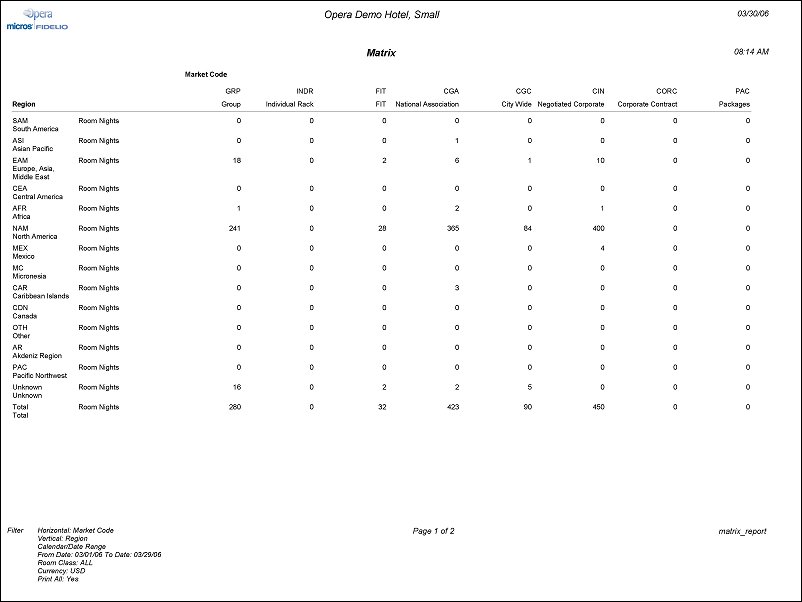
The Matrix Report allows you to cross-reference market, region, room type, rate category, rate code, origin or source statistics for a specified month.
Note: When the OPR <version number> ORS license code is active, the Select Property screen appears prior to the STA7.FMX screen. Choose the property you want to view and select the OK button. The STA7.FMX screen appears.
The setup of the report is user-definable and cross-references two types of statistics at a time; e.g., market and source statistics, market and region statistics, and so forth. You can also select whether the report is to be printed using the market, source or region codes, or using the text associated with each code. In addition, it is possible to select the type of statistical data to be displayed, for instance, Room Nights, Persons, Room Revenue. Once you have selected the statistic type to be displayed, you can specify whether the data should be displayed as year-to-date or as month-to-date only.
Calendar or Fiscal - (Available when the Cashiering>Period Definition application function is set to Y.) Select the radio button that corresponds to the type of report period you wish to apply to this report. You may choose a Calendar period (month, week, or month to date) or a Fiscal period (which you have defined for your property's use). (Fiscal periods are configured using System Configuration>Cashiering>Period Definition>Period.) Whether you select a Calendar or Fiscal period type will determine your other Report Period options, and your Date Range options.
Date Range. When you have selected the Report Period, the appropriate Date Range options appear. For example, if you select Calendar and Month as the Report Period, Date Range fields appear allowing you to choose the calendar year and the month you wish to report on. Or, if you select Fiscal and Period, Date Range fields appear allowing you to choose the fiscal year and the fiscal period you wish to report on. The current date determines the default Date Range field entries, but you may make changes prior to running the report.
Horizontal Value. Market Code, Market Group, Source Code, Source Group, Origin Code, Country, Region, Room Type, Room Class, Rate Code, Rate Category, District, State, City
Vertical Value. Market Code, Market Group, Source Code, Source Group, Origin Code, Country, Region, Room Type, Room Class, Rate Code, Rate Category, District, State, City
The List of Available values is single select. The option of ‘Room Class’ is only displayed when the General>Room Class application function is active.
Currency. Select the currency the Revenue figures will be displayed in. The LOV contains only those currencies configured by the property. The default for the currency field is the Properties default currency. The currency field displays only when the General>Multi Currency application function is active.
Room Class. Multi Select LOV for filtering on specific Room Classes. The Room Class filter is only displayed when the General>Room Class application function is active.
Unused Codes. When selected, the report output will include all configured codes, for both the horizontal and vertical values selected. When not selected, the report output will only include those codes that have been used on a Reservation, Passerby or Accounts Receivable posting, within the dates specified.
Room Nights. Number of Room Nights generated for the selected Horizontal and Vertical Value combination.
Room Nights %. The percentage represents the vertical values contribution to the total number of Room Nights booked for the dates specified. The column total of the Percentages will equal 100%. For example, If a Total of 6 Rooms were booked for Market Group =Airline (vertical value) each Room Night % row for each Origin Code (horizontal value), under the Airline column would display the percentage it contributed to those 6 room nights.
Room Nights Overall %. The percentage breakdown represents the Property wide contribution for the dates specified. All columns OR all rows for the Room Nights Overall % added together totals 100%.
Persons. Total number of Adults and Children staying for the selected Horizontal and Vertical Value combination.
Persons %. The percentage represents the vertical values contribution to total number of Persons booked for the specified dates. The column total of the Percentages will equal 100%. For example, if a total of 6 persons were booked for Market Group =Airline (vertical value) each Person % row for each Origin Code (horizontal value), under the Airline column would display the percentage it contributed to those 6 Persons.
Persons Overall %. The percentage breakdown represents the Property wide contribution for the dates specified. All columns OR all rows for the Persons Overall % added together totals 100%.
Arrival Rooms. Number of Arrival Rooms generated for the selected Horizontal and Vertical Value combination.
Arrival Rooms %. The percentage represents the vertical values contribution to the total number of Arrival Rooms arriving for the dates specified. The column total of the Percentages will equal 100%. For example, If a Total of 6 Rooms were to arrive for Market Group =Airline (vertical value) each Room Night % row for each Origin Code (horizontal value), under the Airline column would display the percentage it contributed to those 6 arrival rooms.
Arrival Rooms Overall %. The percentage breakdown represents the Property wide contribution for the dates specified. All columns OR all rows for the Arrival Rooms Overall % added together totals 100%.
Arrival Persons. Number of Arrival Persons generated for the selected Horizontal and Vertical Value combination.
Arrival Persons %. The percentage represents the vertical values contribution to the total number of Arrival Persons arriving for the dates specified. The column total of the Percentages will equal 100%. For example, If a Total of 6 people were to arrive for Market Group =Airline (vertical value) each Room Night % row for each Origin Code (horizontal value), under the Airline column would display the percentage it contributed to those 6 arrival persons.
Arrival Persons Overall %. The percentage breakdown represents the Property wide contribution for the dates specified. All columns OR all rows for the Arrival Persons Overall % added together totals 100%.
Net Room Revenue. The Net Room Revenue generated for the selected Horizontal and Vertical Value combination. Net Room Revenue is defined as not including Taxes or Packages. A posting to a transaction code that is the ‘Type of ‘Lodging’ is considered Room Revenue.
Net Room Revenue %. The percentage represents the vertical values contribution to the total Net Room Revenue for the specified dates. The column total of the Percentages will equal 100%. For example if $600.00 Room Revenue was generated (or forecasted) for the Market Group =Airline (vertical value) each Net Room Revenue % row for each Origin Code (horizontal value), under the Airline column would display the percentage it contributed to the Total Net Room Revenue.
Net Room Revenue Overall %. The percentage breakdown represents the Property wide contribution for the dates specified. All columns OR all rows for the Net Room Revenue Overall % added together totals 100%.
Net F&B Revenue. The Net Food & Beverage Revenue generated for the selected Horizontal and Vertical value combination. To run the report for future dates, this is the forecasted value of the packages (minus taxes) on a Reservation or Block. A posting or Package configured with a Transaction Code of Type ‘Food and Beverage’ is considered F&B Revenue.
Net F&B Revenue %. The percentage represents the vertical values contribution to the total Net F&B Revenue for the specified dates. The column total of the Percentages will equal 100%. For example if $600.00 Net F&B Revenue was generated (or forecasted) for the Market Group =Airline (vertical value) each Net F&B Revenue % row for each Origin Code (horizontal value), under the Airline column would display the percentage it contributed to the Total Net F&B Revenue.
Net F&B Revenue Overall %. The percentage breakdown represents the Property wide contribution for the dates specified. All columns OR all rows for the Net F&B Revenue Overall % added together totals 100%.
Gross Total Revenue. The Total Revenue postings or forecasted Revenue for the selected Horizontal and Vertical value combination. The value included Room Revenue, F&B Revenue and Taxes.
Gross Total Revenue %. The percentage represents the vertical values contribution to the Gross Total Revenue for the specified dates. The column total of the Percentages will equal 100%. For example if $600.00 Gross Total Revenue was generated (or forecasted) for the Market Group =Airline (vertical value) each Gross Total Revenue % row for each Origin Code (horizontal value), under the Airline column would display the percentage it contributed to the Gross Total Revenue.
Gross Total Revenue Overall %. The percentage breakdown represents the Property wide contribution for the dates specified. All columns OR all rows for the Gross Total Revenue Overall % added together totals 100%.
Average Room Rate. Average Net Room Rate, excluding Tax & Packages.
Preview. Select to preview the report in a PDF format.
Print. select to print the report.
File. Select to save the report as a file.
Close. Select to exit the specific report.