
|
|
|
OTB Sales Statistics (otb_sales_statistics with GEN1.FMX)
Note: When printing this Report help topic, we recommend printing with Landscape page orientation.
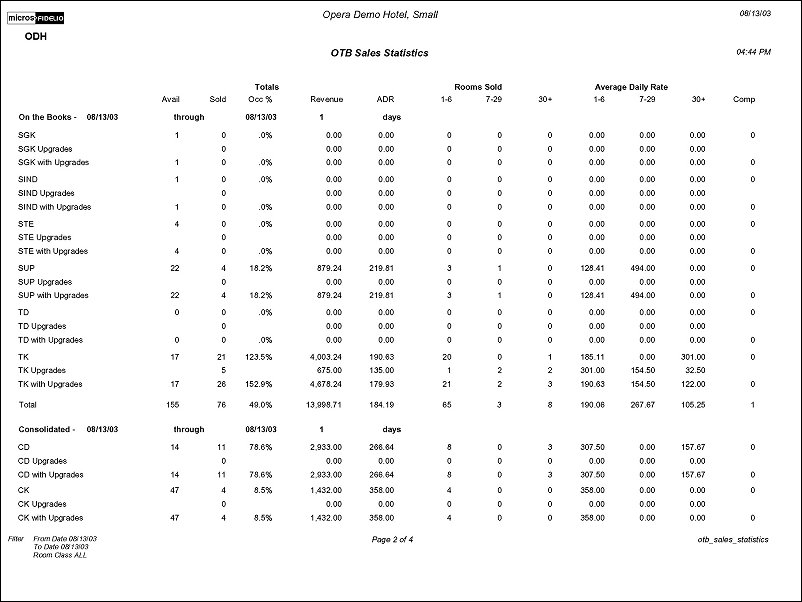
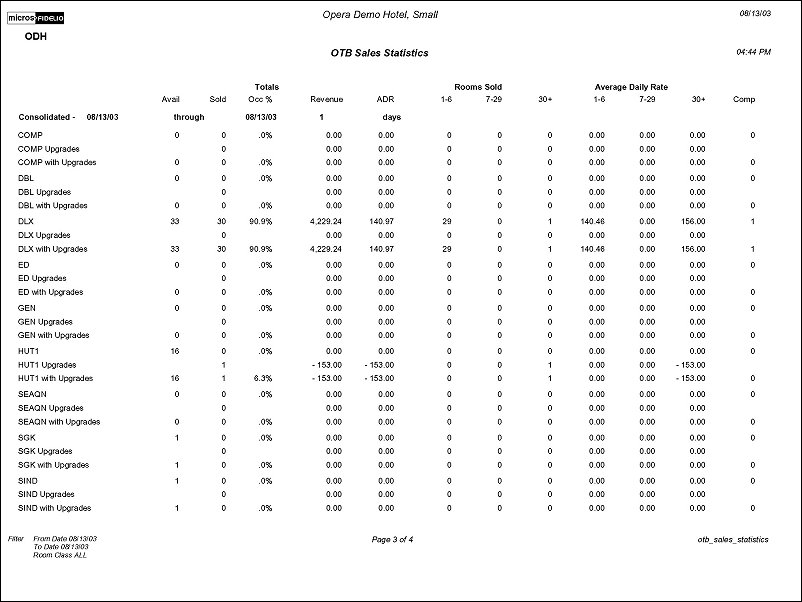
The OTB Sales Statistics Report provides the ability to view reservations booked per room type for a past, current, and future dates. The information in the report lists the room types as their own line item and includes data that is statistical and forecasted. The report is segmented into two groups: On the Books for the selected date range and Consolidated for the selected date range.
The forecast section forecasts business on the books for the next 12 months from the system date month. Within the specified date range you can create a forecast report by adding the appropriate numbers according to business trends to give you an accurate forecast to prepare for orders and staffing needs. Select the appropriate filtering criteria for the forecast.
The statistical section allows you to compare the actual business on the books to what has been forecasted for the selected date range and other filter criteria. You can enter the planned rooms, planned double occupancy percentage, the planned revenue and the planned average room rate to give a more accurate picture of your business.
The consolidated section displays a combination of both the forecasted and statistical sections.
From Date. Manually enter, or select the Calendar button to choose, the beginning stay date of the date range for the report.
To Date. Manually enter, or select the Calendar button to choose, the ending stay date for the date range.
Room Class. When the General>Room Class application function is active, select specific room classes to display in the results of the report from the multi-select list of values.
Preview. Select to preview the report in a PDF format.
Print. Select to print the report.
File. Select to save the report as a file.
Close. Select to exit the specific report.
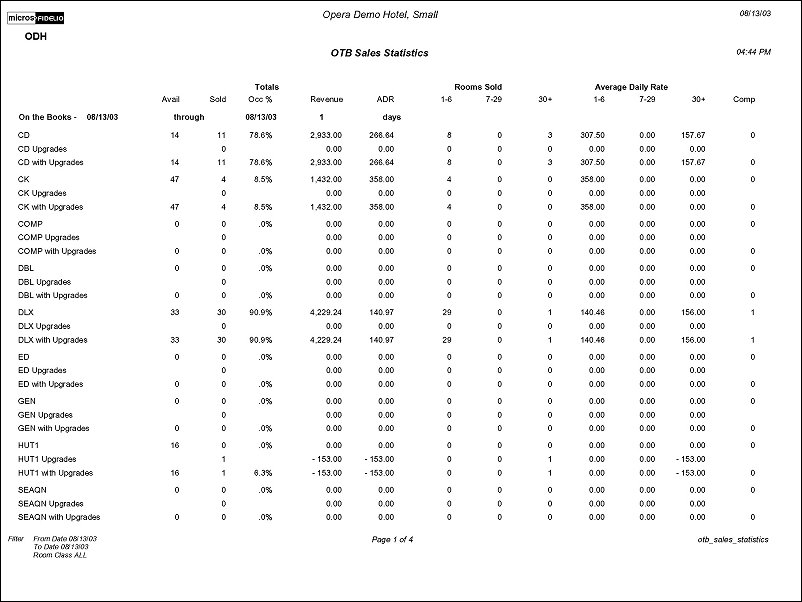
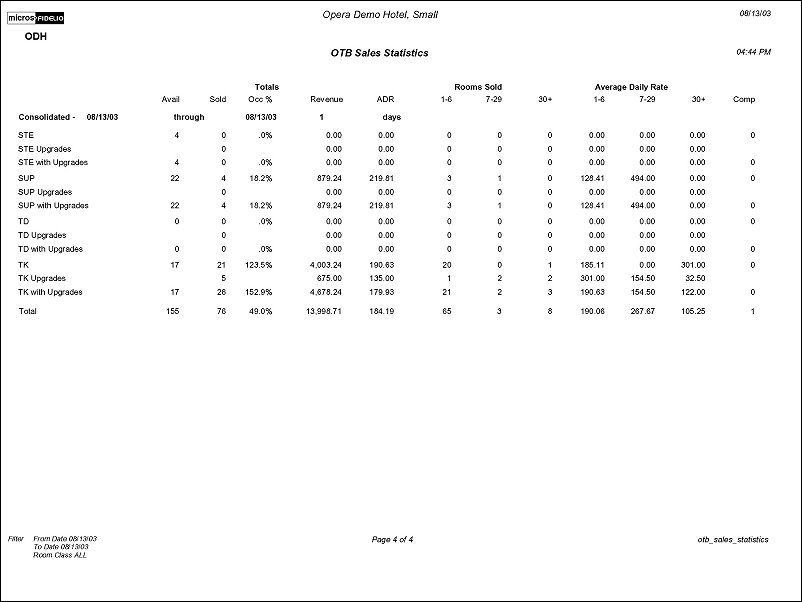
Avail. Total number of rooms available for the room type for the selected date range.
Sold. Total number of rooms sold for the room type for the selected date range.
Occ %. Occupancy percentage for the room type. This figure is calculated by taking the number of rooms sold divided by the number of rooms available.
Revenue. Total amount of revenue from the room type for the selected date range.
ADR. Average daily rate for the room type. Figures is calculated by dividing the revenue by the number of rooms sold.
This section of the report displays the number of nights range that the total number of rooms sold were for.
This section of the report displays the average daily rate for the room type based on the number of nights range that the reservation is for that the room type is attached to.
Number of rooms that were comped for the room type for the selected date range.