
|
|
|
Sales Rep Dashboard
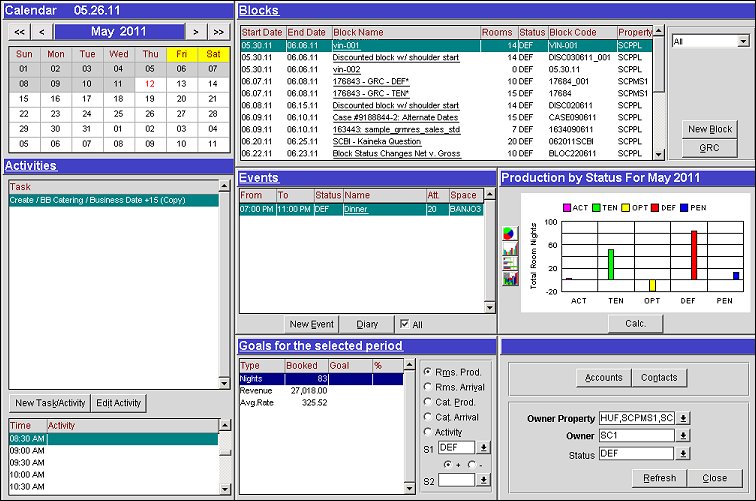
The Sales Rep Dashboard is a customized display for the individual salesperson. It can be designated as the startup screen when the sales rep logs on, or it can be called up by selecting Customer Management>Sales Rep Dashboard.
The Sales Rep Dashboard includes pertinent information for the selected owner: a list of business blocks and events with filter options and links to edit the records; the sales rep's activities; and month-to-date production or arrival statistics. Double-clicking on the Activities, Blocks, Events, and Goals window title bar will allow for the creation or modification of information.
Note: OPERA will save certain values by the user when this screen is closed and default to those values the next time the user opens the Sales Rep Dashboard. These values are: Business Block Display, Status 1, Status 2, Status, Goal Type, Plus/Minus and Owner Property.
The modular design of the Dashboard allows OPERA to function as a complete solution. All your guest interactions can be managed from one easy-to-find quick-key screen to ensure relevant and timely information is available to your staff.
The Sales Rep Dashboard is designed for speed so the focus is not on navigating through the program.
Accounts. Select this option to launch the Account Search screen.
Contacts. Select this option to launch the Contact Search screen.
Owner Property. Available when the OPS_MHT2 OPERA Property Catering Cross Selling license code is active. Select one or more Owner Property(s) from the multi-select property screen.
Owner. Select an Owner ID from the list of values. Only one Owner may be selected.
Note: When more than one property is selected, the Activities, Tasks, Blocks, Events and Goals sections will reflect the combined figures at all the selected properties for the selected owner.
Note: To access the Owner and Owner Property LOVs on this screen, the user must have the permission OWNER_SREP_DASH in group GENERAL granted. Otherwise these fields will default to the name and property of the current user.
Status. Use this list of values to filter business blocks and events by status (e.g., ACT, DEF, PEN, TEN, etc.). After selecting a status, the Refresh button must be used for the list of business blocks and events to be updated.
Refresh. Refreshes the data in the Sales Rep Dashboard.
Close. Select Close to exit from this screen.
Calendar. Users see a calendar that defaults to the current date, with arrows giving access to the previous month or year and the next month or year.
Color Coded Day Types. Weekend days will be displayed with a yellow background.
<< >>. Use the left and right double arrows to turn back or advance the year.
< >. Use the left and right single arrows to turn back or advance the month.
Note: When the Application Parameter>Property Calendar is set to Y, users can double-click on a date in the calendar (i.e. 21) to open the Property Calendar that displays an overview of all the events and day types defined for the time period. Using the Property Calendar, you can see at a glance a broad view of the daily status of the property and manage events or special periods that can affect rates.
The following rules apply for Day Type Codes and Event Codes configured for a specific date (Configuration>Rate Management>Property Calendar>Calendar):
Note: When more than one property is selected, Date Colors for Day Type and Event Codes do not display.
Note: When the Activity>Use Time Zones for Activities application parameter is set to Y, date and time information related to activities will be displayed in the logged-in user's time zone; if no time zone is specified for the logged-in user, the logged-in property time zone is assumed; if the logged-in property does not have a time zone assigned, the database time zone is assumed. See Activity Time Zones for details.
Note: When the application parameter Leads>Notification is set to Y, two additional radio buttons display in the Activities/Tasks Section. These radio buttons (Tasks and Notifications) allow you to toggle between Activity Tasks and Notification Tasks. When the Tasks radio button is selected, activities of classes CALL, CORRESPONDENCE and TO DO, display in the tasks list. When the Notifications radio button is selected, only those activities of the NOTIFICATION class will display.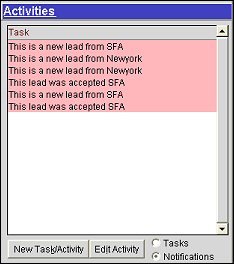
When the application parameter Activity>Activities First In Sales Rep Dashboard is set to Y, Activities are listed first in the bigger box, and Tasks are listed below in the smaller box. When this parameter is set to N the display is switched so that Tasks are listed first and in the bigger box and Activities with the Time column are listed below.
When the Salesrep Dashboard is opened, the first Task listed is selected by default. When a Task is edited from the dashboard, the cursor will remain on that Task once the Activities screen is closed, unless the Task is marked as 'Complete'. When a Task is edited and marked as 'Complete' from the dashboard, the Task will move to the bottom of the task list, and the cursor will move to the first Task in the list once the Activities screen has been closed.
Time. Start time of a schedule activity.
Activity. The defined purpose of this activity. This information populates from the Purpose field of the Activities screen.
New Activity/Task. Select to create a new activity or task for the highlighted block in the Blocks section. See Create an Activity for details.
Edit Activity. Select to edit the highlighted activity/task in the chart or the description of the activity/task displayed in the Task box below.
Note: Activities are color coded to provide clarification of an activity's status at a glance. When an activity/task is listed and is overdue, the task displays in red. If the task has been completed, the task displays in gray.
Task. Displays the description field of the activity.
The block section displays business block names, dates total room nights, rooms status, block code and property filtered by the status selected in the filter at the bottom of the screen. Blocks displayed in this section can be sorted into In-House Blocks, Arriving Blocks, Decision Date, Cutoff Date, Leads Received, or all of them can be viewed at once by using the pull-down list of values.
Start Date. Beginning date of the business block.
End Date. End date of the business block.
Block Name. Name of the business block. Select the name of the block to display the Business Block screen and edit or view the complete block information.
Rooms. Number of rooms associated with the block.
Status. Current status of the block.
Block Code. Reference code associated to the block name.
Property. Property where the block is reserved.
Business Block Filter. Use this option to filter the business blocks for the selected date by the following criteria: In-House Blocks, Arriving Blocks, Block Decision Date, Cutoff Date or All.
New Block. Select to create a new business block, see Business Block Reservations for details.
GRC. Select to display the Group Rooms Control screen, see GRC for details.
From. Time the event is to begin.
To. Time the event is to end.
Status. Current status of the event.
Name. Name of the event. Select the name to display the Event screen and edit or view the complete event information.
Att. Number of attendees for the event.
Space. Space where the event is to be held.
New Event. When the New Event button is selected, the date that is highlighted in the calendar is passed to the new business block or quick event screens. See Create an Event for more details.
Diary. Select to display the Diary screen, see Function Diary for details.
All. If this flag is checked, all events for the selected owner with a start date matching the calendar date are displayed. If unselected, only events for that date that are linked to the booking that is highlighted in the Blocks section are displayed.
The Graph section displays room night production for the selected Owner in the selected Owner Property(s) for the selected month. To begin, select the Calc. button to display the pie graph.
Select one of the chart buttons on the left side of the section to change the graph format. There are currently four different chart displays for this section: Pie Chart, Bar Graph, Horizontal Stacked Bar Graph, and a 3D Bar Graph.
The goals section displays all of the goals that exist for the selected Owner in the selected Owner Property(s) and the variance between the goal and month-to-date production. The booked figures are always month/period to date, regardless of what calendar date within the goal month/period the cursor is placed.
When more than one property is selected, the Goals section will be calculated as the Total Goal for all selected properties (which have a goal within the selected period).
For Example
User (USER1) has the following goals:
User (USER1) selects the Date:
Goals can be displayed by:
Note: The Booked and Goal figures for Rooms Production and Rooms Arrival are converted into the base currency of the logged in property. The Booked and Goal figures for Catering Production and Catering Arrival are converted into the catering currency of the logged in property. If the logged in property does not have a catering currency, the figures will be converted into the base currency of the logged in property.
Type. Type of goal to be obtained.
Booked. Based on the selected Goal and Status, the booked numbers show what has been produced month-to-date (Net) for the sales rep.
Goal. Number set for the sales rep. to reach their goal.
%. Percentage of the goal achieved.
S1/S2. Select one or more statuses from the list of values provided (Actual, Definite, Inquiry, Tentative, etc.) to view the number of room nights/covers, revenues and average rates (Net) of the Rooms Arrival or Catering Arrival radio options (S1 only) or to generate net calculations that deduct negative production values from positive production values for the Rooms Production or Catering Production radio options.
Note: The Catering Revenue Goal is the Sum of the F&B Revenue Goal + Other Revenue Goal.
+/-. Available only when the Catering Production and Rooms Production options are selected, use either the '+' or the '-' to calculate the difference between two Catering Production or Rooms Production Statuses.
Note: When Rooms Production is selected, the Booked Number will only be displayed once a Status has been selected and the Calc button has been pressed.
See Also