Data source types: Essbase
When working with stacked dimensions in an ad hoc grid, and the Suppress Repeated Members option is selected, Essbase positions the suppressed member label above the labels in the next row, up to the first column dimension, using the “proximity rule”. With the proximity rule, when repeated members are suppressed, Essbase compares the stacked dimensions row by row. It groups the non-repeating, unsuppressed members under the closest suppressed member in the previous row. Essbase can then determine which member is being queried and retrieves the data accordingly.
The scenario that follows shows the proximity rule in action.
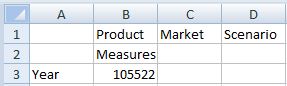
Using the Sample Basic database, select the Ad hoc analysis option. The Measures, Product, Market, Scenario, and Year dimensions are retrieved on the worksheet as shown in Figure 28, Sample Basic Initial Ad Hoc Analysis Grid.
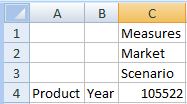
Arrange the dimensions so that there are three “stacked” dimensions and two dimensions side by side, according to Figure 29, Sample Basic Grid with Dimensions Arranged in a Stacked Configuration.
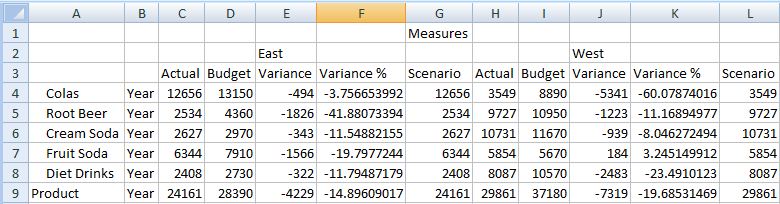
By default, in the Data tab of the Options dialog box, the Repeated Members option in the Suppress Rows group is cleared. Zoom in on the Product and Year members, then zoom in on the Market and Scenario dimensions. The resulting grid looks similar to Figure 30, Zooming in on the Dimensions in the Grid Before Selecting the Repeated Members Option.
Note: | For ease of reading, the South and Central members were removed from the grid in Figure 30, Zooming in on the Dimensions in the Grid Before Selecting the Repeated Members Option and Figure 31, Refresh the Grid After Selecting the Repeated Members Option. |
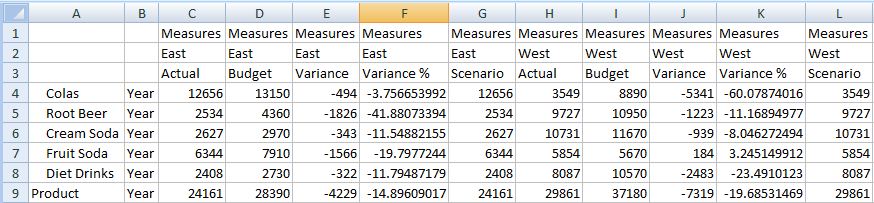
Now, from the Smart View ribbon, select Options, then select the Data tab. In the Suppress Rows group, select the Repeated Members options. Then refresh the sheet. The resulting grid looks similar to Figure 31, Refresh the Grid After Selecting the Repeated Members Option. For each of the column dimensions in rows 1 and 2, where there were suppressed repeated members, the member label is centered above the labels in the next row.
The data in columns C, D, E, F, and G belong to the East member; the data in columns H, I, J, K, and L belong to West. Using the proximity rule, Scenario in column G belongs to East because it is only two columns from the East member, but three columns from the West member.
The Measures dimension label applies to the entire grid.