- Detecting the overload condition and severity
- Shedding work to reduce load.
Policy and Charging DA-MP Overload Control
The number of ingress messages (both Requests and Answers) per second received by PCA is counted as input to PCA ingress message processing capacity. The capacity is an engineering number of ingress messages per second processed by PCA. The number of Request messages received at PCA per second is also measured separately.
PCA defines alarms on the queue utilization levels based on configured threshold values. Thresholds (in percentage) are configured in association with the PCA ingress message capacity. If the ingress message rate received at PCA exceeds the configured percentage of the maximum capacity, alarms will be raised. PCA ingress Request capacity can be engineering configured to provide the value based on which thresholds (in percentage) are configured. See Alarm Settings.
The PCA congestion is then defined by the ingress Request messages capacity and the configured threshold values. PCA will be considered in congestion if the ingress Request rate at PCA exceeds the configured percentages (thresholds) of PCA ingress Request capacity.
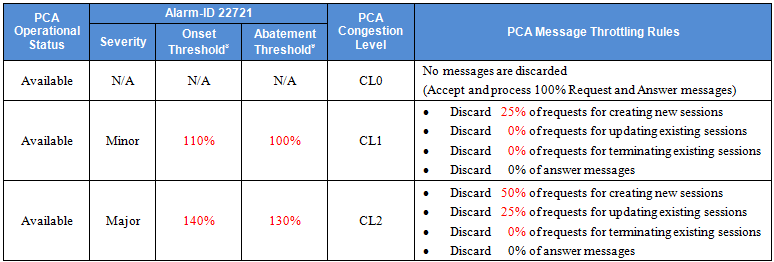
Three PCA congestion levels (CL_1, CL_2 and CL_3) are defined, each of them is associated with onset and abatement threshold values. The onset and abatement values are configurable (see Congestion Options). When PCA is in congestion, a PCA congestion alarm will be raised at the severity (Minor, Major or Critical) corresponding to the congestion level (CL_1, CL_2 or CL_3).
When congestion is detected, PCA will perform overload control by throttling a portion of incoming messages to keep PCA from being severely impacted. The type and percentage of the messages to be throttled will be configurable through the PCA GUI as displayed in Figure 1:
The PCA's internal congestion state contributes to PCA's Operational Status directly, along with its Admin state and Shutdown state. Consequently, the congestion state of the PCA impacts the Diameter Routing Function message transferring decision. Depending on the PCA's Operational Status (Unavailable, Degraded, Available), the Diameter Routing Function will forward all the ingress messages to the PCA when the PCA's Operational Status is Available, or discard some or all of the ingress messages when the Operational Status is Degraded or Unavailable. Table 1 describes the Diameter Routing Function handling of the messages to the PCA.
| PCA Operational Status | Diameter Routing Function Message Handling |
|---|---|
| Available |
Forward all Request and Answer messages to PCA |
| Degraded |
Forward all Answer messages only to PCA |
| Unavailable |
Discard all messages intended for PCA |
SBR Congestion
SBR relies on ComAgent for resource monitoring and overload control. The ComAgent Resource Monitoring and Overload Framework monitors local MP’s resource utilizations, defines MP congestion based on one or multiple resource utilizations, communicates the MP congestion levels to Peers, and reports local MP congestion level to the local application (SBR).
Messages called "stack events" are used for communication to and from ComAgent.
ComAgent defines MP congestion levels based on a CPU utilization metric and ingress stack event rate (number of stack events received per second at local ComAgent), whichever is higher than the pre-defined congestion threshold, and broadcasts the MP congestion state to all its Peers. ComAgent provides APIs that the local SBR can call for receiving congestion level notifications.
SBR congestion is measured based on the SBR CPU utilization level. There are four SBR congestion levels: CL0 (normal), CL1 (Minor), CL2 (Major) and CL3 (Critical). There are related Onset and Abatement threshold values, and Abatement time delays.
The SBR congestion state (CPU utilization) is managed and controlled by the ComAgents on both PCA and SBR MPs based on the ComAgent MP Overload Management Framework. Messages to a SBR from a PCA are handled based on the congestion state of the SBR. A SBR congestion alarm will be raised when MP congestion notification is received from ComAgent. The appropriate alarm severity information will be included in the notification. The alarm will be cleared if the congestion level is changed to Normal, also indicated in the notification from ComAgent.
In order to manage the overload situation on a SBR, all stack event messages are associated with pre-defined priorities. Before a stack event message is sent, its priority will be compared with the congestion level of the SBR to which the stack event is sent. If the priority is higher than or equal to the SBR current congestion level, the message will be forwarded. Otherwise, it will be discarded.
The stack events may also be routed from a SBR to another SBR in some scenarios. The congestion control in this case should be conducted based on the congestion state of the receiving SBR, i.e. the ComAgent on the sending SBR is responsible to compare the stack event priority with the congestion level of the receiving SBR and make the routing decision accordingly.
Load Shedding
After the SBR has determined that it is in overload (CL1 – CL3), it informs ComAgent that its resources and sub-resources are in congestion. ComAgent then broadcasts this information to all of the resource users for the specified resources and sub-resources. The resource users now begin to shed load by sending only certain requests for database updates. The resource users determine which database requests to discard based on the current congestion level of the resource provider.
Database requests are delivered to SBRs using ComAgent stack events. Each stack event has a priority. The resource user software (on either DA-MPs or SBRs) sets the stack event priority for every Stack Event it sends, depending on the type of stack event and the circumstances under which the Stack Event is being used. For example, the same stack event may be used for signaling and for audit, but may have a different priority in each circumstance. The Stack Event priority is compared with the congestion level of the server that is the target of the stack event to determine whether stack event should be sent, as shown in Table 2.
| Congestion Level | Description |
|---|---|
| CL0 | The resource provider is not congested. No load shedding occurs. Send all Stack Events. |
| CL1 | Minor congestion. Auditing is suspended. Send all Stack Events not related to auditing. |
| CL2 | Major congestion. No new bindings or sessions are created. Existing bindings and sessions are unaffected. Send only Stack Events related to existing sessions. |
| CL3 | Critical congestion. Send only Stack Events already started and Stack Events that remove sessions or bindings. |