Message Center
Oracle Enterprise Manager Ops Center displays incidents, generates notifications, displays service requests that are generated with the ASR feature in Enterprise Manager Ops Center, and the warranty information of an asset.
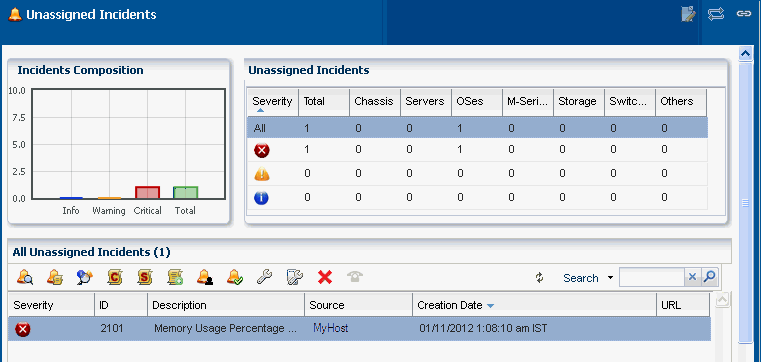
You can view details about unassigned incidents in the Unassigned Incidents queue in the Message Center. The Message Center displays the composition of incidents, the severity level for different types of assets with the severity status icon. It displays all unassigned incidents with Severity, Incident ID, Incident Description, Incident Source, Incident Creation Date, and URL. Hover your mouse on an unassigned incident to view details such as Duration, Assigned Date, Suggested Actions, Owner, Source and so on.
Figure 3-4 shows the unassigned incidents in the Message Center.
Figure 3-4 Unassigned Incidents in Message Center

Description of "Figure 3-4 Unassigned Incidents in Message Center"
You can view incidents that are assigned to you in the My Incidents queue of the Message Center. A bar chart in the Incidents composition section displays the number of new incidents by severity. The page also displays a table that categorizes the incidents by severity and type of asset. You can select an incident in the All My Incidents section to perform the following operations.
-
View Alerts: View the alerts that comprise an incident.
-
View Annotations: View all comments and notes created by alerts and any operation related to the incident. You can also view any suggested actions associated to the type of incident.
You can edit or delete the annotations that you have created. An administrator has the privileges to edit or delete any annotation.
-
View Possible Impacts and Causes: View the possible causes and impacts of an incident.
-
View Comments: You can view all comments associated with the selected incident. You can also add a comment to an incident.
-
View Suggested Actions: You can view all actions in the Incident Knowledge Base that are related to the incidents, and any actions entered specifically for the incident through Add Annotation. To include the suggested action in the Incident Knowledge Base, select the Save this annotation in the Incident Knowledge Base to associate the annotation with all incidents of this type and severity check box.
-
Assign Incidents: You can assign one or more incidents to the user. The table enables multiple selection of incidents to be assigned to the user.
-
Add Annotation to Incidents: You can add a comment or a suggested action to one or more incidents. When you add a suggested action, you can add an associated Operational Plan to the suggested action. Then save and execute it.
-
Acknowledge Incident: Acknowledging an incident changes the state of one or more incidents to Acknowledged to indicate you are investigating. This action relocates the selected incidents to the My Incidents category.
-
Take Action on Incidents: Indicates that you can take appropriate action on one or more incidents of the same type, with the same attribute.
-
Mark Incidents as Repaired: It moves the state of one or more incidents to Being Repaired. When an incident is in a state of Being Repaired no actions should be taken upon it.
-
Close Incidents: When you close an incident, the continued monitoring creates a new incident.
-
Open Service Requests: Opens a service request for the incident. You must be connected to My Oracle Support through the user interface to open a service request.
Similarly, you can view the incidents that are assigned to others by clicking Incidents Assigned to Others.
Message Center enables you to view all of your open service requests and the service requests that are opened by others.
Oracle Enterprise Manager Ops Center generates notifications for all event operations and when the set thresholds are exceeded. Message Center lets you delete a selected notification or delete all notifications.
Below the title bar, a set of icons summarizes the Incident status, as shown in Figure 3-5. The icons from the left are Unassigned Critical Incident, Unassigned Warning Incident, All Relayed Incident, My Critical Incident, and My Warning Incident. The number next to each icon indicates the count of incidents for the particular status. Hover the cursor over an icon to view information that identifies the most recent incident. These icons provide you with the current status of incidents while you perform other operations. Figure 3-5 shows the incidents count in the masthead of Oracle Enterprise Manager Ops Center. These icons appear at the top of the Navigation pane in the user interface.
Figure 3-5 Incidents Count in the Masthead
Description of "Figure 3-5 Incidents Count in the Masthead"
To view more information about the incidents, click an incident icon. The icons redirect you to the corresponding category in the Message Center. For example, clicking the Unassigned Warning Incident icon below the title bar redirects you to Message Center and displays detailed information about those number of Warning Unassigned Incidents in the center pane. Similarly, when you click Unassigned Critical Incident, it redirects you to Message Center and displays detail about the Critical Unassigned Incidents. Double-click the selected incident to view details such as Summary, Membership Graph, Status, and Compliance Reports. For more information about Incidents, see Oracle Enterprise Manager Ops Center Operations Guide.