About the Message Center
Incidents, notifications, and service requests that are generated by assets appear in the Message Center.
Each time a monitored attribute does not meet its monitoring rule, a new alert is generated. The first alert raises an incident, which appears in the Message Center. Subsequent alerts for the same rule and asset are correlated with the same open incident.
When a value for an attribute exceeds its monitoring rule and then later meets the rule, the alert is cleared automatically but the incident is not cleared automatically. When an attribute's value is moving in and out of its monitoring rule's parameters, alerts are generated and cleared continuously. A new incident is only generated when the original incident is closed. While an incident is not closed, new alerts are aggregated into the existing incident. You must close an incident to clear it from the user interface.
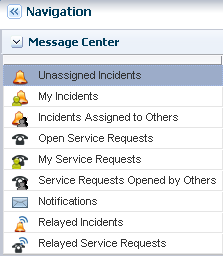
Incidents, notifications, and service requests that are generated by assets appear in the Message Center, shown in Figure 3-2, according to the categories described in Categories in the Message Center.
Categories in the Message Center
Lists the different categories in the message center. Incidents, notifications, and service requests appear in those categories in the Message Center.
Incidents, notifications and service requests appear in the following categories in the Message Center:
-
Unassigned Incidents: Newly created incidents and those that have not been assigned an owner.
-
My Incidents: All incidents that are assigned to you. You can perform additional actions to these incidents to manage their status, such as: Take Action, mark as being repaired, acknowledge, and open a service request for the incident.
-
Incidents Assigned to Others: Incidents that are currently assigned to other users. You can view these incidents, but you cannot perform specific actions on them.
-
Open Service Requests: All Service Requests that have been filed on assets that are submitted through Oracle Enterprise Manager Ops Center.
-
My Service Requests: All Service Requests that you submitted on assets that are managed by Oracle Enterprise Manager Ops Center.
-
Service Requests Opened by Others: All Service Requests that have been submitted on assets that are managed by Oracle Enterprise Manager Ops Center.
-
Notifications: Information that is automatically generated by services running in the backend while monitoring the assets. Typically, notifications are less important than incidents.
-
Relayed Incidents: All incidents reported from any discovered Oracle Engineered System. You must log in to the Oracle Enterprise Manager Ops Center instance that manages each Oracle Engineered system to fix any incidents related to its assets.
-
Relayed Service Requests: All open Service Requests for any discovered Oracle Engineered System.
Closed incidents and service requests do not appear in the Message Center.
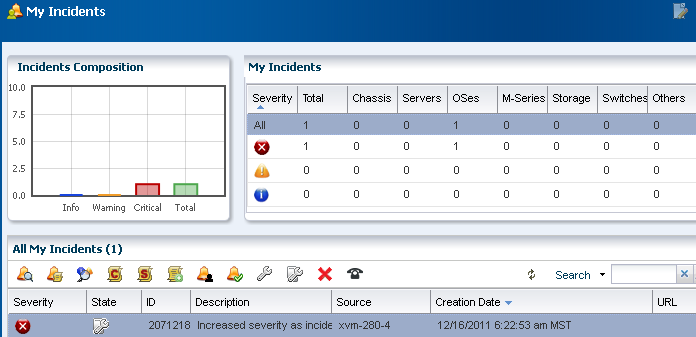
My Incidents, Unassigned Incidents, and Incidents Assigned to Others have a dashboard with the same format: a bar chart, a table of incident counts sorted by severity and asset, and a table of incidents sorted by ID.
All Unassigned Incidents Dashboard
The All Unassigned Incidents dashboard shows all open unassigned incidents. Each incident receives an ID to help you to track the issue.
The table includes a description, source, Creation Date, and URL field for each incident. Hover over the URL icon for an incident to display a pop-up window. The default sort is by the creation date; however, you can sort by any column.
Figure 3-3 Unassigned Incidents Dashboard
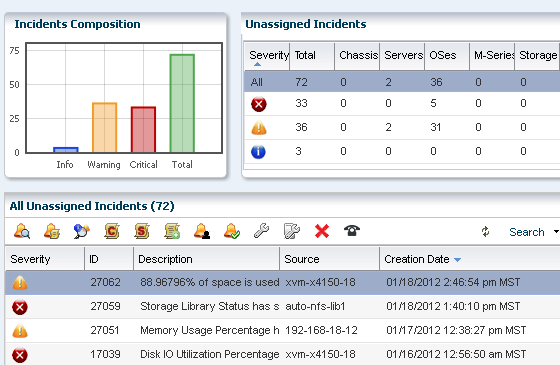
Description of "Figure 3-3 Unassigned Incidents Dashboard"
The following information is available in the Unassigned Incidents table:
-
Severity: The severity icon shows the severity level, either informational (info), warning, or critical.
-
ID: A generated ID assigned to the incident to help track the issue.
-
Description: A brief description of the incident.
-
Source: The asset that is generating the incident.
-
Creation Date: The date and time that the incident generated.
-
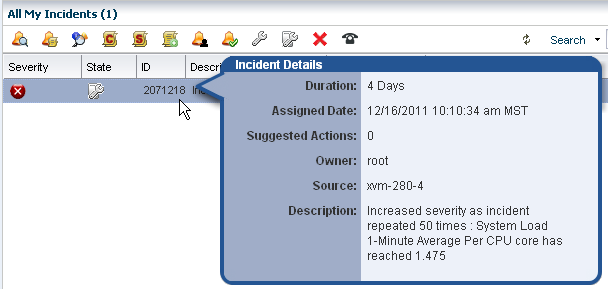
URL: Contains incident details. Hover over the URL icon to display the duration of the incident, when the incident was assigned, to whom the incident was assigned, any suggested actions, the source of the incident, and a larger description field.
A row of icons at the top of the Unassigned Incidents table provides actions that are available to you, based on your user role. The following action icons are available for incidents, the actions are in the order that the icons appear in Link Figure 9–3:
-
View Alerts
-
View Annotations
-
View Possible Impacts and Causes
-
View Comments
-
View Suggested Actions
-
Add Annotation to Incidents
-
Assign Incidents
-
Acknowledge Incidents
-
Take Actions on Incident
-
Mark Incidents as Repaired
-
Close Incidents
My Incidents Dashboard
Incidents assigned to you appear in the My Incidents dashboard in the Message Center. Anybody with the appropriate permission level can see the incidents in your queue, can reassign incidents to another user, and can assign you new incidents.
A bar chart on the page visually displays the number of new incidents by severity. The page also contains a table that categorizes the incidents by severity and asset type.
Select a row in the table to display all incidents for the selected severity category and to drill down for more details. The software assigns each incident an ID for tracking purposes. Hovering your mouse over any field in the incident row displays details.
The icons in the center pane enable you to perform actions on a specific incident or view the alerts that make up an incident in the center pane. Each icon has text to define the action.
The following actions, as described in Actions for Incident Management, are available:
-
View Alerts
-
View Annotations
-
View Possible Impacts and Causes
-
View Comments
-
View Suggested Actions
-
Add Annotation to Incidents
-
Assign Incidents
-
Acknowledge Incidents
-
Take Actions on Incident
-
Mark Incidents as Repaired
-
Close Incidents
-
Open a Service Request
The Notifications appear in the Message Center. You can also configure the software to send you e-mail or pager notification of incidents for critical assets or severity levels.
About Incident Severity Badges
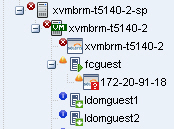
You can display incident severity badges next to an asset in the Navigation pane and in the dashboard's membership graph. The highest severity badge in a group is also displayed next to the parent asset.
See Badges in the Oracle Enterprise Manager Ops Center Concepts Guide for a description of each badge.
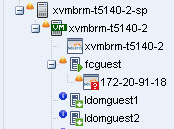
Figure 3-8 shows the example of the operating system for the asset xvmbrm-t5140-2 with a critical incident. The critical incident badge also appears on the system and service processor. Every group that this OS is a member of, such as All Assets and Operating Systems, also displays the badge.
When the incident is the only critical incident, the badge is removed when the incident is acknowledged, marked repaired, or closed. When open incidents are still present, the next highest severity badge displays. For example, when both a Critical and a Warning incident is detected and the Critical incident is acknowledged, the Critical badge is replaced with the Warning badge because that is now the highest level unacknowledged incident.
After the incident is closed, its severity badge is not displayed in the asset hierarchy.
