Understanding Hardware Counter CPU Cycles Profiling Metrics
This part of the tutorial requires an experiment with data from the cycles counter. If your system does not support this counter, your experiment cannot be used in this section. Skip to the next section Understanding Cache Contention and Cache Profiling Metrics.
-
Select the Overview page and enable the derived metric Cycles Per Instruction and the General Hardware Counter metric, CPU Cycles Time.
You should keep Total CPU Time and Instructions Executed selected.

-
Return to the Source view at computeB().

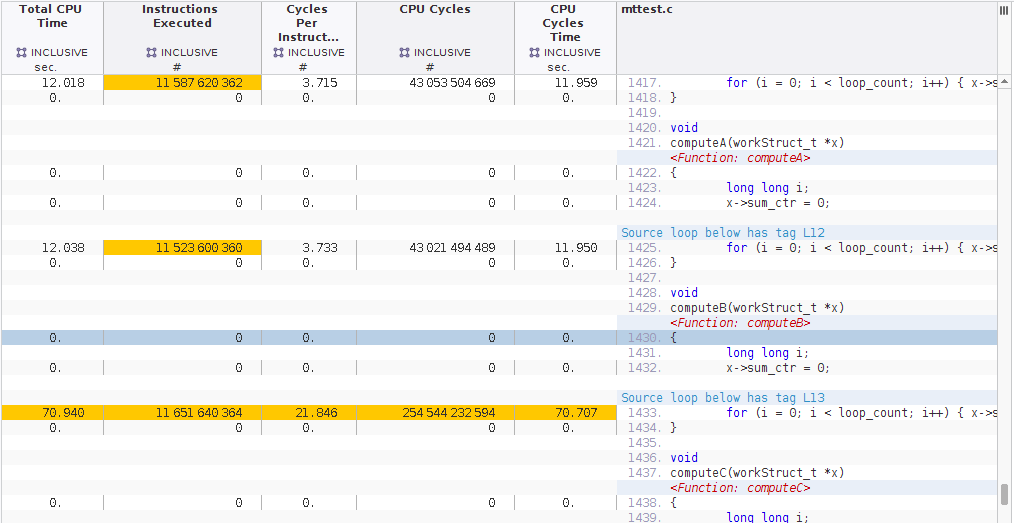
Note that the Incl. CPU Cycles time and the Incl. Total CPU Time are roughly equivalent in each of the compute*() functions. This indicates that the clock-profiling and CPU Cycles hardware counter profiling are getting similar data.
In the screen shots, the Incl. CPU Cycles and the Incl. Total CPU Time are about 12 seconds for each of the compute*() functions except computeB(). You should also see in your experiment that the Incl. Cycles Per Instruction (CPI) is much higher for computeB() than it is for the other compute*() functions. This indicates that more CPU cycles are needed to execute the same number of instructions, and computeB() is therefore less efficient than the others.
The data you have seen so far shows the difference between that computeB() function and the others, but does not show why they might be different. The next part of this tutorial explores why computeB() is different.