| Oracle® Retail Xstore Point of Service User Guide Release 18.0 F12254-01 |
|

 Previous |
 Next |
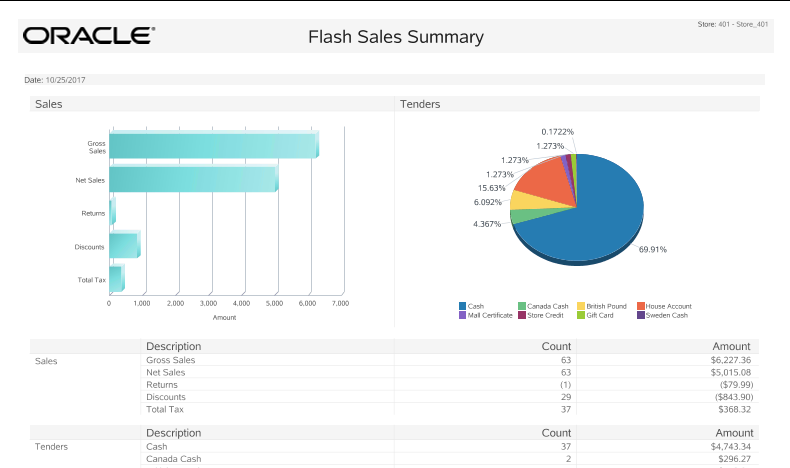
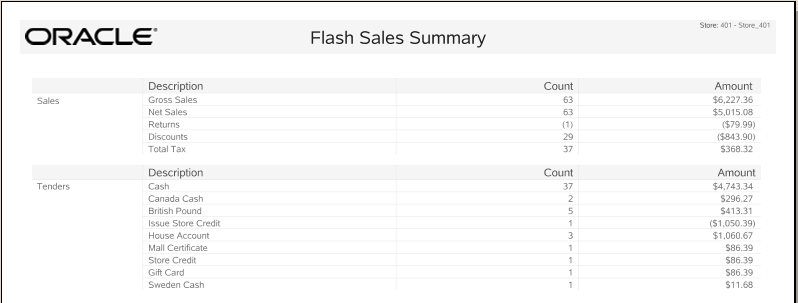
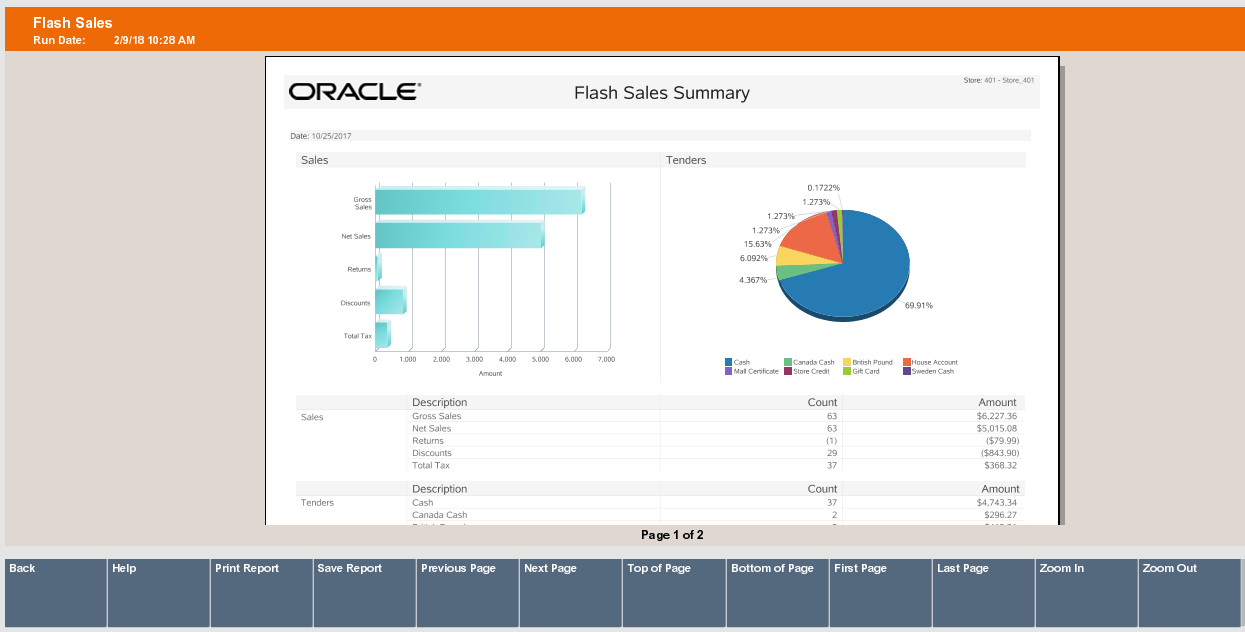
From the register you can view the Flash Sales Summary Report which provides an instant snapshot of sales at the moment that you select it. The report displays data in a column format as well as in graphic format with bar charts and pie charts. It includes sales results from two perspectives:
Sales - The count of transactions and the dollar amount of the transactions in the following categories: gross sales, net sales, returns, discounts and total tax.
Tenders - The count of transactions and the dollar amount for each tender type that was used such as cash, various credit cards, store credit, gift certificates, and so on.
The last page of the Flash Sales Summary report includes a pie chart of the tenders used and a bar chart of the sales results.
You can set the date parameters that are used to select the data included in the report, and to specify whether or not zero values are suppressed and whether or not the charts are shown. See Running the Flash Sales Summary Report.
The report may be viewed online and printed immediately, or saved so that it may be viewed later. Saved reports may be preserved with the original selection parameters or with the original data.
Additional Flash Sales reports are accessible from the Back Office Reports Menu. Refer to the Oracle Retail Xstore Point of Service Manager's Guide, and the Oracle Retail Xstore Point of Service Reports Guide for more information about the Flash Sales Report.
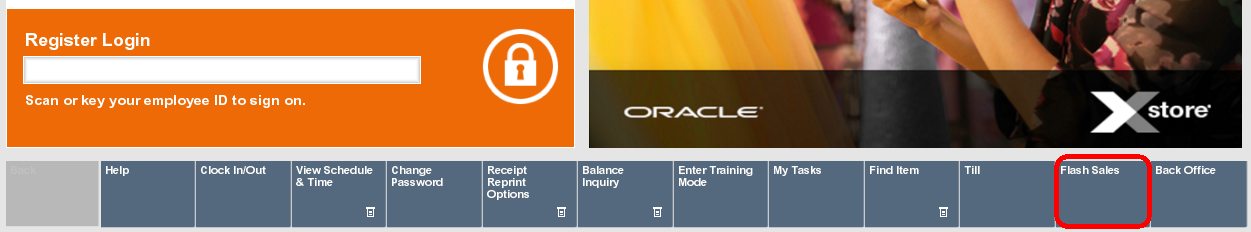
To run the Flash Sales Summary Report from the Register Login screen:
Click Flash Sales in the Register Login screen.
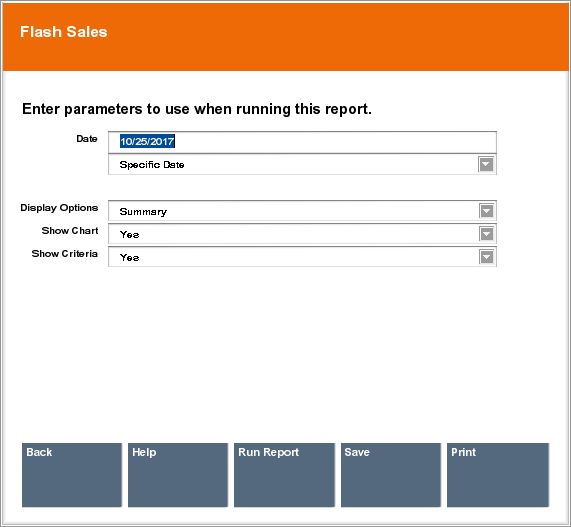
The Flash Sales criteria window opens.
Enter the report criteria:
Start Date/Specific Date - Enter a date on the top line or select a relative date from the drop-down list.
Display Options - Select how the report will display data:
Summary - Display a summary of all data.
By Department - Organize the data by the item department.
By Employee - Organize the data by the employee who performed the sale.
By Hour - Organize the data by the hour at which the sales were made.
Show Chart - Select Yes to display a chart or No to only show data.
Show Criteria - Select Yes to display the criteria used when creating the report or No to only show the results.
Finish the report:
Click Run Report to execute the report and display the results on the screen.
Click Print to execute the report and send the results to a printer.
Click Save to keep the report with the current data, or save only the report parameters to run this specific report with these parameters again. See Save a Report or Report Parameters for more information.
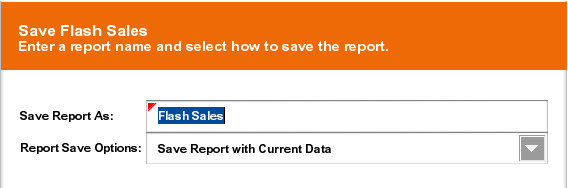
To save a report or the parameters for a report:
Click Save in the Flash Sales report criteria window.
A Save Flash Sales Summary window opens.
Enter the save file information:
Save Report As - Name of the save file.
Report Save Options - The information to be saved:
Save Report with Current Data - To save the report with the current values.
Save Report Parameters - To save only the parameters to use these parameters as a template to generate a new report at another time.
Select OK.
The report is saved to your personal report area and can be retrieved from the Back Office Main Menu by selecting Reports, then the Saved Reports option.
|
Note: Refer to the Oracle Retail Xstore Point of Service Reports Guide for more information about setting up and running reports. |
All the Flash Sales Reports have a consistent interface for navigating through multi-page reports, changing the display size, printing reports and saving reports so that they may be reused.
After you make your criteria selections and a report is displayed on the screen, options display at the bottom of the screen:
Back - Return to the criteria selection screen for the report.
Print Report - Send the report to a printer.
Save Report - Assign a name to the report so that it can be reused later with current criteria or current data.
Previous Page/Next Page - Go to the next lower page number or next higher page number.
Top of Page/Bottom of Page - Go to the beginning or end of the current page number.
First Page/Last Page - Jump to page 1 or the last page number in the report.
Zoom In/Zoom Out - Increase or decrease the on-screen magnification of the text.