| Oracle® Retail Xstore Point of Service Reports Guide Release 19.0 F21535-03 |
|

 Previous |
 Next |
This chapter contains information about the following reports:
The Flash Sales reports provide an instant snapshot of sales at the moment that you select one of the reports. Three of the four reports display data in a column format and also in graphic format as bar charts and pie charts. The exception is the Flash Sales by Employee Report which does not include charts.
The Flash Sales Reports include four different reports, each of which may be displayed on the screen or printed:
|
Note: The different Flash Sales Reports are selected by using the Display Options drop-down selection menu after selecting Flash Sales in the Reports menu. |
Each of the reports provides a criteria selection screen where you can set the parameters that are used to select the data included in the report.
All of the reports may be viewed online and printed immediately, or saved so that they may be viewed later. Saved reports may be preserved with the original selection parameters or with the original data.
The Flash Sales reports are accessible from the Back Office Reports Menu and from the Employee Login screen.
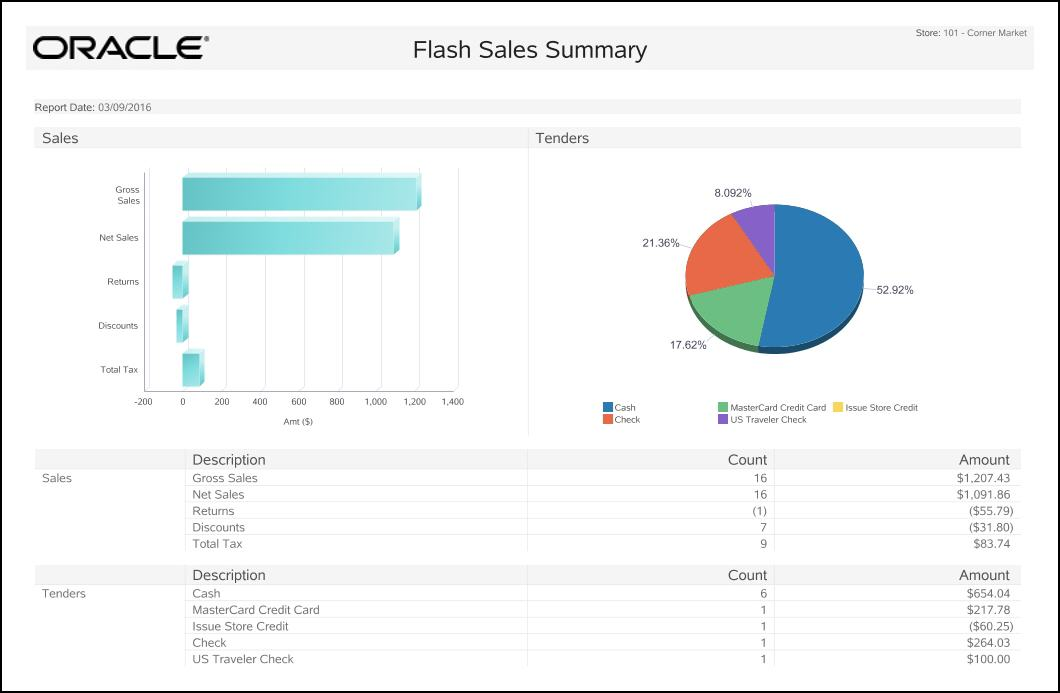
The Flash Sales Summary Report provides current sales results for the entire store. It includes a look at sales results from two perspectives:
Sales - The count of items and the total amounts in the following categories: gross sales, net sales, returns, discounts and total tax.
Tenders - The count of tenders and the total amounts for each tender type that was used such as cash, various credit cards, store credit, gift certificates, and so on.
If the Show Chart option is selected, the last page of the Flash Sales Summary report includes a pie chart of the tenders used and a bar chart of the sales results. These bar charts and pie charts provide you with a quick graphical overview of the flash sales data.
Table 3-1 Flash Sales Summary Reports Parameters
| Parameter | Description |
|---|---|
|
Description, Count, and Amount for the following: |
|
|
Sales |
|
|
Gross Sales |
Total count and amount of items sold. Note: Due to the way some tax amounts are rounded, there are circumstances where the gross sales amount will not equal the total of all tender amounts collected. |
|
Net Sales |
Count for net sales is the number of items sold minus the number of items returned. Amount calculation is Gross Sales minus Tax, minus Discounts, minus Returns. |
|
Returns |
Total count and amount of returned items including any markdowns. |
|
Discounts |
Total amount of discounts applied to items sold and the discounted item count. |
|
Total Tax |
Total tax count and amount for all items sold |
|
Tenders |
|
|
All tender types accepted at your store will be listed here. |
|
Select an option or make entries in any of the following fields to determine report output:
Start Date: Enter a single fixed date or select a relative date option from the drop-down list.
Suppress Zeros: Select Y (Yes) or N (No) to determine whether values of zero display.
Show Chart: Select Y (Yes) or N (No) to determine whether a graph(s) of the data displays on the last page of the report.
Type of Flash Sales Report: Select Summary for the Flash Sales Summary Report.
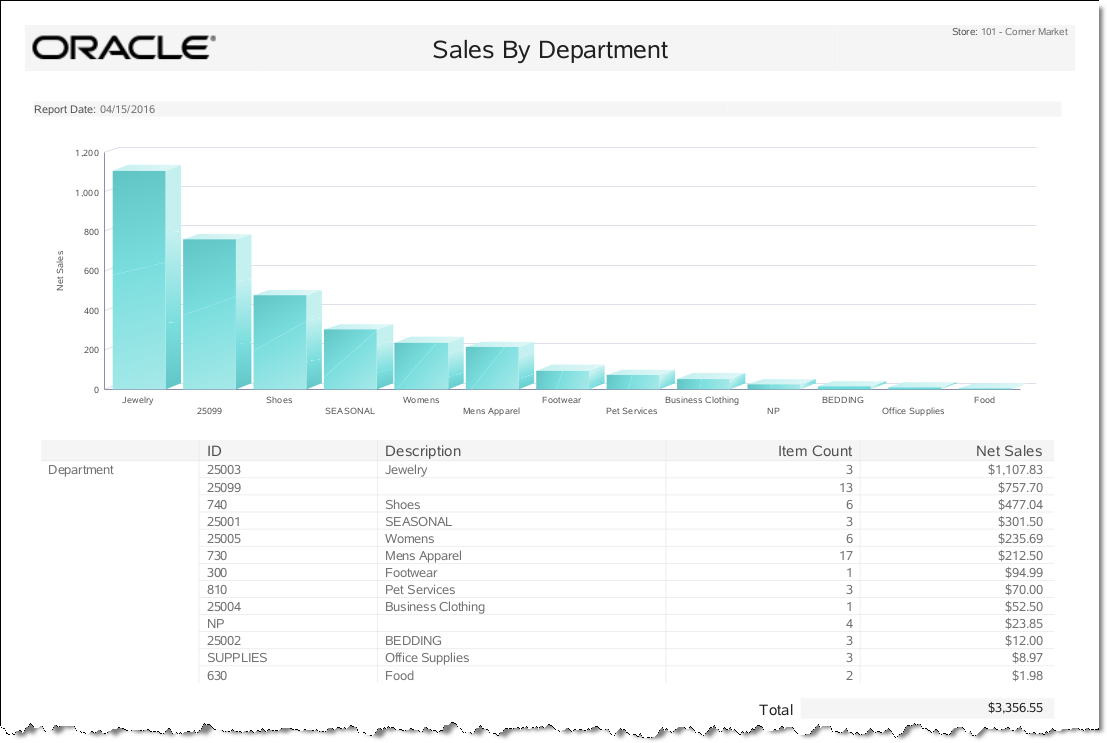
The Flash Sales by Department Report provides current sales results for each department. It includes the department name and number, count of items in each department, and the total amount of the sales per department.
If the Show Chart option is selected, the last page of the Flash Sales by Department Report includes a vertical bar chart showing monetary values per department, providing you with a quick graphical overview of the flash sales by department data.
Table 3-2 Flash Sales by Department Report Parameters
| Parameters | Description |
|---|---|
|
ID |
Department ID |
|
Description |
The name and identifier for each department in your store. |
|
Count |
The item count for each department. |
|
Amt. |
The total amount sold (net) for each department. |
|
Total |
Report count and net sales amount total for all departments. |
Select an option or make entries in any of the following fields to determine report output:
Start Date: Enter a single fixed date or select a relative date option from the drop-down list.
Show Chart: Select Y (Yes) or N (No) to determine whether a graph(s) of the data displays on the last page of the report.
Type of Flash Sales Report: Select Department for the Flash Sales by Department Report.
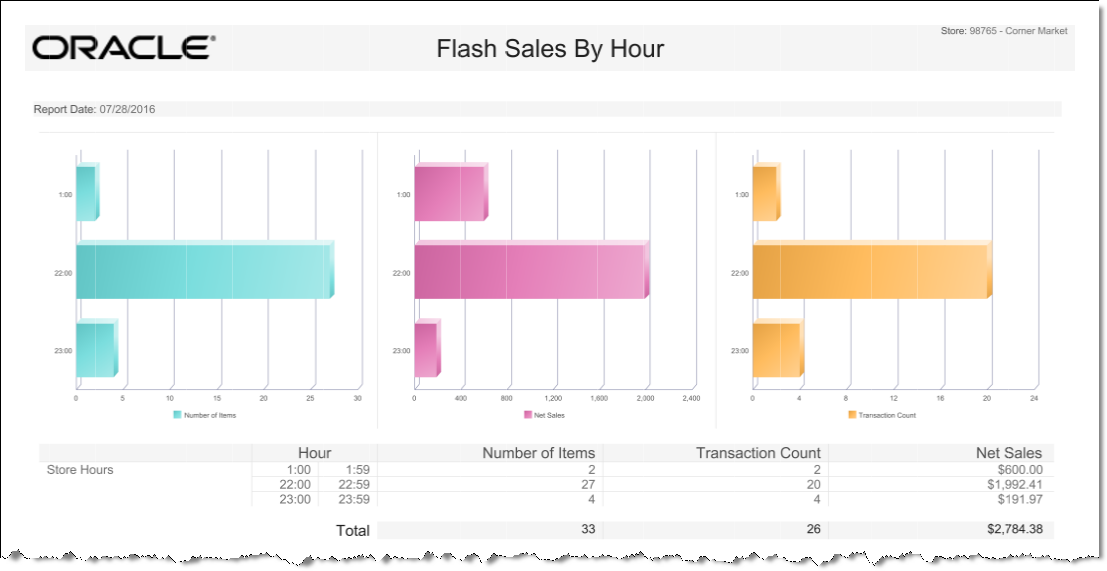
The Flash Sales by Hour Report provides current sales results for the entire store in hourly increments. It includes an hour-by-hour breakdown of sales, and shows the transaction count per hour, item count per hour, and net sales per hour.
If the Show Chart option is selected, the last page of the Flash Sales by Hour Report includes a horizontal bar chart showing sales amounts, item count, and transaction count per hour.
Table 3-3 Flash Sales by Hour Report Parameters
| Parameter | Description |
|---|---|
|
Period |
The hourly increment. |
|
Item Count |
The item count. |
|
Transaction Count |
The transaction count. |
|
Net Sales |
Net Sales = Gross Sales minus tax, minus discounts, minus return. |
|
Total |
Total net sales for the day. |
Select an option or make entries in any of the following fields to determine report output:
Start Date: Enter a single fixed date or select a relative date option from the drop-down list.
Show Chart: Select Y (Yes) or N (No) to determine whether a graph(s) of the data displays on the last page of the report.
Type of Flash Sales Report: Select Hour for the Flash Sales by Hour Report.
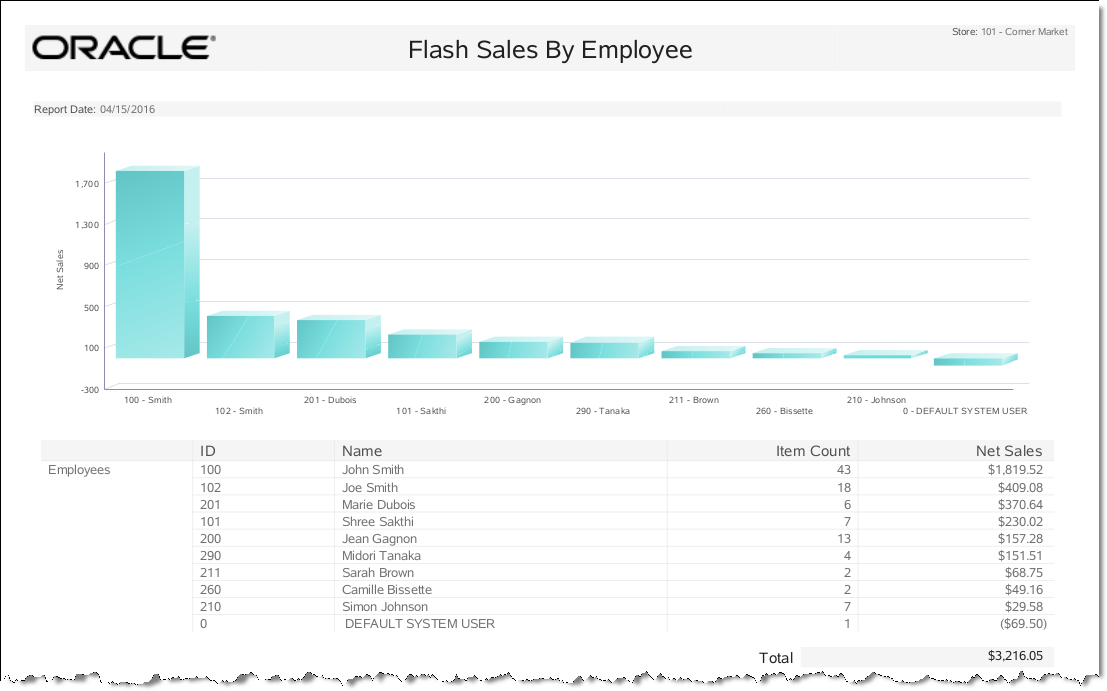
The Flash Sales by Employee Report provides up-to-the-moment sales results on a specified date for every employee. It includes the employee name and ID, number of transactions, and the total monetary value of those transactions.
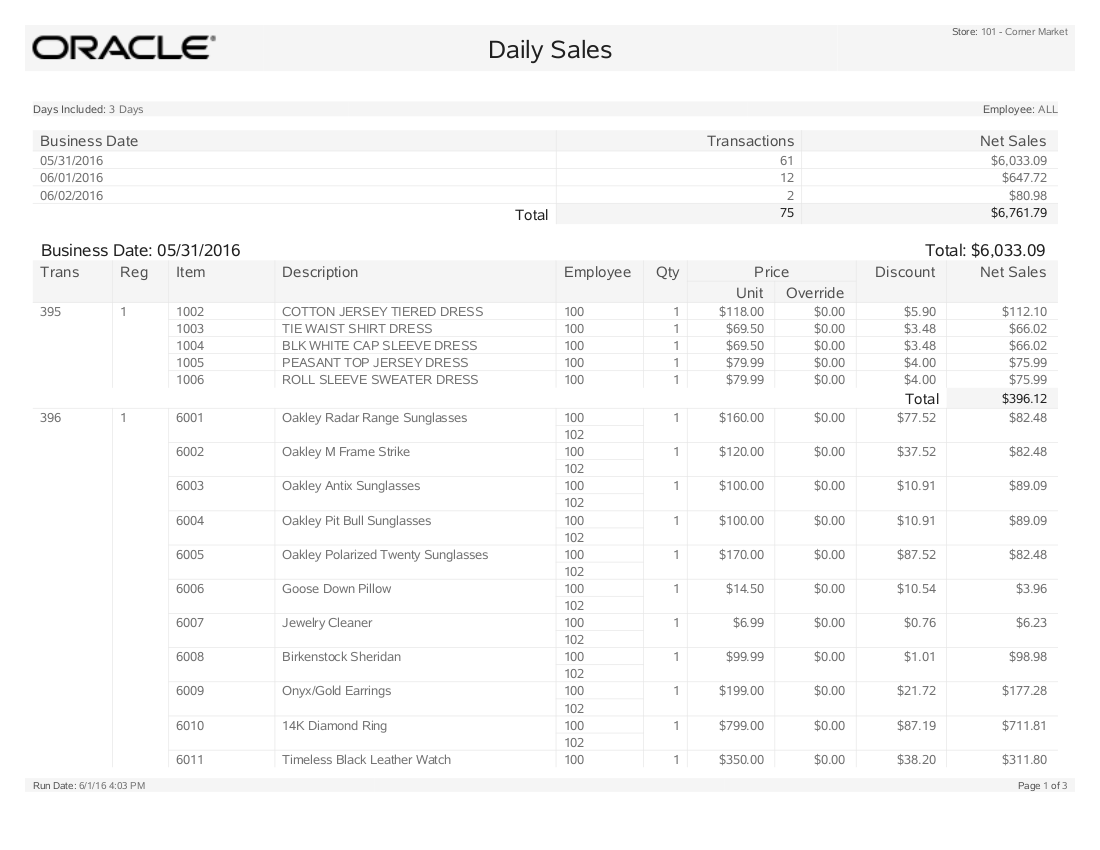
The Daily Sales Report provides a list of transactions by date, and the items sold in each transaction for an employee. For each item, the information includes the item price, override price, item quantity, any markdown applied, and the net sale amount for the item. Total net sales for all of the items on each transaction is given. At the end of the report, a total net sales amount for the date range is shown.
Table 3-5 Daily Sales Report Summary Parameters
| Parameters | Description |
|---|---|
|
Business Date |
The business date the transaction took place. |
|
Transaction |
The transaction identifier. |
|
Net Sales |
The net sale amount for the transaction. |
Table 3-6 Daily Sales Report Detail Parameters
| Parameters | Description |
|---|---|
|
Business Date |
The business date the transaction took place. |
|
Trans |
The transaction identifier. |
|
Req |
The register number. |
|
Employee |
The employee identifier. |
|
Item |
The item number. |
|
Description |
A description of the item. |
|
Qty |
The item quantity. |
|
Unit |
The item's price per unit. |
|
Override |
The override price on the item. |
|
Discount |
The discount amount. |
|
Net Sales |
The net sale amount for the transaction. |
|
Total For [Transaction #] |
The total net sale amount for the transaction. |
Select an option or make entries in any of the following fields to determine report output:
Start Date: Enter a single fixed date from which to run the report.
Prior Days Included: This limits the number of days to include in the report, working back from the Start Date.
Employee: Enter an Employee ID to restrict the information to one employee.
Show Daily Totals: This indicates whether or not to include the daily sales totals.
Show Criteria: This determines whether or not to show the criteria header.
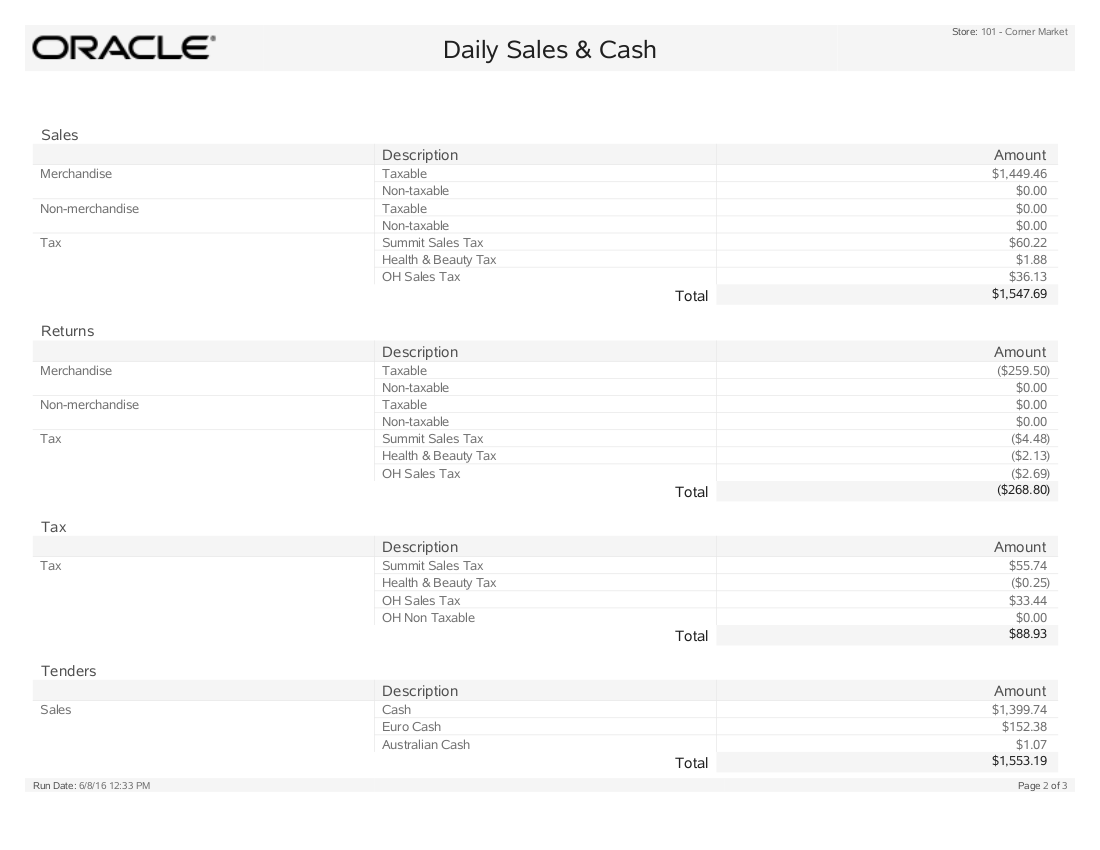
The Daily Sales and Cash Report provides information about sales and adjustments for both merchandise and non-merchandise items sold within the date range specified. This date range can be for the current date, the previous day, or for a specific date.
The report includes the following categories and sub-categories with totals:
Table 3-7 Daily Sales and Cash Report Parameters
| Parameters | Description |
|---|---|
|
Sales Summary Details |
Sales, Returns, Markdowns, Total Tax Note: The Markdowns section in this area of the report includes both Deals and manually-entered discounts. |
|
Tender Summary Details |
Sales, Refunds, Paid In, Paid Out |
|
Sales Category |
Merchandise (Taxable/Non-Taxable), Non-Merchandise (Taxable/Non-Taxable), Markdowns, Tax Note: The Markdowns section in this area of the report only includes manually-entered discounts and does not include deals. |
|
Returns Category |
Merchandise (Taxable/Non-Taxable), Non-Merchandise (Taxable/Non-Taxable), Markdowns, Tax |
|
Tax Category |
Tax breakdown data. |
|
Tenders Category |
Sales, Refunds, Petty Cash |
|
Unreported Cash Summary |
Charitable donation |
|
Count Summary Count |
Sales Transaction Customer Count, Post Void Retail Transaction Count, Post Void other Transaction Count, Line Void Item Count, Line Void Tax Count, Line Void Tender Count |
Select an option or make entries in any of the following fields to determine report output:
Start Date: Enter a single fixed date or select a relative date option from the drop-down list.
Show Criteria: Indicates whether to include the criteria selection information in the header.