38 Monitoring Oracle Operating Systems
This chapter contains information about monitoring Oracle Solaris and Linux operating systems, or hosts.
The following topics are covered:
38.1 Get Started with Monitoring Oracle Operating Systems
The operating system is part of the core platform and its metrics are leveraged across other targets in Enterprise Manager. This chapter only covers Oracle Solaris and Linux monitoring.
To view all the hosts monitored by Oracle Enterprise Manager, select Hosts in the Targets menu of the Enterprise Manager Cloud Control. The Hosts section of the user interface displays Oracle Solaris and Linux operating system configuration, resource and process metrics. Performance and resource metrics provide you with a unified view of an operating system's CPU, memory, and process resource usage, enabling you to manage and optimize resources.
Monitoring is activated when you discover and manage the operating system. A series of escalating status levels notifies you when something is not operating as expected. The lowest level incident status is warning, then critical, and the highest level is a fatal incident.
The information provided about an operating system is designed to help you maximize performance and utilization. The Host Summary provides a high-level overview of the host. You can drill down to view CPU and resource usage and deeper to view the processes that are running on the host, and real time display of current top processes on a host.
The following features are available for operating systems:
-
OS details: Displays operating system resource and processes information, Oracle Solaris Zones and boot environments.
-
Incidents: Notification of incidents with links to view details. A series of monitoring rules and parameters monitor your managed assets. Events and incidents are raised for resources that are not performing as expected.
-
Performance: Analytics: Provides a detailed view into operating system performance and resource usage.
-
Configuration: Indicates configuration changes to the operating system.
38.2 Location of Oracle Operating System Information in the UI
Oracle Solaris and Linux operating system information is located in the following locations in the user interface.
Table 38-1 Location of Operating System Information in the UI
| Object | Location |
|---|---|
|
All Oracle Solaris and Linux operating systems |
Select Hosts in the Targets selector. If the operating system parameter does not appear in the table, click View, click Columns, then select the Operating System parameter. To view the version, select Target Version. |
|
A specific Oracle Solaris or Linux operating system |
Select Hosts in the Targets selector. Click the host to display the Summary page. |
|
System resources for a specific Oracle Solaris or Linux operating system |
Select Hosts in the Targets selector. Click the host to display the Summary page. To view more details, click one of the following tabs on the right side of the Host page: CPU, Host Memory, Storage, Network Connectivity, Host Processes, or Host Services. |
|
Monitoring metrics and details, Program Resource Utilization, Metric and Collection Settings, Metric Collection Errors, Status History, Incident Manager, Alert History, and Blackouts and Brownouts. |
Select Hosts in the Targets selector. Click the host to display the Summary page. Click the Host drop down menu, then click Monitoring. |
38.3 Actions for Operating Systems
You can perform the following actions:
-
View the configuration and status of hosts
-
View host details
-
View the platform, physical or virtual, on which the operating system is deployed
-
View CPU and memory resource utilization and the top process utilization
-
Diagnose problems using incidents and performance metrics
38.4 About the Dashboard for all Hosts
The Hosts dashboard is a sortable table that contains details about the managed hosts, including incidents, the type of operating system, the operating system version, CPU and memory utilization. More than 40 host parameters are available. A few parameters are selected by default, others are hidden. You can change the parameters that appear in the dashboard and the order in which they appear.
38.4.1 Viewing the Dashboard of all Hosts
-
From the Targets menu, select Hosts.
The Hosts page displays all managed hosts, including operating system details. You can sort most of the columns in either ascending or descending order.
-
Click View, then Columns to view or edit the parameters to display in the dashboard.
-
To add or remove parameters, select or deselect the parameter in the View menu. For example, you might want to display the Incidents, Operating System, and Target Version.
Note:
The Oracle Solaris operating system might appear as SunOS in the user interface and the 11.0.0.0 release might appear as Target Version 5.11.0.0.0. -
(Optional) You can reorder the columns that appear on the dashboard. Click View, then Reorder Columns. Select a column and use the arrow button to move the selected item to a different position. Click OK to save the change.
38.5 How to Get Information About a Specific Host
The Summary displays details and metrics for the selected operating system:
-
Dashlets: A series of dashlets at the top of the page contains summary information and might be associated with a more detailed information that is in a tab.
-
Tabs: A series of tabs on the right side of the page link to more detailed information.
-
Host menu: Links to detailed information about the host, including performance and resource metrics, metric collection settings, status history, incidents, alert history, and blackout and brownouts.
38.5.1 Viewing the Host Target Summary
You can view a summary of managed operating system targets. The Summary includes the platform that the operating systems are deployed on, either on a physical or a virtual server, and incidents.
-
From the Targets menu, select Hosts.
The Hosts page appears with a list of all managed hosts. You can sort the list.
-
Click the host name from the list of managed hosts to display the Summary page for that host.
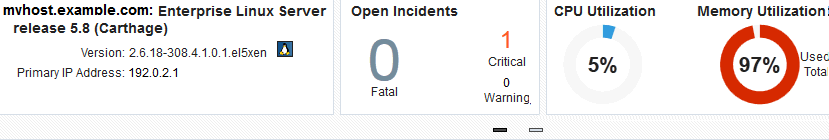
The Summary page contains a series of dashlets that provide useful information about the host and a summary of the host details and utilization.
38.5.2 About Dashlets for Hosts
The top of the host page contains a series of dashlets that provide a quick view of top statistics. Click the small button below the row of dashlets to toggle to the next series of dashlets.
The following dashlets are available:
-
Host details: Provides a short summary, including the host name, type of operating system, version and release, primary IP address, and the length of up time for the operating system.
-
Open Incidents: Shows the number of Fatal, Critical, and Warning incidents. Mouse over the number to see a small snapshot of the incident. Click a number or a summary link to navigate to the Incident Manager console for incident details.
-
CPU Utilization and Memory Utilization: Shows a graphical and number percentage for CPU and Memory utilization.
-
OS Services State: A pie chart shows the percentage of services that are running, stopped, no state, and other states.
-
Configuration changes: Shows the data and time of the last configuration change and last reported incident.
38.5.3 About Tabs for Hosts
The following tabs, represented with icons, appear on the right side of the page, click a tab to display more information:
-
Summary: The home page for Oracle Solaris and Linux operating system monitoring information. Displays dashlets with host details, incidents, CPU and memory, Services and configuration changes.
-
CPU: Displays performance and resource metrics. The following performance and process utilization graphs are available: CPU Utilization, CPU Threads Utilization (including Processor Group Threads Utilization for Oracle Solaris, and CPU Frequency State for Oracle Solaris on SPARC.)
-
Host Memory: View of an operating system's memory utilization, IPCS and swap details.
-
Storage: Links to detailed storage information, including the disks, filesystem, volume group and SAN configuration.
-
Network Connectivity: Shows the network interface and subnet for Oracle Solaris operating systems.
-
Boot Environments: Displays the available alternate boot environments and boot environment snapshots for Oracle Solaris operating systems.
-
Host Processes: View of an operating system's top CPU, memory utilization, and process resource usage.
-
Host Services: View the services that are managed by the operating system and the state of the services.
38.6 About the Host Menu
The Host menu contains links to detailed information about the host, including monitoring and configuration information.
The following information is available in the Host Monitoring menu:
-
CPU Details
-
Memory Details
-
Disk Details
-
Program Resource Utilization
-
All Metrics
-
Metric and Collection Settings
-
Metric Collection Errors
-
Status History
-
Incident Manager
-
Alert History
-
Blackouts and Brownouts
38.7 About Open Incidents
You can view all open incidents on the Hosts dashboard, or you can view open incidents for a specific host on the host's Summary page.
The Hosts Dashboard lists all managed hosts and displays open incidents. You can sort the columns, or click a number in a column to navigate directly to the Incident Manager page for details. Alternatively, you can click the host name to view more about the host and the incident from the host's Summary page. The Open Incident dashlet on the Hosts Summary page displays the number of Fatal, Critical, and Warning incidents.
38.7.1 Viewing Open Incidents
To view an open incident from the Host's Summary page:
-
From the Targets menu, select Hosts.
The Hosts page appears with a list of all managed hosts. You can sort the list.
-
Click the host name from the list of managed hosts to display the Summary page for that host.
-
Click the number to view a summary of the open incidents.
-
Click the summary text to navigate to the Incident Manager.
Figure 38-3 Open Incidents Summary Page for a Host
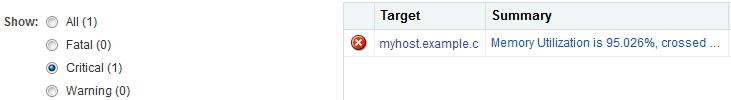
Description of ''Figure 38-3 Open Incidents Summary Page for a Host''
The Incident Manager provides incident details and the events that led to the incident. You can drill down to get details on the events and notifications. If you are online, a link will take you to My Oracle Support.
You can acknowledge the incident, add comments, or manage the incident from the Incident Manager page.
38.7.2 Identifying Changes in an OS Configuration
When an administrator changes a host configuration, it can be helpful to know when the configuration was last changed. This information appears in the configuration dashlet on the Summary page. Detailed configuration information is available, including the ability to compare.
-
Click Hosts from the Targets page.
-
Click the target name to open the home page.
-
Click Host in the upper left corner of the page. Click Configuration.
-
Click the option to view Last Collected, Comparison & Drift Management, Compare, Search, History, Save, Saved, or Topology.
38.8 Overview of Performance and Resource Metrics
Performance and resource metrics provide details on the kernel configuration and performance, helping you to identify issues. The CPU Load chart and Free Memory chart enable you to easily view the status. High level CPU and Memory usage are available in the dashlet with more details in the CPU and Host Memory tabs.
CPU data for the following metrics is collected every 15 minutes and appears in the CPU tab:
The following options are available for you to view kernel information:
-
Shared memory
-
CPU I/O wait and buffer cache read/write details
-
Physical I/O read/write, disk and disk block read/writes
-
Run queue length and paging activity
-
Tunable kernel parameters
Resource metrics provides details on the operating system, the available resources, and the load on the operating system or zone.
The following details are available:
-
Memory, total and available
-
Swap, total configured and available
-
CPU details, including the vendor name, number, frequency, revision and mask
-
Number of cores and threads per CPU
-
Bar chart showing the utilization percentage per CPU thread
-
The amount of time spent by all CPUs in different frequencies for Oracle Solaris
-
CPU and memory usage over time
38.8.1 About CPU Utilization
The CPU Utilization metric displays the percentage utilization of a CPU over time for Oracle Solaris and Linux targets. An abnormally high value indicates that the system is under heavy load. If the value is consistently high, consider reducing the load on the system.
CPU data is collected every 15 minutes. The default display is a graphical representation of the Run Queue Length with a red line for the 1 minute average, a green line for the 5 minute average, and a yellow line for the 15 minute average. To display the information in table format, click Table View.
38.8.2 Viewing CPU Metrics
To view the kernel and performance metrics for an operating system:
-
From the Targets menu, select Hosts.
The Hosts page appears with a list of all managed hosts. You can sort the list.
-
Click the host name from the list of managed hosts.
-
Click the CPU tab to view the metrics and charts.
The information appears in a graphical format. Click Table View to change the format. You can adjust the time frame to display historical data for the last two (2) hours, four (4) hours, 10 hours, one day, or one week. By default, CPU and System Load appear. Deselect to remove the information from the graphs.
38.8.3 About CPU Threads Utilization
The CPU Threads Utilization metric displays CPU thread diagnostics for Oracle Solaris and Linux targets in a graphical format, useful for analysis of multi-threaded CPUs. You can view the efficiency and the metrics for each CPU thread.
To help you to gauge the efficiency, the following charts are available:
-
Bar chart showing the number of CPU threads at each frequency
-
Historical charts showing the percentage of time spent at different frequencies
38.8.4 About Processor Group Utilization for Oracle Solaris 11
In addition to the CPU Utilization, you can view the following processor group utilization details for Oracle Solaris 11 operating systems:
-
List of processor groups and the number of threads per group
-
Bar chart of CPU utilization per processor group
-
Type of group, such as integer pipeline
38.9 About Host Memory
The Host Memory page provides you with a unified view of an operating system's memory utilization.
The page displays the following information:
-
Memory Utilization: Displays overall memory utilization. The default view is a graphical representation of the percentage of memory used over time. You can change the view to represent the MB of memory used over time. If you prefer, you can view the overall memory utilization in a table instead of a chart.
-
Virtual Memory: Displays overall virtual memory utilization. The default view is a graphical representation of the percentage of swap space used over time. You can change the view to represent the MB of memory used over time. If you prefer, you can view the overall virtual memory utilization in a table instead of a chart.
-
Page Activity: Displays a paging statistics activity in a color-coded graph format. The chart shows the following page activity: Address Translation Page Faults appear as a blue line, Pages Paged-in appear as a green line, Pages Paged-out appear as an orange line, and the Pages Scanned by Page Stealing Daemons appear as a red line. All activity is on a per second basis for a single day. If you prefer, you can view the data in a table instead of a chart.
-
Memory Details: A pie chart shows the memory details. The chart displays the Free Memory, Used Memory, and Other Shared Memory as a percentage of the entire memory.
-
Swap File: Displays the swap file and amount of space used. A graphical representation shows at a glance the amount of used and free swap space.
-
ZFS ARC cache usage: Displays ZFS ARC (Adaptive Replacement Cache) usage for Oracle Solaris operating systems.
38.9.1 Viewing Host Memory Utilization
To view host memory charts:
-
From the Targets menu, select Hosts.
The Hosts page appears with a list of all managed hosts. You can sort the list.
-
Click the host name from the list of managed hosts.
-
Click the Host Memory tab to view the metrics and charts.
In some cases, you can click Table View next to the chart to view the information in a table format.
-
To change the y-axis of the Memory Utilization and Virtual Memory Utilization charts to display as a percentage instead of in MB, select By Percentage. Select the time frame from the Time Range menu to change the default from two hours.
38.9.2 Viewing Memory and Swap File Details
To view details about memory and swap file:
-
From the Targets menu, select Hosts.
The Hosts page appears with a list of all managed hosts. You can sort the list.
-
Click the host name from the list of managed hosts.
-
Click the Host Memory tab, then click IPCS & Swap Details in the center pane.
38.10 Viewing Host Storage
Host Storage contains links to detailed storage information, including the disks, filesystems, volume group and SAN configuration. You can view all storage, or filter by volume name, or select to view only local or remote storage.
-
From the Targets menu, select Hosts.
The Hosts page appears with a list of all managed hosts. You can sort the list.
-
Click the host name from the list of managed hosts.
-
Click the Host Storage tab.
-
Select Local or Remote to view a subset of storage. Enter a name in the Volume Name field to filter your results.
-
Click the icon for the storage details you want to view. For example, for Linux the options are Disks, Filesystems, Linux LVM Volume Group(s), and SAN Configuration.
38.11 Viewing Network Connectivity
Network Connectivity shows the network interface and subnet to associate with the host.
You can view different layers of the network:
-
Network interface: View the network state, subnet and flag details for each network interface
-
Data link: View the data link state, and physical address, and the type of media, such as ethernet, for each data link.
-
From the Targets menu, select Hosts.
The Hosts page appears with a list of all managed hosts. You can sort the list.
-
Click the host name from the list of managed hosts.
-
Click the Network Connectivity tab.
-
Click the icon to display the Interfaces or Data links layer.
38.12 About Boot Environments
Oracle Solaris 11 Boot Environments use the beadm utility and ZFS file systems to create and manage boot environments. The Oracle Solaris 11 software automatically creates boot environments.
A boot environment is an instance of a bootable Oracle Solaris image plus additional software packages that are installed onto the image, and the set of all file systems and devices (disk slices and mount points) that are required to operate an Oracle Solaris OS instance. A system can have only one active boot environment, which is the booted environment. An alternate boot environment is an inactive environment that is not currently booted. A system can have many inactive boot environments.
A dual boot environment is often used to manage updates because it can significantly reduce the service outage time that is usually associated with patching. Maintaining multiple boot environments also enables quick and easy rollback to a version before the patches were applied, if needed.
The Boot Environment tab of the Oracle Solaris operating system page displays Oracle Solaris boot environment and file system details, including all available boot environments, the size, and the synchronization date. For a selected boot environment, you can view snapshot details, file system details, and any associated zone boot environments. This tab is only available for Oracle Solaris operating systems
The Boot Environment tab of the Oracle Solaris operating system page displays Oracle Solaris boot environment and file system details, including all available boot environments, the size, and the date the environment was created or synchronized. The Boot Environment tab is only available for Oracle Solaris operating systems
38.12.1 Viewing Oracle Solaris Boot Environments
-
From the Targets menu, select Hosts.
-
Select an Oracle Solaris operating system from the list of managed hosts.
-
Click the Boot Environments tab to view the boot environment snapshot and file system details. The file system details are at the bottom of the page, after the boot environments.
-
Expand the operating system to display snapshots of the boot environments.
38.13 Viewing Running Host Processes
The Host Processes page provides you with a unified view of an operating system's top processes, including the CPU and memory utilization of each process.
-
From the Targets menu, select Hosts.
The Hosts page appears with a list of all managed hosts. You can sort the list.
-
Click the host name from the list of managed hosts.
-
Click the Host Processes tab to view the processes.
38.14 Viewing Managed Host Services
With Host Services, you can see which services are managed by the operating system and the state of the services. This is useful when you want to quickly identify which services are in need of attention and the state of services that are important to you.
Host Services monitors and displays the services running on a host. You can view the current state of a service. However, you cannot create, delete, or modify the properties of a service. Fault Management Resource Identifier (FMRI) identifies each service on the system.
The following are the service states:
-
Running: The service is running.
-
Stopped. The service is either disabled or offline and the service is not running.
The Host Services page displays the service state, the number of spawned process identifiers, and the spawned process identifiers (PIDs).
-
Click Hosts from the Targets menu.
-
Click the host name from the list of managed hosts to display the Summary page for that host.
-
Click the Second dashlet series button below the dashlets to view a chart summarizing the current status of services.
-
Click the Host Services tab on the right side of the user interface to view details of the services.
-
The default view is to display stopped services. Click the radio button to change the view. For Oracle Solaris, the options are: Offline, Online, or All. For Linux, the options are: Stopped, Running, or All.
-
Click a number to view the spawned process identifiers (PIDs.)
38.15 Working with Host Metrics
More detailed host metrics are available from the Hosts menu, including the following:
38.15.1 Viewing CPU, Memory, and Disk Details for a Host
38.15.2 Viewing a Host's Program Resource Utilization
38.15.3 Viewing All Metrics
-
Click the target name to open the home page.
-
Click Host in the upper left corner of the page. Click Monitoring, then click All Metrics.
-
(Optional) To view by category instead of by metric, click View, then click By Metric Category.
-
Click a metric to view details, collection schedule, upload interval and other details.
38.16 Managing Metrics and Incident Notifications for Hosts
You can perform the following tasks to manage monitoring and incident notification:
38.16.1 Viewing Host Metric Collection Error
Metric collection errors are usually caused by installation or configuration issues.
-
Click Hosts from the Targets menu.
-
Click the target name to open the home page.
-
Click Host in the upper left corner of the page. Click Monitoring, then click Metric Collection Errors.
38.16.2 Editing Metric and Collection Settings for Hosts
The Metrics tab contains displays all of the monitored attributes. The default view is metrics with thresholds. For these types of monitored attributes, you can modify the comparison operator, the threshold limits, the corrective action, and the collection schedule.
-
Click Hosts from the Targets menu.
-
Click the target name to open the home page.
-
Click Host in the upper left corner of the page. Click Monitoring, then click Metric and Collection Settings.
-
Modify threshold limits or collection schedule. When a threshold field is empty, the alert is disabled for that metric.
-
Click the Edit icon for advanced settings.
Click the Other Collected Items tab to view non-threshold monitored attributes. You can modify the collection period for these attributes, or disable monitoring.
38.17 About Host Compliance
Host compliance provides you with details the compliance frameworks, standards, and the targets that are associated with the compliance standard selected in the Compliance Standard Library.
Cloud Control displays the evaluation results and level of compliance of a target against a compliance framework. The Compliance Frameworks evaluation results provides an overview of the state of the framework, the level of compliance (Critical, Warning, or Compliant.) and the criticality of any violations (Critical, Warning, or Minor Warning.) You can view the average score, as a percentage, and the Author.
When Compliance Framework errors are detected, the following information is available:
-
Root Compliance Standard
-
Root Lifecycle State
-
Parent Compliance Standard
-
Rule
-
Root Target Information
-
Target Information
-
Error Date
-
Error Message
38.17.1 Viewing Compliance Frameworks
The Compliance Framework tab displays the evaluation results and errors, if any.
-
Click Hosts from the Targets menu.
-
Click the target name to open the home page.
-
Click Host in the upper left corner of the page. Click Compliance, then click Results.
-
Click Compliance Frameworks to display the Evaluation Results tab.
-
Click the Errors tab to see if there are any Compliance Framework errors.
38.17.2 Viewing Compliance Standards
You can search for a specific compliance standard for a host and view the evaluation results and errors.
-
Click Hosts from the Targets menu.
-
Click the target name to open the home page.
-
Click Host in the upper left corner of the page. Click Compliance, then click Results.
-
Click Compliance Standards to display the Evaluation Results tab.
-
Click the Errors tab to see if there are any Compliance Framework errors.
38.17.3 Viewing Target Compliance
The Target Compliance table lists the targets that are associated with the compliance standard selected in the Compliance Standard Library.
-
Click Hosts from the Targets menu.
-
Click the target name to open the home page.
-
Click Host in the upper left corner of the page. Click Compliance, then click Results.
-
Click Target Compliance to display the targets that are in compliance with the standards.
38.18 Related Resources for Operating Systems
See the following for more information:
-
Discovering and Adding Host and Non-Host Targets for the concepts around discovering and adding targets.
-
Discovering, Promoting, and Adding System Infrastructure Targets for how to discover operating systems and other system infrastructure targets.
-
Managing Storage for more details about viewing a host's storage filesystems and viewing storage information.
-
View Network Details of an OS Asset for more information about the types of information that are available.
-
Using Incident Management for details on managing incidents.
Go to >http://docs.oracle.com/en/operating-systems/ for the following:
-
Oracle Solaris documentation
-
Oracle Linux documentation