39 Monitoring Oracle Solaris Zones
This chapter contains information about monitoring Oracle Solaris Zones.
The following topics are covered:
39.1 Get Started with Monitoring Oracle Solaris Zones
Oracle Solaris Zones, also known as Oracle Solaris Containers, are used to virtualize operating systems and provide an isolated and secure environment for running software applications. A zone is a virtualized operating system environment created within a single instance of the Oracle Solaris operating system.
Think of a zone as a box with flexible, software-defined walls. One or more applications can run in this box without interacting with the rest of the system. Because zones isolate software applications or services, applications that are running in the same instance of the Oracle Solaris OS are managed independently of each other. For example, you can run different versions of the same application in separate zones. Zones require a machine that is running at least an Oracle Solaris 10 operating system. Solaris 11 global zone and Solaris 10 update 11 global zones are supported.
The global zone is the default operating system and has control over all of the processes and has system-wide administrative control. The global zone oversees the CPU, memory, and network resource allocation of all of the non-global zones. A global zone always exists, even when no other zones are configured.
Non-global zones, or simply zones, are configured inside the global zone. Zones are isolated from the physical hardware by the virtual platform layer. A zone cannot detect the existence of other zones.
Kernel zones are zones that implement virtualization from within the global zone's operating system kernel. Each kernel zone has a separate kernel from the global zone, its own file systems and user space. Configuration of each zone (including the global zone) puts limits on the CPU, memory and I/O resources available to the zone. Kernel zones are supported beginning with Solaris 11.2. A kernel zone enables you to deploy a non-global zone with its own operating system kernel instance. The non-global zone has a different kernel version to the global zone. You can create one level of non-kernel zones inside kernel zones.
The following types of non-global zones are available with Oracle Solaris:
-
Native zone: A separate Solaris 10 or Solaris 11 instance with the same version of Solaris as the global zone. You cannot create nested zones.
-
Solaris 10 branded zone: An independent Solaris 10 instance running inside a Solaris 11 global zone, providing a migration path for existing Solaris 10 deployments. Nested non-global zones are not supported.
-
Kernel Zone: Runs a separate kernel version inside the non-global zone. A kernel zone is fully independent operating system instance, which enables you to create nested (non-kernel) zones within the kernel zone. Kernel zones are available beginning with the Oracle Solaris 11.2 release.
Zones are represented by an icon in the user interface. Different types of zones, such as global zone, kernel zone, and non-global zones, have different icons.
You can monitor the following Solaris 10 and Solaris 11 global zones and their non-global zones through the Enterprise Manager user interface.
-
Solaris 10 global zones running native Solaris 10 non-global zones
-
Solaris 11 global zones running branded Solaris 10 non-global zones
-
Solaris 11 global zones running native Solaris 11 non-global zones
-
Solaris 11 global zones running Solaris 11 kernel zones
Enterprise Manager supports the following types of virtualization:
-
Oracle Solaris Zones: operating system virtualization
-
Oracle VM Server for SPARC: hardware virtualization on a SPARC platform
You can view zones within any type of logical domain on a SPARC platform.
The hypervisor is responsible for managing one or more non-global zones. A non-global zone is represented as its operating system instance deployed on a virtual server which is given a subset of the CPU, memory and I/O resources which are available from the physical server, and/or some virtual resources (such as virtual disks or networks) which are backed by configured resources from the global zone. The global zone always exists and is the controlling zone for the non-global zones.
39.2 Location of Oracle Solaris Zone Information in the UI
You can select any target that is a child or a parent of the zone (virtual platform, host, or server) and the zone will appear in the Navigation pane of the target.
The Virtualization Platform is the container on which zones are running. A global zone and all associated zones appear in a Zone Virtualization Platform page. A global zone is represented by a virtual server as well. Each non-global zone (virtual server) and kernel zone has its own Virtual Server page that displays details specific to that zone.
The following options are available on the All Targets page:
-
Click Virtualization Platform to see the list of virtual platforms. You can click any virtual platform in this list to open the virtual platform's home page.
-
Click Virtual Server to see the list of virtual servers.You can click any virtual server in this list to open the virtual server's home page.
Table 39-1 Location of Zone Information in the UI
| Object | Location |
|---|---|
|
Virtualization Platform |
A Virtual Platform target home page is accessible from the All Targets page, or from any of its parent or child targets through the Target Navigation pane. Click the All Targets selector at the top of the page. In the Refine Search section, select Virtualization Platform. The target can be a host, a server, or a zone target running on this Virtual Platform. A Target Navigation pane is located in the top left corner of a parent or child home page. Click the Target Navigation pane to expand it and see the Virtual Platform in the Navigation pane. |
|
Zone-specific (virtual server) page |
A zone virtual server target home page is accessible from the Solaris Zone Virtualization Platform page or the All Targets page. Click the All Targets selector at the top of the page. In the Refine Search section, select Virtual Server. If you are on the Solaris Zone Virtualization Platform page, click a zone to navigate to the virtual server page for that zone. |
39.3 Actions for Zones
The virtualization platform is automatically promoted when you discover Solaris 11 or Solaris 10 update 11 host operating systems.
You can perform the following actions:
-
View the configuration and status of zones
-
View CPU and memory resource utilization and the distribution of the CPU and memory consumers
-
Diagnose problems using incidents and performance metrics
-
Disable and enable monitoring notifications and monitoring
39.4 Target Navigation for Zones
The target navigation tree helps you to navigate between targets that are in a Solaris Zones Virtual Platform. When all resources are discovered and monitored through agent deployment on the global zone, you can navigate from the server down to the zones.
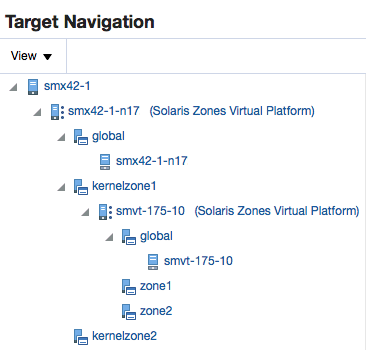
The top level, or node, of the target navigation tree is the physical server and the second node is the Oracle Solaris Zones Virtual Platform that is hosting the global zone. The global zone and all other types of zones appear under the Oracle Solaris Zones Virtual Platform. Expand the nodes to drill down the target hierarchy or click a specific target to open that target's landing page.
Figure 39-1 is an example of a target navigation tree that shows a global zone and two kernel zones. The first node is the physical server (smx42-1). The second node is the Solaris Zones Virtual Platform that is hosting the global zone and 2 kernel zones (kernelzone1 and kernelzone2.) The global zone is running the operating system (smx42-1-n17 host.) When the agent was deployed on kernelzone1, it triggered the discovery and promotion of the Solaris Zones Virtual Platform (smvt-175-10.) The Solaris Zones Virtual Platform in kernelzone1 is running a global zone and operating system (smvt-175-10 host) and 2 local zones (zone 1 and zone 2).
39.5 How to Get Information About a Zone
You can view information about the zone from a platform perspective, or for a specific zone. Zones appear in a Solaris Zone Virtualization Platform page and each global zone, kernel zone, and non-global zone has its own virtual server page.
The Solaris Zone Virtualization Platform page provides general information about the zone, such as open incidents, CPU usage, memory resources, number of running and configured zones, and a list of all zones for the global zone and their states.
The Virtualization Platform is the container on which zones run. Go to the Virtualization Platform page to see the list of zones (virtual servers) running on a virtual platform. Click a zone to see the zone's home page.
The Summary displays details and metrics for the selected zone:
-
Dashlets: A series of dashlets at the top of the page contains summary information and might be associated with a more detailed information that is in a tab.
-
Tabs: A series of tabs on the right side of the page link to more detailed information, including CPU and memory performance.
The top of the page contains a series of dashlets that provide a quick view of top statistics. Click the small button below the row of dashlets to toggle to the next series of dashlets. Click the icon below the toggle icons to minimize the dashlets.
The Virtualization Platform dashlets provide the following types of information:
-
Platform status
-
Time that the zone platform has been up and running
-
Open incidents
-
Guest configurations
-
Distribution of the CPU and memory consumers per zone
-
Date and time of last configuration changes and incidents
See Working with Zone Platform Metrics for more details.
The Virtual Server dashlets provide the following types of information about a specific zone:
-
Zone status
-
CPU and memory utilization
-
Guest configurations
-
Date and time of last configuration changes and incidents
See Working with Zone-Specific Metrics for more details.
39.6 Working with Zone Platform Metrics
Virtualization Server platform metrics enable you to monitor the performance and resource usage of the virtualization server in your data center. You can use this information to balance resources or plan ahead to add resources to improve future performance.
The distribution of CPU and memory consumers is useful in managing the most heavily loaded zones, enabling you to be proactive in identifying potential issues. The last dashlet on the Summary page shows the date and time stamp for the last configuration change and the last incident.
The following zone metrics are available in the dashlets across the top of the page:
-
Platform Status
-
Oracle Solaris version.
-
Current state: View the current health status and the time that the zone has been up and running.
-
Open Incidents: View the number of Fatal, Critical, and Warning incidents. Click a number to view a synopsis. Click the synopsis to navigate to the Incident Manager console for incident details.
-
CPU Usage: View the percentage of CPU used by the platform.
-
Memory Usage.
-
Guest count. The guest count shows the total number of zones. If zones are still in the process of being discovered and promoted, the guest count will indicate the total number of guests and the number of guests that are still in the queue for auto promotion.
-
-
Guest Configurations
-
Number of zones: View the number of running zones and the number of configured zones.
-
Virtual CPUs: View the number of virtual CPUs. Hover over the pie chart to view the number of dedicated and shared CPUs.
-
-
Distribution of the CPU and memory consumers per zone:
-
CPU Consumption: View the total CPU consumption and the number of zones, or guests, that are consuming CPUs in the following ranges: 0-20, 20-40, 40-60, 60-80, and 80-100 percent.
-
Memory Consumption: View the total memory consumption and the number of zones, or guests, that are consuming memory in the following ranges: 0-20, 20-40, 40-60, 60-80, and 80-100 percent.
-
-
Last changes
-
Configuration change: View the date and time stamp for the last change in configuration.
-
Incident: View the date and time stamp for the last incident.
-
The main body of the page contains details about the virtualization platform. The Virtual Platform's Guests contains a list of the zones and zone details (zone name, type of zone, the CPU usage over the past 5 hours, and incidents). You can display the page as a list or a table. The default view is the List view, sorted by Incident count. The List view has sorting and filtering options that enable you to sort by the type of zone, the zone name, or the allocated resources. Alternatively, you can view the Virtual Platform's Guests page as a sortable table. You can sort by the Name, Type, Availability Status, State, or Memory columns. You can also sort by the Fatal, Critical, or Warning incident columns.
39.6.1 Viewing Zone Platform Metrics
Some metrics appear in the dashlets, for details on specific zone metrics, view the Summary page.
-
From the Targets list, select All Targets.
-
From Servers, Storage, and Network, select Virtualization Platform.
-
Click the target name to open the Summary page for the Solaris Virtualization platform.
-
The dashlets display the metric information. The Summary page shows details for each zone. Details include the zone name, type of zone (global, non-global, kernel), the status, the number of vCPUs, memory, and the incidents.
-
The main body of the page contains details about the virtualization platform's guests, or zones.
39.7 Working with Zone-Specific Metrics
Virtual Server metrics enable you to monitor the performance and resource usage of a specific zone.
The Virtualization Platform shows the distribution of the CPU and memory consumers per zone. The Virtual Server shows the load imposed by a single zone (global, non-global, or kernel.) The last dashlet on the Virtual Server Summary page shows the date and time stamp for the last configuration change and the last incident.
The following metrics are available in the dashlets across the top of the page:
-
Virtual Server Status
-
Current state: View the current health status and the type of zone (global, non-global, or kernel.)
-
Open Incidents: View the number of Fatal, Critical, and Warning incidents. Click a number to view a synopsis. Click the synopsis to navigate to the Incident Manager console for incident details.
-
-
CPU and Memory Utilization
-
CPU Usage: View the percentage CPU used by the virtual server.
-
Memory Usage: View the percentage of memory used by the virtual server.
-
-
Virtual Server Configuration
-
Guest OS Information: View the host name, IP address, and time that the guest (zone) has been up and running. To receive guest OS information, you must have an agent deployed on the zone's operating system.
-
Guest Configuration: View the guest UUID, host ID, and whether automatic boot is enabled.
-
-
Last Changes
-
Configuration change: View the date and time stamp for the last change in configuration.
-
Incident: View the date and time stamp for the last incident.
-
The main body of the page contains details about the virtual server, including the operational status, the type of virtual server (global, non-global, or kernel zone), the number of shares or dedicated CPUs, and the amount capped memory (if defined) or the amount of uncapped memory shared by all zones. The page also contains two graphs that show the CPU usage profile and the Memory usage profile. Each graph has historical data for the past seven (7) days and 24 hours. More detailed CPU and Memory graphs appear in the Virtual Server Usages tab.
39.7.1 Viewing a Summary of Zone Metrics
Zone-specific metrics and resource usage charts appear on the zone's virtual platform Summary page.
-
Select All Targets from the Targets list.
-
Under the Servers, Storage, and Network heading, click Systems Infrastructure Virtualization Platform. The Virtualization Platform provides the ability to drill down to see the virtual server that has the open incident.
-
Click the target name to open the Summary page for the Solaris Virtualization Platform.
39.7.2 Viewing Zone CPU and Memory Metrics
Zone-specific CPU and memory usage metrics and resource usage charts appear on the zone's virtual server page. More detailed metrics are available in the All Metrics page.
-
Click Systems Infrastructure Virtual Server from the All Targets page.
-
Click the target name to open the Summary page for the virtual server. The CPU and Memory metrics appear on the zone's home page and in the home page dashboard. The usage profiles appear for the next 7 days plus 24 hours and the last 5 hours.
-
Click the Virtual server usages icon on the right side of the page to view CPU and Memory Resource Usages Charts. Move the slider icon on the chart page to change the number of days to display in the chart. You can view up to seven days.
39.8 Viewing All Metrics
Platform and virtual server metrics are available in the All Metrics page.
-
Click Systems Infrastructure Virtual Server from the All Targets page.
-
Click the target name to open the Solaris Virtualization Platform or Virtual Server page, depending on your target.
-
Click Solaris Virtualization Platform or Virtual Server in the upper left corner of the page. Click Monitoring, then click All Metrics.Click a metric to view details, collection schedule, upload interval and other details.
Note:
Although it appears in the list of configuration metrics, the Component Faults metric is not supported for a Virtual Server.The
CoreUsagemetric is only reported for guest domains that have full cores allocated.
39.9 Working with Incidents for Zones
The following information will help when working with incident information for zones:
39.9.1 About Incidents for Zones
The Virtualization Platform page shows all incidents that are open on the virtualization platform, enabling you to quickly see if there are any issues on the platform.
For zones, the number of incidents that appear on the Virtualization Platform page includes incidents for the global zone and any zones associated with the global zone. Click the number in the Open Incidents dashlet to display the list of incidents and the target on which the incident occurred.
In the list of incidents, you can click the target (global zone or zone) link to go to the corresponding target home page or you can click the incident to be redirected to the corresponding target Incident Manager page.
Note:
The number of open incidents on the Virtualization Platform page indicates all open incidents for the platform - for the global zone and all zones. By default, the Incident Manager page for the global zone shows the open incidents for the global zone, not the associated zones. You can change the display in the Incident Manager to show incidents for the global zone and zones. In Incident Manager, select Search, then select Target and all members for the Include Members search criteria.39.9.2 Viewing Open Incidents for Zones
The Virtualization Platform and Virtual Server pages have an Open Incident dashlet, which displays the number of Fatal, Critical, and Warning incidents. The Virtualization Platform page shows open incidents for the global zone and all associated zones (non-global and kernel.) The Virtual Server page only shows incidents for the selected zone.
-
Select All Targets from the Targets list.
-
Under the Servers, Storage, and Network heading, click Systems Infrastructure Virtual Server or Systems Infrastructure Virtualization Platform. The Virtualization Platform does provide the ability to drill down to see the virtual server that has the open incident.
-
Click the target name to open the Summary page for the Solaris Virtualization Platform.
-
The Open Incidents dashlet displays a number to indicate how many open incidents are associated with the global zone and non-global zones.
When a zone has an open incident, a number appears by the zone name in the Virtual Platform's Guests section of the Summary pane.
-
Click the target name in the Open Incident dashlet to go to the Virtual Server page for the zone.
-
Click the summary text to navigate to the Incident Manager page.
The Incident Manager provides incident details and the events that led to the incident. You can drill down to get details on the events and notifications.You can acknowledge the incident, add comments, or manage the incident from the Incident Manager page.
Note:
The Virtualization Platform page shows all incidents for the global zone and its zones. By default, the Incident Manager page only displays incidents for the global zone. You can change the setting in Incident Manager to display the target and all members.
39.10 Managing Metrics and Incident Notifications for Zones
You can perform the following tasks to manage monitoring and incident notification:
39.10.1 Viewing Zone Metric Collection Errors
Metric collection errors are usually caused by installation or configuration issues. You can view errors for a virtual server or for the virtualization platform.
-
Click Systems Infrastructure Virtual Server or Systems Infrastructure Virtualization Platform from the All Targets page.
-
Click the target name to open the home page.
-
Click Virtual Server or Virtualization Platform in the upper left corner of the page. Click Monitoring, then click Metric Collection Errors.
39.10.2 Editing Metric and Collection Settings for Zones
The Metrics tab contains displays all of the monitored attributes. The default view is metrics with thresholds. For these types of monitored attributes, you can modify the comparison operator, the threshold limits, the corrective action, and the collection schedule.
To edit the metrics and settings for a zone, navigate to the Virtual Server. To edit the settings for a virtualization platform, navigate to the Virtualization Platform. The parameters are different for each.
-
Click Systems Infrastructure Virtual Server or Systems Infrastructure Virtualization Platform from the All Targets page.
-
Click the target name to open the home page.
-
Click Virtual Server in the upper left corner of the page. Click Monitoring, then click Metric and Collection Settings.
-
Modify threshold limits or collection schedule. When a threshold field is empty, the alert is disabled for that metric.
-
Click the Edit icon for advanced settings.
Click the Other Collected Items tab to view non-threshold monitored attributes. You can modify the collection period for these attributes, or disable monitoring.
39.10.3 Editing a Zone's Monitoring Configuration
-
Click Systems Infrastructure Virtual Server or Systems Infrastructure Virtualization Platform from the All Targets page.
-
Click the target name to open the home page.
-
Click Virtual Server or Virtualization Platform in the upper left corner of the page. Click Target Setup.
-
Click Monitoring Configuration.
39.10.4 Suspending Monitoring Notifications for Zones
Brownouts enable you to temporarily suppress notifications on a target. The Agent continues to monitor the target under brownout. You can view the actual target status along with an indication that the target is currently under brownout.
You can create a brownout for a virtual server or for the virtualization platform.
-
Click Systems Infrastructure Virtual Server or Systems Infrastructure Virtualization Platform from the All Targets page.
-
Click the target name to open the home page.
-
Click Virtual Server or Virtualization Platform in the upper left corner of the page. Click Control.
-
Click Create Brownout.
-
Enter a name for the brownout event.
-
Select a reason from the menu and add comments, as needed.
-
Click the options to define how jobs will run and the maintenance window.
-
Click Submit.
39.10.5 Suspending Zone Monitoring for Maintenance
Blackouts enable you to suspend monitoring on one or more targets in order to perform maintenance operations. To place a target under blackout, you must have at least the Blackout Target privilege on the target. If you select a host, then by default all the targets on that host are included in the blackout. Similarly, if you select a target that has members, then by default all the members are included in the blackout.
You can create a blackout for a virtual server or for the virtualization platform.
-
Click Systems Infrastructure Virtual Server or Systems Infrastructure Virtualization Platform from the All Targets page.
-
Click the target name to open the home page.
-
Click Virtual Server or Virtualization Platform in the upper left corner of the page. Click Control.
-
Click Create Blackout.
-
Select a reason from the menu.
-
Add comments, as needed.
-
Click Submit.
39.10.6 Ending a Monitoring Brownout or Blackout for Zones
You can end a blackout or brownout for a virtual server or for the virtualization platform.
-
Click Systems Infrastructure Virtual Server or Systems Infrastructure Virtualization Platform from the All Targets page.
-
Click the target name to open the home page.
-
Click Virtual Server or Virtualization Platform in the upper left corner of the page. Click Control.
-
Click End Blackout or End Brownout.
39.11 Administering Zones
You can perform the following tasks to manage and administer zones:
39.11.1 Viewing Zone Compliance
The Compliance pages enable you to view the compliance framework, standards, and the zone's compliance.
You can view compliance for a virtual server or for the virtualization platform.
-
Click Systems Infrastructure Virtual Server or Systems Infrastructure Virtualization Platform from the All Targets page.
-
Click the target name to open the home page.
-
Click Virtual Server or Virtualization Platform in the upper left corner of the page. Click Compliance.
-
Click the option to view Results, Standard Associations, or Real-time Observations.
39.11.2 Identifying Changes in a Zone Configuration
When an administrator changes a zone configuration, it can be helpful to know the when the configuration was last changed. This information appears in the configuration dashlet on the Summary page. The zone configuration information does not require an agent to be installed on the zone.
To view more detailed information for a virtual server or virtualization platform:
-
Click Systems Infrastructure Virtual Server or Systems Infrastructure Virtualization Platform from the All Targets page.
-
Click the target name to open the home page.
-
Click Virtual Server or Virtualization Platform in the upper left corner of the page. Click Configuration.
-
Click the option to view Last Collected, Comparison and Drift Management, Compare, Search, History, Save, Saved, or Topology.
39.11.3 Editing Zone Administrator Access
39.11.4 Adding a Zone to a Group
39.11.5 Editing Zone Properties
39.12 Additional Resources for Oracle Solaris Zones
See the following for more information:
For in-depth information about Oracle Solaris and Oracle Solaris Zones, go to >http://docs.oracle.com/en/operating-systems/.