40 Monitoring Oracle VM Server for SPARC
The following features and topics are covered in this chapter:
-
Getting Started With Oracle VM Server for SPARC Virtualization
-
Location of Oracle VM Server for SPARC Information in the UI
-
Viewing all Oracle VM Server for SPARC Virtualization Platforms
40.1 Getting Started With Oracle VM Server for SPARC Virtualization
Oracle VM Server for SPARC technology enables server virtualization on SPARC platforms. You can create and manage multiple virtual machine instances simultaneously on a single SPARC machine. Each virtual machine, or guest, can run a separate Oracle Solaris 10 or Oracle Solaris 11 operating system.
Oracle VM Server for SPARC technology is virtualization of SPARC servers. This technology is part of a suite of methodologies for consolidation and resource management for SPARC Chip Multi Threading (CMT) systems. Using this technology, you can allocate the various resources of the system such as memory, CPU threads, and devices, into logical groupings and create multiple discrete systems. These discrete systems have their own operating system, resources, and identity within a single system. By careful architecture, an Oracle VM Server for SPARC environment can help you achieve greater resource usage, better scaling, and increased security and isolation.
40.1.1 Terminology
In Oracle Enterprise Manager, a virtualization platform is a virtualization technology, such as an Oracle VM Server for SPARC control domain, that can host guests. A virtual server is a guest, such as a logical domain.
40.1.2 Logical Domains
When Oracle VM Server for SPARC software is installed, a domain called the control domain is created. From this control domain, you create virtual machines called logical domains that each run an independent OS. A logical domain is a virtual machine with resources, such as CPU threads, memory, I/O devices, and its own operating system. The control domain manages the logical domains. Each logical domain can be created, destroyed, reconfigured, and rebooted independently of other logical domains.
40.2 Location of Oracle VM Server for SPARC Information in the UI
You can select any target that is a child or a parent of the logical domain (virtual platform, host, or server) and the logical domain will appear in the Navigation pane of the target.
The Virtualization Platform is the container on which logical domain virtual servers or zones are running.
The following options are available on the All Targets page:
-
Click Systems Infrastructure Virtualization Platform to see the list of virtual platforms. You can click any virtual platform in this list to open the virtual platform's home page.
-
Click Systems Infrastructure Virtual Server to see the list of virtual servers.You can click any virtual server in this list to open the virtual server's home page.
Table 40-1 Location of Oracle VM Server for SPARC Information in the UI
| Object | Location |
|---|---|
|
Virtualization Platform |
A Virtual Platform target home page is accessible from the All Targets page, or from any of its parent or child targets through the Target Navigation pane. Click the All Targets selector at the top of the page. In the Refine Search section, select Systems Infrastructure Virtualization Platform. Alternatively, select any target that is a parent or a child of the Virtual Platform in the All Targets selector. The target can be a host, a server, or a logical domain target running on this Virtual Platform. A Target Navigation pane is located in the top left corner of a parent or child home page. Click the Target Navigation pane to expand it and see the Virtual Platform in the Navigation pane. |
|
Virtual Server |
A logical domain virtual server target home page is accessible from the zone Virtualization Platform page or the Virtual Server page. Click the All Targets selector at the top of the page. In the Refine Search section, select Systems Infrastructure Virtual Server. If you are on the Virtualization Platform page, click a zone to navigate to the virtual server page for that zone. |
40.3 Actions for Oracle VM Server for SPARC
You can discover and promote Oracle VM Servers for SPARC by discovering the ILOM of the hardware, then deploying an EM Agent on the Control Domain operating system. You can then monitor the Oracle VM Server for SPARC and its guests. If the Control Domain or its guests have Oracle Solaris Zones installed, they are displayed in the target navigation tree, and you can monitor them if an EM Agent is installed in the guest domain.
You can perform the following actions:
-
View the configuration and status of domains.
-
View resource utilization and the top consumers of resources.
-
Diagnose problems using incidents and performance metrics.
40.4 Target Navigation for Oracle VM Server for SPARC
The target navigation tree helps you to navigate between targets that are in an Oracle VM Server for SPARC Virtual Platform (OVM SPARC Virtual Platform.) When all resources are discovered and monitored through agent deployment on the primary domain, you can navigate from the server down.
The top level, or node, is the physical server and the second node is the OVM SPARC Virtual Platform that is hosting the primary domain and all other logical domains. Expand the nodes to drill down the target hierarchy or click a specific target to open that target's landing page.
Figure 40-1 is an example of a target navigation tree for an OVM SPARC Virtual Platform. The first node is the physical server (slci04-node4-ilom), which is running the Oracle VM Server for SPARC hypervisor (slci04dbadm07 (OVM SPARC Virtual Platform)). The hypervisor appears on the second node. The third node displays four logical domain guests: primary, ssccn4-app1, ssccn4-app2, and ssccn4-app3. The primary domain is also a Solaris Zones Virtual Platform (slci04dbadm07 (Solaris Zones Virtual Platform)) and that has one global zone that is running the operating system (slci04dbadm07 host.) The fourth logical domain (ssccn4-app3) is expanded. When an agent was deployed on the logical domain, the domain was promoted as a zone virtual platform that is running the global zone and host slci04dbadm08.
Figure 40-1 Target Navigation for Oracle VM Server for SPARC
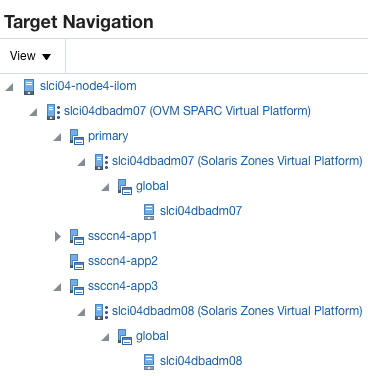
Description of ''Figure 40-1 Target Navigation for Oracle VM Server for SPARC''
40.5 Supported Versions
Oracle VM Server for SPARC Control Domain:
-
Oracle Solaris 11.1 and later
-
Oracle VM Server for SPARC 3.1 and later
Oracle VM Server for SPARC Guest Domain Operating System:
-
Oracle Solaris 10 1/13
-
Oracle Solaris 11.1 and later
40.6 Viewing all Oracle VM Server for SPARC Virtualization Platforms
You can view all virtualization platforms, including all Oracle VM Server for SPARC virtualization platforms, from the targets list.
-
Select All Targets from the Targets list.
-
Under the Servers, Storage, and Network heading, select Systems Infrastructure Virtualization Platform.
A list of the target virtualization platforms is displayed.
40.7 About Virtualization Platform Information
You can select a virtualization platform to view information about the virtualization platform and its guests.
The top section of the UI displays basic information about the selected virtualization platform. You can click the scroll icons to move left or right.
-
Platform: This section displays the platform type, its version, and its uptime.
-
Open Incidents: This section displays the number of fatal, critical, and warning incidents on the system. You can click on a category to bring up a detailed list of incidents within that category.
Note:
The number of open incidents on the Virtualization Platform page indicates all open incidents for the platform - for the control domain and all logical domains. By default, the Incident Manager page for the control domain shows the open incidents for the control domain, not the associated logical domains. You can change the display in the Incident Manager to show incidents for the control domain and logical domains. In Incident Manager, select Search, then select Target and all members for the Include Members search criteria. -
CPU and Memory: This section displays circular gauges showing the current CPU and memory as a percentage of the maximum values. This information is displayed only if the ILOM of the hardware has been discovered.
-
Up and Running Guests: This section displays the number of running guests out of the number of configured guests.
-
Virtual CPUs, Memory, and Cores: This section displays pie charts showing the current number of allocated and available virtual CPUs, amount of allocated and available memory, and number of allocated and available cores.
-
Total CPU Consumption and its Distribution per Guest: This section shows the total CPU consumption and a graph of the guest count for each cpu range.
-
Total Memory Consumption and its Distribution per Guest: This section shows the total memory consumption for the virtualization platform and a graph of the guest count for each memory range.
-
Total Power Consumption and its Distribution per Guest: This section shows the total power consumption and a graph of the guest count for each power range.
-
Last Configuration Change and Incident: This section shows the date of the last configuration change on the system, and the date of the last reported incident.
40.7.1 Viewing the Virtualization Platform Basic Information
-
Select All Targets from the Targets list.
-
Under the Servers, Storage, and Network heading, select Systems Infrastructure Virtualization Platform.
A list of the target virtualization platforms is displayed.
-
Click the target name to open the Summary page for the virtualization platform. The dashlets appear on the top of the page and provide the summary information.
40.7.2 About the Virtualization Platform's Guest Summary
The Guest Summary section displays details about the guests that are managed by the virtualization platform. Select the Summary tab to view this information.
The top section displays pie charts showing the virtual CPUs and memory configured for each guest, as a portion of the total available.
The bottom section displays a table, or list, of the guests. You can select list or table for the guest display. In list mode, use the sort options in the upper left to sort the guests by name, type, incidents, memory, or vCPUs.
By default, the domains are displayed in descending order based on the number of incidents.
For each guest, the following information is displayed:
-
Target Status Icon: This icon indicates whether the guest is monitored.
-
Type Icons: These icons identify the type of guest. Separate icons identify control domains, guest domains, root domains, IO domains, and service domains.
-
Name: The guest's name.
-
Cores: Displays the number of cores allocated to the guest.
-
Memory: Displays the memory available to the guest.
-
Operational Status Icon: This icon indicates whether the guest is unbound, started, or stopped.
-
Incidents: The numbers of open fatal, critical, and warning incidents for the guest.
-
CPU Information: Displays the number of CPU cores and vCPUs allocated to the guest.
-
CPU Usage Graph: Displays the current CPU usage and the CPU usage over the past five hours. This information is displayed only if the guest is started, and is only displayed in list mode.
You can use the search field at the top of the guest table to search for specific guests.
40.7.3 Viewing the Virtualization Platform Guest Summary
-
Select All Targets from the Targets list.
-
Under the Servers, Storage, and Network heading, select Systems Infrastructure Virtualization Platform.
A list of the target virtualization platforms is displayed.
-
Click the target name to open the Summary page for the virtualization platform.
-
Click the Summary tab.
40.7.4 About the Virtualization Platform's Services
You can view details about the I/O and network services available on the virtualization platform, and view the topology of a virtualization platform, showing what services are provided and consumed. Select the Services tab to view this information.
The top section displays a table of I/O and network services. For each resource, the following information is displayed:
-
Name
-
Type
-
Operational Status Icon
-
Number of guests using the resource
You can use the search field at the top of the table to search for specific services.
For each resource, you can click More to display additional information.
The bottom section displays a topology diagram, which shows each guest and the network resources provided or consumed by each guest. You can select the only guests option to display only the guests.
In the guests and services display, you can hover over a guest to highlight the network services it is using, or hover over a network resource to highlight the guests using it.
In the only guests display, you can hover over a guest to show the network resources it shares with other guests.
Click the Control Panel button to access zoom controls. You can use these controls to zoom in, zoom out, or zoom to fit the current window.
40.7.5 Viewing the Virtualization Platform Services
-
Select All Targets from the Targets list.
-
Under the Servers, Storage, and Network heading, select Systems Infrastructure Virtualization Platform.
A list of the target virtualization platforms is displayed.
-
Click the target name to open the Summary page for the virtualization platform.
-
Click the Services tab.
40.7.6 About the Virtualization Platform's vCPU and Core Allocation
You can view details about vCPU and core allocation. Select the Core Distribution tab to view this information.
This section displays a pie chart, showing which CPUs and cores are allocated to which guests, and which are unallocated. You can click on a guest in the outer layer to view detailed information about that guest's resource consumption. The following fields are displayed:
-
Name: The guest's user-friendly name.
-
Type Icons: These icons identify the type of guest. Separate icons identify control domains, guest domains, root domains, IO domains, and service domains.
-
Operational Status Icon
-
Number of vCPUs: The number of virtual CPUs assigned to the guest.
-
CPU Usage: Displays the guest's CPU usage over the past seven days.
40.7.7 Viewing the Virtualization Platform vCPU and Core Allocation
-
Select All Targets from the Targets list.
-
Under the Servers, Storage, and Network heading, select Systems Infrastructure Virtualization Platform.
A list of the target virtualization platforms is displayed.
-
Click the target name to open the Summary page for the virtualization platform.
-
Click the Core Distribution tab.
40.7.8 About Virtualization Platform Metrics
You can view a complete list of the metrics for a selected virtualization platform.
40.7.9 Viewing Platform Metrics
-
Select All Targets from the Targets list.
-
Under the Servers, Storage, and Network heading, select Systems Infrastructure Virtualization Platform.
A list of the target virtualization platforms is displayed.
-
Click the target name to open the Summary page for the virtualization platform.
-
Click Virtualization Platform in the upper left corner of the page. Click Monitoring, then click All Metrics.
-
Click a metric to view details, collection schedule, upload interval and other details.
40.8 Zones within a Logical Domain
You can discover and monitor zones installed on the operating system of a logical domain, including the control domain, if you have installed an EM Agent on the logical domain operating system.
40.9 About Logical Domain Information
Oracle Enterprise Manager collects detailed information about monitored logical domains, including CPU and memory usage, logical domain status, and incidents. You can view these metrics by selecting a logical domain.
The top section of the UI displays basic information about the selected logical domain. You can click the scroll icons to move left or right.
The following sections are displayed:
-
Logical Domain: This section displays the logical domain name, its types, and its uptime.
-
Open Incidents: This section displays the number of fatal, critical, and warning incidents on the system. You can click on a category to bring up a detailed list of incidents within that category.
-
CPU and Power: This section displays a circular gauge showing the current CPU usage as a percentage of the maximum value and the current power usage in Watts.
-
Guest OS Information: This section displays information about the guest's operating system, if it has been discovered. This information includes the hostname, IP address, and uptime.
-
Guest Configuration: This section shows guest configuration information, including the guest UUID, an icon indicating whether the guest is set to boot automatically, and the console port.
-
Last Configuration Change and Incident: This section shows the date of the last configuration change on the system, and the date of the last reported incident.
40.9.1 Viewing the Logical Domain's Basic Information
-
Select All Targets from the Targets list.
-
Under the Servers, Storage, and Network heading, select Systems Infrastructure Virtual Server.
A list of the target virtual servers is displayed.
-
Click the target name to open the Summary page for the virtual server.
40.9.2 About the Virtual Server Summary Information
The virtual server summary tab displays basic information about the virtual server, including status, virtual CPU, and memory usage.
The following fields are displayed:
-
Number of vCPUS or Cores
-
Amount of Power
-
Amount of Memory
-
Automatic Boot Configuration
-
UUID
-
Graphs of the historical CPU usage percentage over the past 7 days, 24 hours, and 5 hours
-
Graphs of the historical Power usage in Watts over the past 7 days, 24 hours, and 5 hours
40.9.3 Viewing the Virtual Server Summary Information
-
Select All Targets from the Targets list.
-
Under the Servers, Storage, and Network heading, select Systems Infrastructure Virtual Server.
A list of the target virtual servers is displayed.
-
Click the target name to open the Summary page for the virtual server.
-
Click the Summary tab.
40.9.4 About the Virtual Server Power and CPU Usage Charts
The Virtual Server Usages tab displays charts of the guest's CPU and power usage. Select one of the following icons to display the relevant chart:
-
CPU (%): Displays a chart of the virtual server's CPU usage, as a percentage of the total.
-
Power (Watts): Displays a chart of the power in Watts consumed by the CPU and by the memory.
For each chart, you can select a number of days to display using the slider in the upper right.
40.9.5 Viewing the Virtual Server Power and CPU Usage Charts
-
Select All Targets from the Targets list.
-
Under the Servers, Storage, and Network heading, select Systems Infrastructure Virtual Server.
A list of the target virtual servers is displayed.
-
Click the target name to open the Summary page for the virtual server.
-
Click the Virtual Server Usages tab.
40.10 Managing Metrics and Incident Notifications
You can perform the following tasks to manage monitoring and incident notification:
40.10.1 Viewing Metric Collection Errors
Metric collection errors are usually caused by installation or configuration issues. You can view errors for a virtual server or for the virtualization platform.
-
Click Systems Infrastructure Virtual Server or Systems Infrastructure Virtualization Platform from the All Targets page.
-
Click the target name to open the home page.
-
Click Virtual Server or Virtualization Platform in the upper left corner of the page. Click Monitoring, then click Metric Collection Errors.
40.10.2 Editing Metric and Collection Settings
The Metrics tab contains displays all of the monitored attributes. The default view is metrics with thresholds. For these types of monitored attributes, you can modify the comparison operator, the threshold limits, the corrective action, and the collection schedule.
To edit the metrics and settings for a virtual server, navigate to the Virtual Server. To edit the settings for a virtualization platform, navigate to the Virtualization Platform. The parameters are different for each.
-
Click Systems Infrastructure Virtual Server or Systems Infrastructure Virtualization Platform from the All Targets page.
-
Click the target name to open the home page.
-
Click Virtual Server or Virtualization Platform in the upper left corner of the page. Click Monitoring, then click Metric and Collection Settings.
-
Modify threshold limits or collection schedule. When a threshold field is empty, the alert is disabled for that metric.
-
Click the Edit icon for advanced settings.
Click the Other Collected Items tab to view non-threshold monitored attributes. You can modify the collection period for these attributes, or disable monitoring.
-
Click OK to save your changes.
40.10.3 Editing a Monitoring Configuration
-
Click Systems Infrastructure Virtual Server or Systems Infrastructure Virtualization Platform from the All Targets page.
-
Click the target name to open the home page.
-
Click Virtual Server or Virtualization Platform in the upper left corner of the page. Click Target Setup.
-
Click Monitoring Configuration.
40.10.4 Suspending Monitoring Notifications
Brownouts enable you to temporarily suppress notifications on a target. The Agent continues to monitor the target under brownout. You can view the actual target status along with an indication that the target is currently under brownout.
You can create a brownout for a virtual server or for the virtualization platform.
-
Click Systems Infrastructure Virtual Server or Systems Infrastructure Virtualization Platform from the All Targets page.
-
Click the target name to open the home page.
-
Click Virtual Server or Virtualization Platform in the upper left corner of the page. Click Control.
-
Click Create Brownout.
-
Enter a name for the brownout event.
-
Select a reason from the menu and add comments, as needed.
-
Click the options to define how jobs will run and the maintenance window.
-
Click Submit.
40.10.5 Suspending Monitoring for Maintenance
Blackouts enable you to suspend monitoring on one or more targets in order to perform maintenance operations. To place a target under blackout, you must have at least the Blackout Target privilege on the target. If you select a host, then by default all the targets on that host are included in the blackout. Similarly, if you select a target that has members, then by default all the members are included in the blackout.
You can create a blackout for a virtual server or for the virtualization platform.
-
Click Systems Infrastructure Virtual Server or Systems Infrastructure Virtualization Platform from the All Targets page.
-
Click the target name to open the home page.
-
Click Virtual Server or Virtualization Platform in the upper left corner of the page. Click Control.
-
Click Create Blackout.
-
Select a reason from the menu.
-
Add comments, as needed.
-
Click Submit.
40.10.6 Ending a Monitoring Brownout or Blackout
You can end a blackout or brownout for a virtual server or for the virtualization platform.
-
Click Systems Infrastructure Virtual Server or Systems Infrastructure Virtualization Platform from the All Targets page.
-
Click the target name to open the home page.
-
Click Virtual Server or Virtualization Platform in the upper left corner of the page. Click Control.
-
Click End Blackout or End Brownout.
40.11 Administering Oracle VM Server for SPARC
You can perform the following tasks to manage and administer Oracle VM Server for SPARC:
40.11.1 Viewing Compliance
The Compliance pages enable you to view the compliance framework, standards, and the virtual server or virtual platform's compliance.
You can view compliance for a virtual server or for the virtualization platform.
-
Click Systems Infrastructure Virtual Server or Systems Infrastructure Virtualization Platform from the All Targets page.
-
Click the target name to open the home page.
-
Click Virtual Server or Virtualization Platform in the upper left corner of the page. Click Compliance.
-
Click the option to view Results, Standard Associations, or Real-time Observations.
40.11.2 Identifying Changes in a Virtual Server Configuration
When an administrator changes a virtual server or virtualization platform configuration, it can be helpful to know the when the configuration was last changed. This information appears in the configuration dashlet on the Summary page.
To view more detailed information for a virtual server or virtualization platform:
-
Click Systems Infrastructure Virtual Server or Systems Infrastructure Virtualization Platform from the All Targets page.
-
Click the target name to open the home page.
-
Click Virtual Server or Virtualization Platform in the upper left corner of the page. Click Configuration.
-
Click the option to view Last Collected, Comparison and Drift Management, Compare, Search, History, Save, Saved, or Topology.
40.11.3 Editing Virtual Server Administrator Access
-
Click Systems Infrastructure Virtual Server or Systems Infrastructure Virtualization Platform from the All Targets page.
-
Click the target name to open the home page.
-
Click Virtual Server or Virtualization Platform in the upper left corner of the page. Click Target Setup.
-
Click Administrator Access.
40.11.4 Adding a Virtual Server to a Group
-
Click Systems Infrastructure Virtual Server or Systems Infrastructure Virtualization Platform from the All Targets page.
-
Click the target name to open the home page.
-
Click Virtual Server or Virtualization Platform in the upper left corner of the page. Click Target Setup.
-
Click Add to Group.
40.11.5 Editing Virtual Server Properties
-
Click Systems Infrastructure Virtual Server or Systems Infrastructure Virtualization Platform from the All Targets page.
-
Click the target name to open the home page.
-
Click Virtual Server or Virtualization Platform in the upper left corner of the page. Click Target Setup.
-
Click Properties.
40.12 Related Resources for Oracle VM Server for SPARC
See the Oracle Enterprise Manager Cloud Control Administrator's Guide for information about the following: