19 Troubleshooting Middleware Applications Using Enterprise Manager
This section describes various methods to troubleshoot middleware applications using Enterprise Manager.
As the enterprise software world becomes more complex, troubleshooting issues can become more difficult. A quick glance at the documentation for Oracle middleware illustrates the complexity that is possible:
https://docs.oracle.com/en/middleware/
This section introduces various methods to troubleshoot applications using Enterprise Manager and associated products that do not require the troubleshooter to have expertise relating to the failed middleware component.
This chapter includes the following sections:
19.1 Introduction to Troubleshooting Middleware Applications
This chapter provides an introduction to some of the features of Enterprise Manager that you may not be aware of and documents some techniques that experienced people in Oracle Support have learnt and would like to pass on to you, our customers.
To summarize the methodology used in this guide:
-
Prepare your environment by understanding and preparing your systems to be monitored, as describe in Section 19.2, "Preparing the Environment to Troubleshoot Applications" and Section 19.3, "Configure the Environment to Help Troubleshoot Applications".
-
If your system consists of many middleware tiers, try to isolate an issue to a single middleware tier as described in Section 19.4.4, "Analyzing Incidents in an Environment with Multiple Middleware Tiers".
-
Once you have isolated the issue to a single middleware tier, use Enterprise Manager to further isolate and resolve the issue as described in Section 19.4.3, "Analyzing Incidents in an Environment with a Single Middleware Tier".
-
If necessary, resolve any issues as described in Section 19.5, "Resolving Issues Using Enterprise Manager".
Note:
Troubleshooting requires that you have an issue that needs to be resolved, this might require that you artificially load the system to produce monitoring results in Enterprise Manager. This is especially true for Java loads, however, the techniques required for producing these loads is outside of the scope of this guide.For example, the environment might consist of a web application which is using information from various servers.
A typical issue might be expressed by a user encountering a difficulty with a specific aspect of the web application. Occasionally, it is obvious which middleware tier is responsible and how to resolve the issue. However, with the complexity of modern applications, and the specialization of personnel, it is more productive to analyze the system using monitoring software that allows you to discover the root cause of an issue and to put the correct fix in place. For example, monitoring a production environment might reveal an issue that is unique to that environment and that could not be revealed by analysis of individual middleware tiers or that could not be reproduced in a test environment.
The diagram is a simple view of a system and does not include Oracle Coherence. Coherence as well as Managed Coherence (Coherence running in a WebLogic domain) includes a new feature, Coherence Heat Map, which together with Coherence Log Viewer/Search can help isolate middleware issues.
Also, note that a performance issue can be related to items outside of the control of Enterprise Manager, therefore it is important to understand the timing involved in delivering your application before attempting to resolve performance issues.
Figure 19-2 Typical Timing for a Web Application
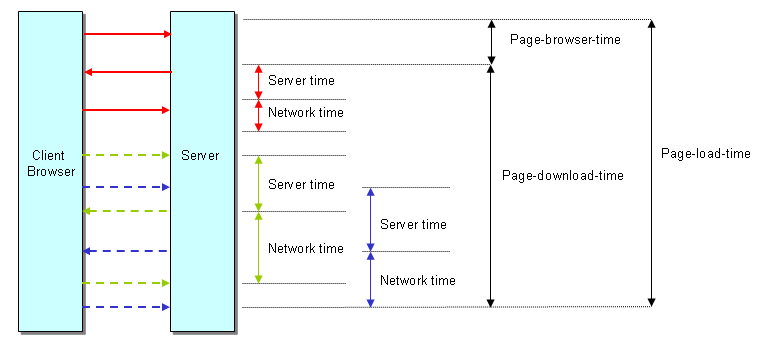
Description of ''Figure 19-2 Typical Timing for a Web Application''
19.2 Preparing the Environment to Troubleshoot Applications
The amount to time and effort required to troubleshoot applications can be reduced by performing certain steps to prepare the environment. This section outlines additions to the environment that can help the troubleshooting process. You may have already performed the steps in this section, or some of the steps might not be possible in your environment. In this case skip to Section 19.3, "Configure the Environment to Help Troubleshoot Applications".
The following table outlines the situations when you can install extra software to prepare the environment:
Table 19-1 Installation Options
| Environment Configuration | Installation Option |
|---|---|
|
All |
Install Management Agents on all nodes. |
|
Web Application |
Install Oracle Real User Experience Insight (RUEI). |
|
Java Applications |
Install JVM Diagnostics (JVMD). |
|
Multiple Middleware Tiers |
Install Oracle Business Transaction Management (BTM). |
19.2.1 Document the Topology of the Systems in the Environment
The scope of this task varies depending on the systems that you need to monitor. It is important to monitor all components of the system that can affect performance, including any external services that your system relies on.
Enterprise Manager can automatically provide complete topology documentation for a typical modern environment. If all the systems involved are provided by Oracle, you can be sure that Enterprise Manager is capable of discovering and monitoring all the components. Enterprise Manager can also be used to monitor many non-Oracle systems, for example, using the Oracle System Monitoring Plug-in for Microsoft Active Directory.
However, many systems include components that are unique, for example a system that still relies on a call to a legacy mainframe system. Before you can troubleshoot a complex system, it is important to understand each component and dependency. In some organizations, dependencies can be forgotten as staff changes, so it is important to produce a document relating to that system topology to enable troubleshooting to occur in the future. Some examples of Deployment Topologies are:
-
MySOACompany Topology with OAM available from:
http://docs.oracle.com/cd/E23943_01/core.1111/e12036/intro.htm
-
WebCenter Topology with OAM available from:
http://docs.oracle.com/cd/E23943_01/core.1111/e12037/intro.htm
19.2.2 Install Management Agents on All Systems in the Environment
Oracle Management Agent (Management Agent) is one of the core components of Enterprise Manager Cloud Control that enables you to convert an unmanaged host to a managed host in the Enterprise Manager system. The Management Agent works in conjunction with the plug-ins to monitor the targets running on that managed host.
Therefore, at any point in time, if you want to monitor a target running on a host, ensure that you first convert that unmanaged host to a managed host by installing a Management Agent, and then manually discover the targets running on it to start monitoring them.
To install a Management Agent, use the Add Host Targets Wizard that is accessible from within the Enterprise Manager Cloud Control console, or use EM CLI. Oracle recommends that you use this wizard, or EM CLI, for the mass-deployment of Management Agents.
For more information on installing Management Agents, see the Installing Oracle Management Agents chapter of the Enterprise Manager Cloud Control Basic Installation Guide.
19.2.3 Install JVMD to Help Troubleshoot Java based Applications
Java Virtual Machine Diagnostics (JVMD) is one of the critical functionalities in Enterprise Manager Cloud Control that enables administrators to diagnose performance problems in Java applications in the production environment. By eliminating the need to reproduce problems, it reduces the time required to resolve these problems, thus improving application availability and performance. JVMD has minimal performance overhead and can be deployed dynamically (without restarting servers).
To install JVMD, use the instructions provided in Installing JVM Diagnostics chapter of the Enterprise Manager Cloud Control Basic Installation Guide.
19.2.4 Install RUEI to Help Troubleshoot Web Applications
The usage of web applications and services continues to grow. This includes not only the use of the Internet as a marketing channel, but also Extranet-based supply chain and back-office integration, and Intranet deployment of internal applications. Increasingly, it also includes the utilization of web services which implement clearly defined business functions. RUEI is designed for measuring, analyzing, and improving the availability and performance of all of these deployment scenarios, allowing you to isolate issues relating to the end user experience. To achieve this, RUEI is capable of performing end user data collection from network traffic, ADF servers and/or data collection using Javascript browser instrumentation, that is, RUEI provides an end-user data monitoring solution.
To install RUEI, use the appropriate installation guide for your version of RUEI from:
http://www.oracle.com/technetwork/apps-tech/realuserei-091455.html
Note:
After installing RUEI, most actions relating to monitoring end users can be performed from Enterprise Manager.19.2.5 Install BTM to Help Troubleshoot Multiple Tier Applications
As applications grow in capability and complexity, real-time visibility into business transactions supported by these applications is becoming an imperative. Transaction management requires IT organizations address key challenges, such as: tracking transaction status & health, reporting on business metrics embedded in transaction content, and managing transaction errors. Oracle Business Transaction Management (BTM) efficiently helps organizations resolve such challenges by providing them an in-depth capability in key areas such as transaction visibility, business KPI monitoring, and proactive exception management.
Oracle BTM not only allows businesses to benefit from the increased reliability of their business transactions, but also allows IT to benefit from a reduction in total cost of ownership (TCO) for application infrastructure.
To install BTM, use the appropriate installation guide for your version of BTM from:
http://docs.oracle.com/cd/E24628_01/nav/assoproducts.htm
19.3 Configure the Environment to Help Troubleshoot Applications
This section describes configuration options that can help improve troubleshooting. The possible configuration options depend on the software installed in the environment. For example, you cannot create a RUEI application if you have not installed RUEI. See Table 19-1, "Installation Options" for a list of installation options.
19.3.1 Discover All Targets in the Environment
Discovery refers to the process of identifying unmanaged hosts and targets in your environment. Targets are entities such as host machines, databases, Fusion Middleware components, that can be managed and monitored in Enterprise Manager Cloud Control. Make sure that all hosts and targets are monitored in Enterprise Manager so that troubleshooting issues is as easy as possible.
Use Enterprise Manager to discover all targets in your environment as described in the Enterprise Manager Cloud Control Administrator's Guide.
Note:
If a target (for example, a host) fails and it has not been discovered, as described above, there will be no indication of the source of the issue in the Enterprise Manager console.19.3.2 Deploy JVM Agents in the Environment
Java Virtual Machine Diagnostics (JVMD) is one of the critical functionalities in Enterprise Manager Cloud Control that enables administrators to diagnose performance problems in Java applications in the production environment. By eliminating the need to reproduce problems, it reduces the time required to resolve these problems.
The JVMD Agent is deployed on the targeted JVM (the one running a production WebLogic Server). It collects real-time data and transmits it to the JVM Diagnostics Engine. This data is stored in the Management Repository, and the collected information is displayed on Enterprise Manager Cloud Control console for monitoring purposes. The communication between the JVMD Engine (a built-in component of the Oracle Management Services) and the JVMD Agent can be a secure (SSL) or non-secure connection.
To install JVMD, use the Application Performance Management page that is accessible from within the Enterprise Manager Cloud Control console. To access this page, from the Setup menu, select Middleware Management, then select Application Performance Management.
For more details on installing JVM Diagnostics, see Enterprise Manager Cloud Control Basic Installation Guide.
19.3.3 Define Composite Applications to Help Troubleshoot Multiple Tier Applications
Composite applications allow you to group a set of targets according to tier, so that you can distinguish between issues occurring in different tiers.
Note:
A composite application can be defined to represent multiple tiers (for example, WebLogic servers, SOA Suite and Coherence servers), or it could be defined to represent a web application (WebLogic servers and database). This allows different Enterprise Manager users to create different definitions to represent their unique perspective of the environment, for example application administrators might define a different composite application compared to DBAs.Defining a composite application is described in the Composite Applications chapter of this guide.
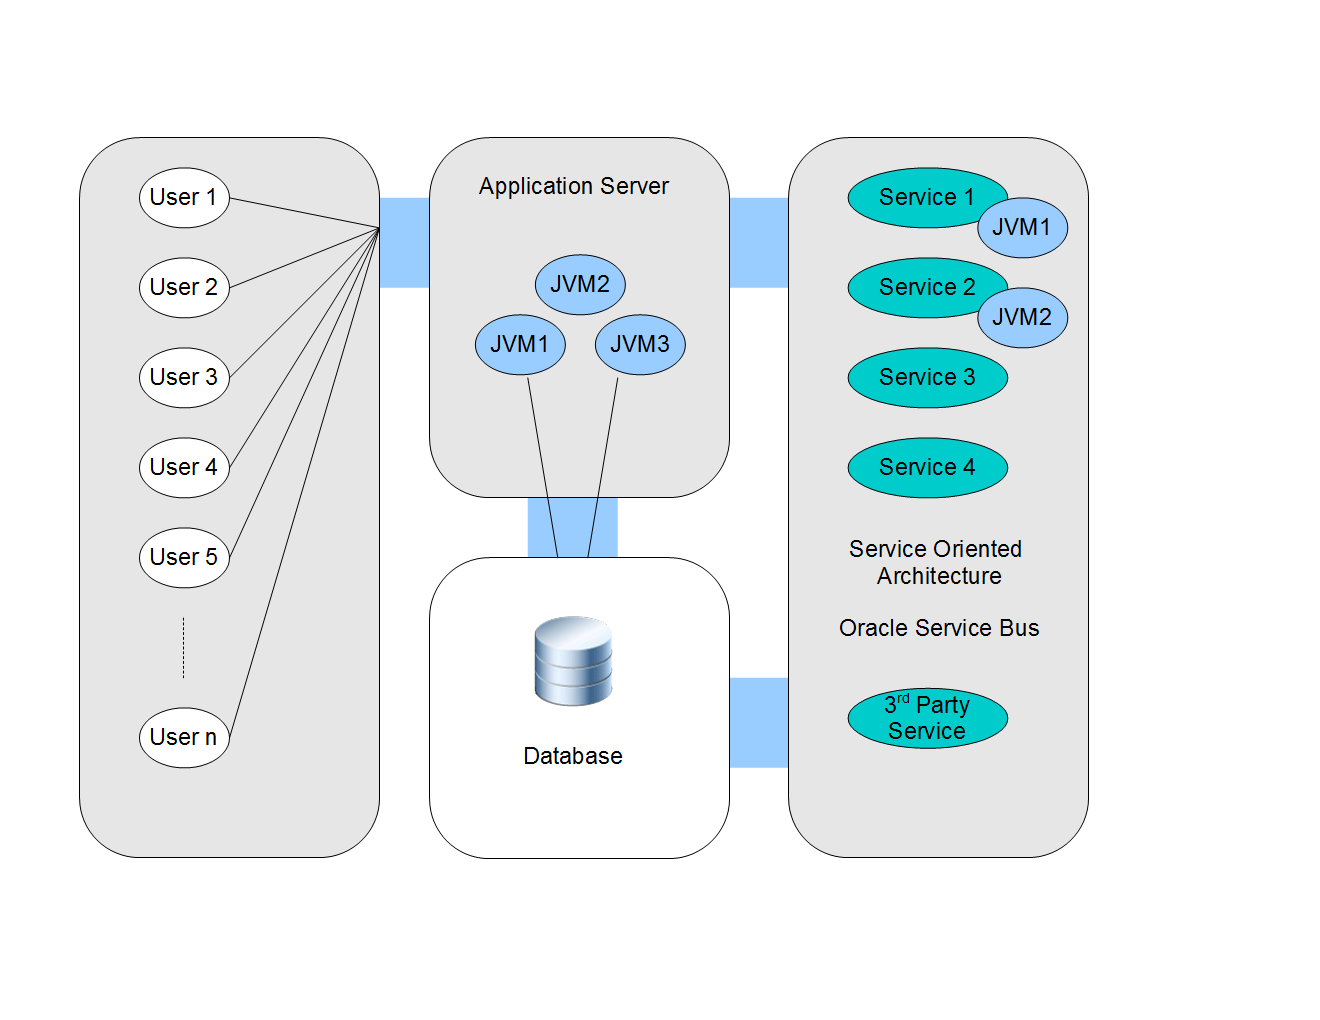
Using the environment in Figure 19-1, "Example Environment" as an example, the composite application might be defined as:
-
Add all WebLogic servers from Service 2 to a composite application in Enterprise Manager. (The managed server becomes a key member of the composite application).
-
Add a service target to the composite application.
-
Define a SLA rule that determines when the composite application is considered to be down.
19.3.4 Define BTM Transactions to Help Troubleshoot Multiple Tier Applications
A transaction is a sequence of service operations that you want to monitor and manage as one unit. Typically, this is defined for environments that include Oracle Service Bus.
Defining a transaction is described in Enterprise Manager Business Transaction Management Online Help.
19.3.5 Define Synthetic Monitoring Beacons in Enterprise Manager
Synthetic Monitoring Beacons are targets that are used to monitor service tests, primarily to measure performance of the service or business function from a different geographic location.
For more details on Beacons, see the Configuring and Using Services chapter of the Enterprise Manager Cloud Control Administrator's Guide.
19.3.6 Define Thresholds in Enterprise Manager
There are monitoring situations in which different workloads for a target occur at regular (expected) intervals. Under these conditions, a static alert threshold would prove to be inaccurate. For example, the accurate alert thresholds for a database performing Online Transaction Process (OLTP) during the day and batch processing at night would be different. Similarly, database workloads can change based purely on different time periods, such as weekday versus weekend. In both these situations, fixed, static values for thresholds might result in false alert reporting.
Advanced Thresholds allow you to define and manage alert thresholds that are either adaptive (self-adjusting) or time-based (static).
Adaptive Thresholds are thresholds based on statistical calculations from the target's observed behavior (metrics).
Time-based Thresholds are user-defined threshold values to be used at different times of the day/week to account for changing target workloads.
For more details on Beacons, see the Advanced Threshold Management chapter of the Enterprise Manager Cloud Control Administrator's Guide.
19.3.7 Set up Compliance Management in Enterprise Manager
Compliance Management provides the ability to evaluate the compliance of targets and systems as they relate to business best practices for configuration, security, and storage. This is accomplished by defining, customizing, and managing compliance frameworks, compliance standards, and compliance standard rules. In addition, Compliance Management provides advice of how to change configuration to bring your targets and systems into compliance. Compliance Management can help you maintain security and performance across all tiers with automated policy violation alerts for settings, for example, ensuring automated policy violation alerts for log levels, JVM versions, and patch levels. If you require legal compliance relating to security, you can set up WebLogic Security Technical Implementation Guidelines (STIG) rules as required.
For more details on compliance, see the Managing Compliance chapter of the Enterprise Manager Lifecycle Management Administrator's Guide. Also see the Managing Configuration Information of Oracle Enterprise Manager Lifecycle Management Administrator's Guide for information on a new feature, configuration drift that ensures consistency (uniformity) across a large number of targets.
19.3.8 Create a RUEI Application to Help Troubleshoot Web Applications
RUEI can monitor various types of application, and separate the data from each application for reporting. In RUEI, you create either an application, suite or service to correspond with the set of services that you want to monitor. The term, RUEI suite, is used if these application is based on certain Oracle Enterprise architectures (such as Oracle E-Business Suite, Siebel, and WebLogic Portal).
Before attempting this task, make sure that you have installed RUEI as outlined in Section 19.2.4, "Install RUEI to Help Troubleshoot Web Applications."
After installing the software, perform the following tasks to create a RUEI application or suite.
-
If you want to monitor network timing, you must set up a network tap as described in the RUEI Installation Guide. However, you can skip this step if you want to create a tag-based application, where you insert javascript (Browser JS Library) into your web templates, and that javascript reports events from the client browser.
-
Perform initial configuration of RUEI as described in Configuring RUEI chapter of the RUEI Installation Guide.
-
If you want to monitor ADF applications, you can use RUEI's ADF Monitoring Service, where ADF-specific timings are reported. See the Configuring RUEI for ADF Monitoring chapter of the RUEI Installation Guide for more information.
-
Check the RUEI documentation for any specific information relating to a component you intend to monitor. For example, if you intend to monitor an environment that uses Oracle Access Manager, see the Configuring the Oracle Access Manager chapter of the RUEI Installation Guide.
-
Create a RUEI Application or Suite using the instructions in Identifying and Reporting Web Pages and Working With Suites and Web Services chapters of the RUEI User's Guide.
Note:
With Enterprise Manager 13c, there is a new service level target, called an End User Service (EUS) corresponding to each RUEI Application/Suite. The EUS has the same name as the RUEI Application/Suite, and is used to create a business application. See Section 17.7, "Monitoring an End User Service" for more information.19.3.9 Define RUEI Service Level Agreements
Requirements Initially, RUEI reports are only available from the RUEI user interface. For RUEI data to be available in EM, you must connect RUEI to EM as described in Registering RUEI/BTM Systems
Procedure Key Performance Indicators and Service Level Agreements provide a method for business users to monitor processes and to be alerted if an issue arises. However, they can also be used to gather data that can be used to help troubleshoot problems in a complex environment.
See the Setting Up Performance Monitoring chapter of the RUEI User's Guide for more information on defining KPIs in RUEI.
19.3.10 Deploy BTM Agents to Help Troubleshoot Multiple Tier Applications
Using Business Transaction Management (BTM), a component of the Oracle Management packs, you can monitor the performance of services and transactions in real time, and therefore monitor failures and perform root-cause analysis to locate bottlenecks, errors, and incomplete transactions.
Using BTM requires installing software and then deploying BTM agents. The main benefit of BTM from a troubleshooting perspective is to provide information that helps isolate the middleware component that is causing issues in a complex environment.
For details on installing BTM, see Business Transaction Management Installation Guide. After installing observers, BTM can discover the topology of your environment, but you can define transactions manually to further help troubleshoot issues.
19.3.11 Create a Business Application in Enterprise Manager
A Business Application is an Enterprise Manager target that represents a logical application; for the user, it defines a unit of management. A Business Application is composed of RUEI applications and BTM transactions. Using the Enterprise Manager Console, you view a Business Application to access RUEI and BTM performance data as well as information about the application's supporting infrastructure: the hosts and servers where the application services are executing.
Creating a business application is described in the Monitoring Business Applications chapter of this guide.
19.4 Analyzing Issues Using Enterprise Manager, BTM and RUEI
Enterprise Manager, BTM and RUEI provide tools to analyze incidents, transactions and user experience issues, and these methods are documented in the appropriate documentation set. However, this section outlines how to use all of the tools together to troubleshoot an issue, and that method can be summarized as:
-
If your system consists of many middleware tiers, try to isolate an issue to a single middleware tier.
-
Once you have isolated the issue to a single middleware tier, use Enterprise Manager to further isolate and resolve the issue.
For example, if the application consists of a single tier, it might be represented as follows:
Figure 19-3 Troubleshooting a Single Tier
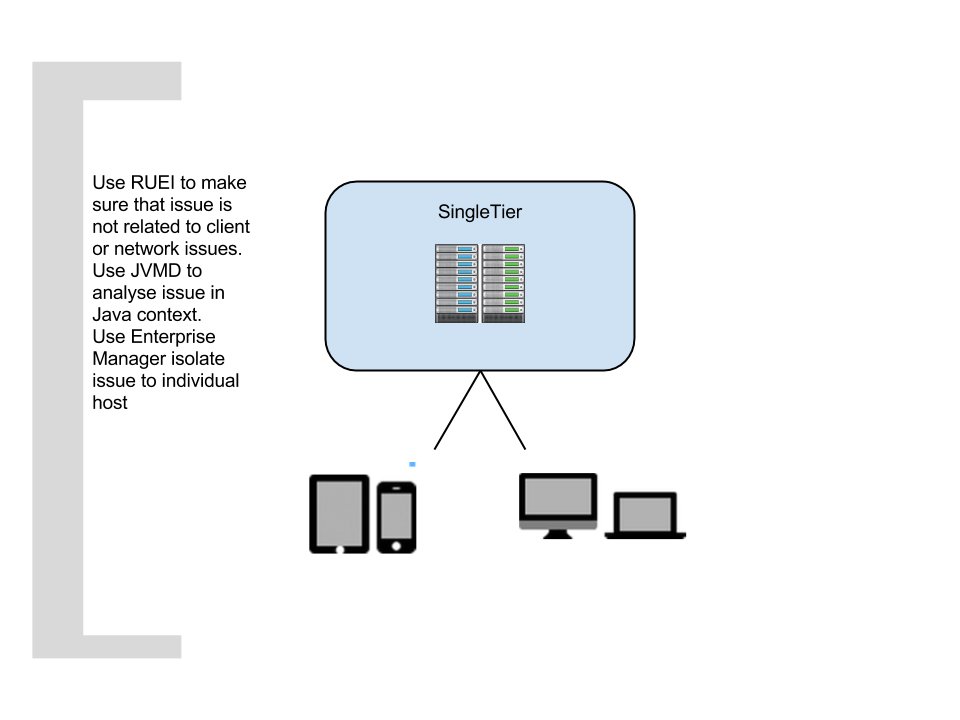
Description of ''Figure 19-3 Troubleshooting a Single Tier''
If the application consists of multiple tiers, it might be represented as follows:
Figure 19-4 Troubleshooting Multiple Tiers
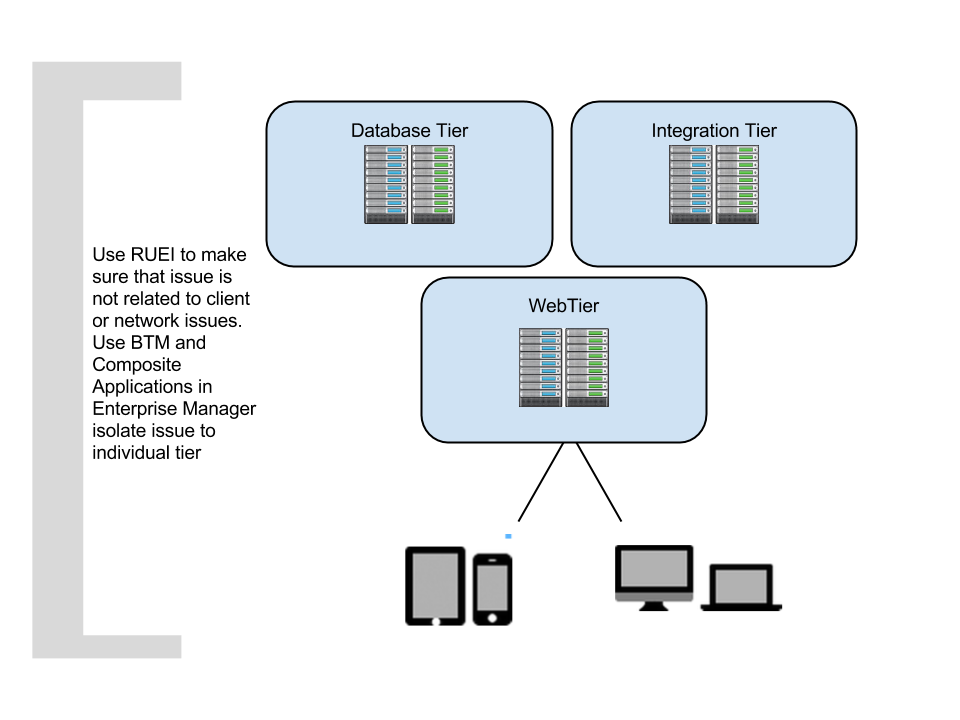
Description of ''Figure 19-4 Troubleshooting Multiple Tiers''
This section describes the following approaches to analyzing issues:
-
Analyzing Incidents in an Environment with a Single Middleware Tier
-
Analyzing Incidents in an Environment with Multiple Middleware Tiers
19.4.1 Analyzing Incidents using Log Files
Regardless of the complexity of the environment, you can use Enterprise Manager to quickly analyze an incident using the data in log files. For most targets:
-
Select Monitoring from the Enterprise menu, then select Logs.
-
Click Search and select the targets you want to analyze.
-
Specify the criteria for the search, for example select Trace for very detailed logs.
-
Click Search to view the results.
If you are using RUEI, see Section 17.6.5, "Monitoring Logs".
Note:
With this release, you do not need to deploy JRF to use the log viewer feature.19.4.2 Analyzing Incidents using Business Applications
If you created a business application as described in Section 19.3.11, "Create a Business Application in Enterprise Manager", you can use Enterprise Manager to analyze all the monitoring information from RUEI, BTM and Enterprise Manager using one dashboard, which provides you with the capability to drill down into the root cause of the issue. For more information, see the Monitoring Business Applications chapter of this guide.
Figure 19-5 Business Application Dashboard
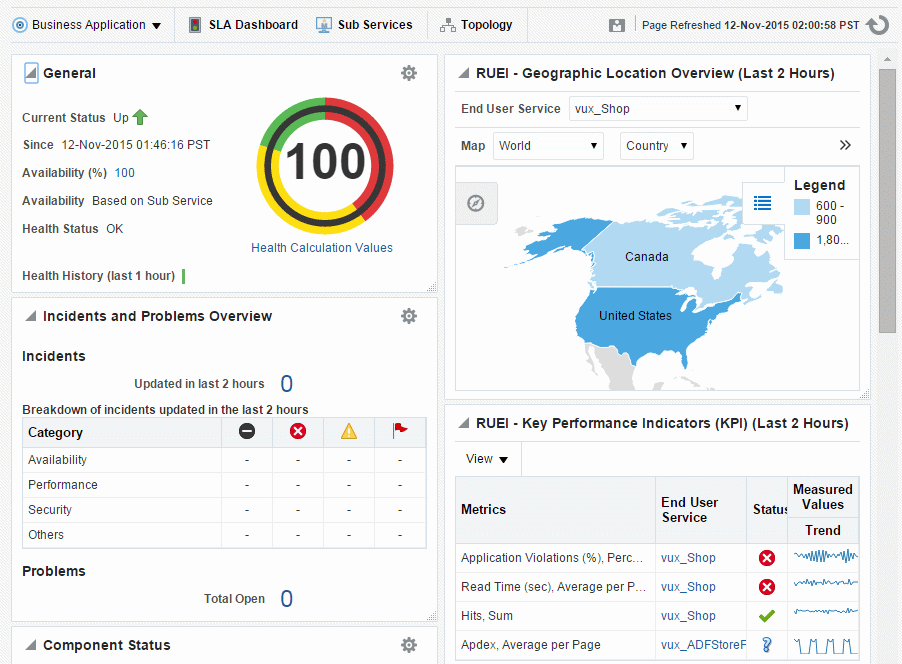
Description of ''Figure 19-5 Business Application Dashboard''
19.4.3 Analyzing Incidents in an Environment with a Single Middleware Tier
This section describes how to analyze incidents in a single middleware tier. This tier can consist of one or more nodes that operate together to provide a service. Examples include:
-
A set of WebLogic servers (a typical scenario for a website)
-
An Oracle Access Manager installation that provides authentication and authorization services
-
A WebCenter Portal
For the procedures described here to be effective, it is assumed that you have isolated issues to a particular middleware tier or that your application consists of a single middleware tier. If you are unsure where the issue you are trying to resolve is located, use the process described in Section 19.4.4, "Analyzing Incidents in an Environment with Multiple Middleware Tiers."
19.4.3.1 Check EM Dashboards to Analyze Incidents
If an issue if reported to you, the simplest troubleshooting method is to:
-
Log into Enterprise Manager.
-
Check the dashboard for issues relating to the hardware, operating system, database or middleware tier.
-
If an item is highlighted, click through to view the detail.
-
Restart any stopped items or note any suggestions made by Enterprise Manager to resolve the issue.
If Enterprise Manager is monitoring a large set of targets, the method above may not be practical. To help troubleshoot a subset of targets, consider creating a Business Application or Composite Application to make the task more manageable.
19.4.3.2 Use RUEI to Check Pages Affected by an Incident
With Enterprise Manager 13c and RUEI, you can immediately explore web application issues by:
-
Log into Enterprise Manager.
-
Navigate to the End User Service associated with the web application you want to troubleshoot. From the Targets menu, select Services. The currently defined services are listed. Filter for end user services. Alternatively, you can navigate to the End User Service from the Business Application home page by clicking on the Sub Services tab. The resulting list may include End User Services if the Business Application includes one.
-
Click the End User Service of interest. The home page for the selected end user service is displayed. This is very similar to the Business Application home page shown in Figure 19-5. From this page you should be able to determine whether the issue affects all pages or individual pages
-
If the issue only affects an individual page, you can use other techniques (for example, session diagnostics) to determine the root cause.
19.4.3.3 Use JVMD to Isolate Issue
In Enterprise Manager, you can access JVMD information for a transaction operation by selecting a transaction in the Business Application and opening the transaction summary page. Then do one of the following:
-
Right click one of the operation nodes in the topology diagram and select JVMD diagnostics from the context menu.
-
Right click one of the operation rows in the operations table and select JVMD diagnostics from the context menu
For more information see Chapter 16, "Getting Detailed Execution Information".
JVMD also allows you to view related logs as described in Chapter 21, "Using JVM Diagnostics".
19.4.3.4 Use Thresholds and Compliance to Analyze Incidents
Thresholds and compliance provide a method to perform incident management, provided you have performed the set up in advance. For example, if an issue is not corresponding to an incident on the dashboard, but you suspect a memory issue:
-
Set a threshold for Component Memory Usage using the instructions provided in the Enterprise Manager Cloud Control Administrator's Guide.
-
If the timing of the threshold incident correlates with the reported issue, try increasing the memory allocated to the component.
-
If the timings do not correlate, you have established that the issue is probably not memory related and you can develop a different theory and set a new threshold and repeat the process.
19.4.4 Analyzing Incidents in an Environment with Multiple Middleware Tiers
This section describes how to analyze incidents in complex environment consisting of more than one middleware tier. Each tier can consist of one or more nodes that operate together to provide a service. Examples include:
-
A set of WebLogic servers hosting a website where Oracle Access Manager provides authentication and authorization services
-
An Oracle Fusion Middleware environment running BPEL, Oracle Access Manager and Oracle SOA Suite
When you find the middleware tier where the issue is located, use the process described in Section 19.4.3, "Analyzing Incidents in an Environment with a Single Middleware Tier."
19.4.4.1 Use BTM to Isolate the Tier
This procedure assumes that you have defined transactions in BTM. If you have not defined transactions in BTM, you can still use BTM to troubleshoot your issue as described in Section 19.4.4.3, "Use Dependency Tab in BTM to Isolate Tier." For more information on the techniques described here, see the Discovering Services and Working with Transactions chapter of this guide.
To isolate the tier using BTM:
-
Select Operational Health Summary from the Dashboards view.
-
Check Slowest Avg Response Time table in the Top 10 Transactions dashboard.
-
Select a transaction to view details. In the Summary subtab you can see the topology of the transaction in a diagram.
-
Place the cursor on any of the participating services shown in the diagram to view the throughput, faults, and response time for that service. If necessary, filter by time to view details for a particular time period.
-
Note the services with the poorest performance and use the techniques described in Section 19.4.3, "Analyzing Incidents in an Environment with a Single Middleware Tier" to further isolate the issue.
19.4.4.2 Use Composite Applications to Highlight Key Metrics
This procedure assumes that you have defined composite applications in Enterprise Manager. To isolate the tier using composite applications:
-
Select Composite Applications from the Targets menu.
-
Check the status of the relevant composite applications, noting the status of SLAs and signature services.
-
Note the composite applications with the poorest performance and use the techniques described in Section 19.4.3, "Analyzing Incidents in an Environment with a Single Middleware Tier" to further isolate the issue.
19.4.4.3 Use Dependency Tab in BTM to Isolate Tier
If you have not defined transactions in BTM, you can still get some troubleshooting information from BTM:
-
Select the Services To Endpoints view or the Services to Operations view in the Navigator.
-
Double click on the service of interest to open the tab area if it is not already open. If it is open, just select the service of interest.
-
Select the Dependency tab. Business Transaction Management displays the dependencies between the selected service and the other services with which it interacts. Arrows display traffic flow; their thickness indicates relative throughput size.
-
You can move the cursor over the services displayed to have Business Transaction Management display their component type.
You can also display service dependencies by choosing the Maps > Service Map view from the Navigator.
19.5 Resolving Issues Using Enterprise Manager
After finding the issue using Enterprise Manager (or RUEI/BTM), there are many times you can use Enterprise Manager to perform the tasks required to resolve the issue.
19.5.1 Resolve an Issue Using Configuration Tools
Cloud Control collects configuration information for all managed targets across the enterprise. Collected configuration information is periodically sent to the Management Repository over HTTP or HTTPS, allowing you to access up-to-date configuration information for your entire enterprise through Cloud Control.
Cloud Control enables you to view, save, track, compare, search, and customize collected configuration information for all managed targets known to Enterprise Manager. Additionally, the Configuration Topology Viewer provides a visual layout of a target's relationships with other targets; for example, you can determine a system's structure by viewing the members of a system and their interrelationships.
Also see the Managing Configuration Information of Oracle Enterprise Manager Lifecycle Management Administrator's Guide for information on a new feature, configuration drift that ensures consistency (uniformity) across a large number of targets.
19.5.2 Work with Application Developers or DBAs to Resolve Application Issues
If you have identified an issue caused by code written within your organization, you must work with the developers to provide a solution. For example, the following steps outline a typical scenario:
-
An issue in the checkout code has been identified by operations personnel as causing an average 40 second load time for an application web page (using RUEI).
-
The developer cannot replicate the issue in the development environment, but has accepted that the issue exists after seeing RUEI.
-
Operations and developers meet and use JVMD to isolate the source of the issue.
-
The developer changes the code and operations sets KPIs to monitor the application so that the issue will not reoccur unnoticed.
Similarly, if you have identified an issue with a database, you can work with the appropriate DBA to resolve the issue.
19.5.3 Resolve a Capacity Issue Using Provisioning Tools
Some issues can be resolved by provisioning extra resources. Oracle Enterprise Manager can help with that task, providing automation of provisioning for database, and middleware. See the Enterprise Manager Lifecycle Management Administrator's Guide for details on how to perform provisioning using Enterprise Manager.
Two typical scenarios are provisioning extra nodes or provisioning extra memory. Extra nodes can be added to services like WebLogic servers and Oracle Real Application Clusters. Some issues can be resolved by provisioning extra memory to provide extra capacity. Extra memory can be provided in the following ways:
-
Extra memory can be allocated to the JVM.
-
Extra memory can be allocated to a Virtual Machine.
-
Extra physical memory can be added to a server.