35 Discovering and Monitoring JBoss Application Server
This section describes how you can discover and monitor JBoss application servers in Enterprise Manager Cloud Control.
JBoss Application Server is the market-leading, open source Java Platform, Enterprise Edition (Java EE) application server, delivering a high-performance and enterprise-class platform for e-business applications. JBoss provides enterprise-class security, transaction support, resource management, load balancing, and clustering.
Enterprise Manager Cloud Control enables you to discover JBoss Application Servers in your environment and add them to Cloud Control for central monitoring and management. The JBoss Application Server releases supported for discovery and monitoring are 6.x and 7.x.
This chapter describes how you can discover and monitor these JBoss Application Server targets in Enterprise Manager Cloud Control. In particular, this chapter covers the following:
-
About Managing JBoss Application Servers, JBoss Domains and JBoss Partitions
-
Finding Out the Supported Versions for Discovery and Monitoring
-
Prerequisites for Discovering JBoss Application Servers, Domains and Partitions
-
Discovering JBoss Application Servers 6.x and JBoss Partitions
-
Deploying JVMD on JBoss Application Server 7.x and 6.x to Diagnose Issues
-
Troubleshooting JBoss Application Server Discovery and Monitoring Issues
35.1 About Managing JBoss Application Servers, JBoss Domains and JBoss Partitions
Using Enterprise Manager Cloud Control, you can do the following with JBoss Application Server targets:
-
Discover the following for central monitoring and management:
-
JBoss Application Servers
-
JBoss Server Groups and Domains (for version 7.x)
JBoss Domain is a logical grouping of JBoss Application Servers within your enterprise configuration for JBoss Application Servers version 7.x. JBoss Application Servers are grouped into Server Groups and one or more Server Groups form a JBoss Domain. The Domain Controller runs and manages the collection of JBoss Application Servers within a domain.
When you discover a JBoss Domain, the JBoss Domain, the JBoss Server Groups and all other up and running JBoss Application Servers that are part of that JBoss Domain get automatically discovered. You can select the JBoss Application Servers that you want to add to Enterprise Manager Cloud Control for monitoring, and the associated JBoss Server Groups are automatically added.
-
JBoss Partitions (for version 6.x)
JBoss Partition is a logical grouping of JBoss Application Servers within your enterprise configuration for JBoss Application Servers version 6.x.
When you discover a JBoss Application Server that is part of a JBoss Partition, the JBoss Partition and all other JBoss Application Servers that are part of that JBoss Partition gets automatically discovered and added to Enterprise Manager Cloud Control.
-
-
Monitor the status, the availability percentage, the CPU usage, the heap usage, the Java vendor and version used, and so on.
-
Monitor the status and the overall health of the member application servers that are part of JBoss Domains and Partitions.
-
Monitor the performance by measuring the load and the request processing time for a given interval.
-
Diagnose, notify, and correct performance and availability problems with the help of GUI-rich, intuitive graphs and illustrations.
-
Monitor the status of the deployed applications.
-
Monitor the Servlets and JSPs running on the application servers, including the most requested Servlets in the last 24 hours - applicable only for JBoss Application Servers version 6.x.
-
View details about the associated JVM threads and data sources.
-
Create or end blackouts to suspend or resume the collection of metric data, respectively.
-
Monitor and manage configuration details that were last collected and also the ones that were saved at a given point of time.
-
Compare the configuration between:
-
A last collected configuration of a server instance with a saved configuration of the same server instance or a different server instance.
-
A last collected configuration of a server instance with a last collected configuration of a different server instance.
-
A saved configuration of a server instance with another saved configuration of the same server instance or a different server instance.
-
A saved configuration of a server instance with a last collected configuration of the same server instance or a different server instance.
-
-
View compliance-related information, such as the compliance standards and frameworks associated with the server, the real-time observations, the evaluation results, and so on.
-
View a list of metrics, their collection interval, and the last upload for each metric.
35.2 Finding Out the Supported Versions for Discovery and Monitoring
To search for the JBoss Application Server versions that are supported for discovery and monitoring in Enterprise Manager Cloud Control, follow these steps:
-
Log into
https://support.oracle.com/ -
On the My Oracle Support home page, select Certifications tab.
-
On the Certifications page, enter the following search criteria in the Certification Search section.
-
Enter the product name Enterprise Manager Base Platform - OMS in the Product field.
-
Select the release number 13.1.0.0.0 from the Release list.
-
-
Click Search.
-
In the Certification Results section, expand the Application Server menu to view the certified JBoss Application Server versions.
35.3 Prerequisites for Discovering JBoss Application Servers, Domains and Partitions
Meet the following prerequisites for discovering JBoss Application Servers and JBoss Partitions.
-
Ensure that you use only Oracle Management Agent 13c Release 1 for discovery.
-
Ensure that you download and extract the JBoss Application Server ZIP file, and set the JBOSS_HOME and PATH environment variables as follows:
setenv JBOSS_HOME <jboss_install_location> setenv PATH "${PATH}:/${JBOSS_HOME}/bin" -
Ensure that you start the JBoss Application Server or the JBoss Partition by running the following command from the
bindirectory:./run.sh -c <deployment_profile> -b <binding_address> [-Djboss.partition.name=<partition_name>]
Here,
<deployment_profile>indicates whether you are starting a standalone JBoss Application Server or a JBoss Partition. The<binding_address>is the host name or the IP address running the JBoss Application Server. The<partition_name>is the partition name from where the JBoss Application Servers must start. By default, they start as part of DefaultPartition.For example,
./run.sh -c node1 -Djboss.service.binding.set=ports-01 -b example.oracle.com
Note:
-
To start a standalone JBoss Application Server, set the
<deployment_profile>todefault.For example,
./run.sh -c default -b <binding address> -
To start a JBoss Partition, enable the JBoss clustering service, set the
<deployment_profile>toall.For example,
./run.sh -c all -b <binding address> -
To start multiple server instances on the same host, complete the following:
(a) Create multiple deployment profiles as per your requirements.
(b) Use a different port-set to start the individual servers. Note that ports-01, ports-02, ports-03, and ports-04 are predefined port-sets.
For example,
-Djboss.service.binding.set=ports-01
-
35.4 Discovering JBoss Application Servers 7.x and JBoss Domains
To discover JBoss Application Servers and JBoss Domains, follow these steps:
-
From the Targets menu, select Middleware.
-
On the Middleware page, from the Add menu, select JBoss Application Server.
Enterprise Manager Cloud Control displays the JBoss Discovery Wizard.
-
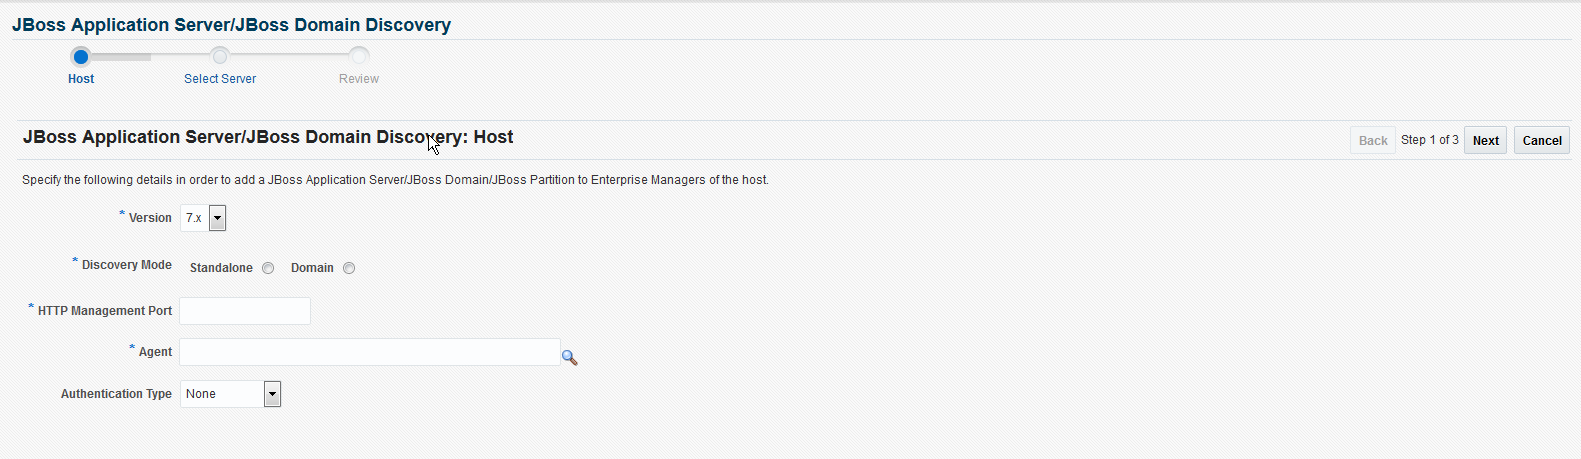
On the Host page, enter details about the host on which the JBoss Application Server is running.
Element Description Version Select the version of the JBoss Application Server you want to discover. Discovery Mode Select either Standalone or Domain. JBoss Application Server Host /JBoss Domain Controller Host If you have selected standalone server enter the host address where the JBoss Server is running, and if you have selected domain enter the host address where the JBoss Domain Controller is running. HTTP Management Port Depending on wether you have selected a standalone server or domain, specify the HTTP Management port of the JBoss Application Server or the Domain Controller. Agent Select the Management Agent that is installed on the host where the JBoss Application Server is running. Authentication Type Select the authentication type. The available options are None, Basic and HTTP Digest. Username Enter the user name for authentication. Password Enter the password for authentication. Click Next after you are done.
-
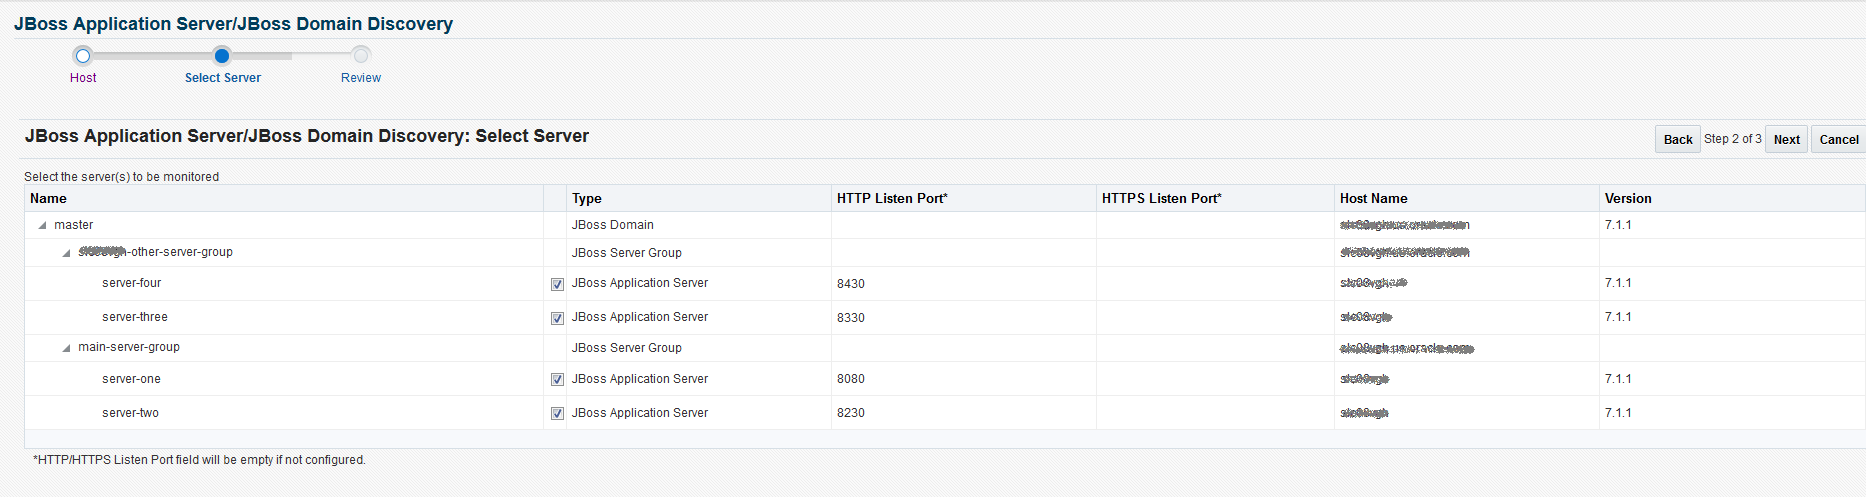
On the Select Server page, view a list of JBoss Domains, JBoss Server Groups and standalone JBoss Application Servers discovered on the host you specified, and to select the ones you want to add and monitor in Enterprise Manager Cloud Control.
Column Description Name Name of the JBoss Domains and Server Groups and standalone JBoss Application Servers discovered on the specified host. Select Select the JBoss Application Server(s) that you want to add and monitor in Enterprise Manager Cloud Control. Note: When you select a JBoss Application Server, the associated JBoss Domain and Server Group also gets selected for monitoring.
Type Type of JBoss target discovered on the specified host. They can be either JBoss Domain, JBoss Server Group or JBoss Application Server. HTTP Listen Port The HTTP listener port that is configured. HTTPS Listen Port The HTTPS listener port that is configured. Host Name The name of the JBoss Application Server host. Version Version of the JBoss Application Server discovered on the specified host. Click Next after you are done.
-
On the Review page, review the details you have provided for discovering and adding JBoss targets to Enterprise Manager Cloud Control. Click Submit to discover the JBoss targets.
Note:
When you discover a JBoss Domain all the JBoss Application Servers part of that domain get automatically discovered and added to Enterprise Manager Cloud Control. At any point after discovering a JBoss Domain, if new JBoss Application Servers are added to the domain, then you can refresh the JBoss Domain as described in Section 35.8.4.35.5 Discovering JBoss Application Servers 6.x and JBoss Partitions
Note:
Discovery is not supported if the JBoss Application Server is monitored with Oracle Management Agent 12c Release 2 (12.1.0.2) or lower.To discover JBoss Application Servers and JBoss Partitions, follow these steps:
-
From the Targets menu, select Middleware.
-
On the Middleware page, from the Add menu, select JBoss Application Server.
Enterprise Manager Cloud Control displays the JBoss Discovery Wizard.
-
On the Host page, enter details about the host on which the JBoss Application Server is running.
Element Description Version Select the version of the JBoss Application Server you want to discover. JBoss Application Server Host Enter the host address where the JBoss Server is running. JMX Connector Port Enter the JMX connector port number. Agent Select the Management Agent that is installed on the host where the JBoss Application Server is running. Authentication Type Select the authentication type. The available options are None, and Basic. Username Enter the JMX user name for authentication. Password Enter the JMX password for authentication. Click Next after you are done.
-
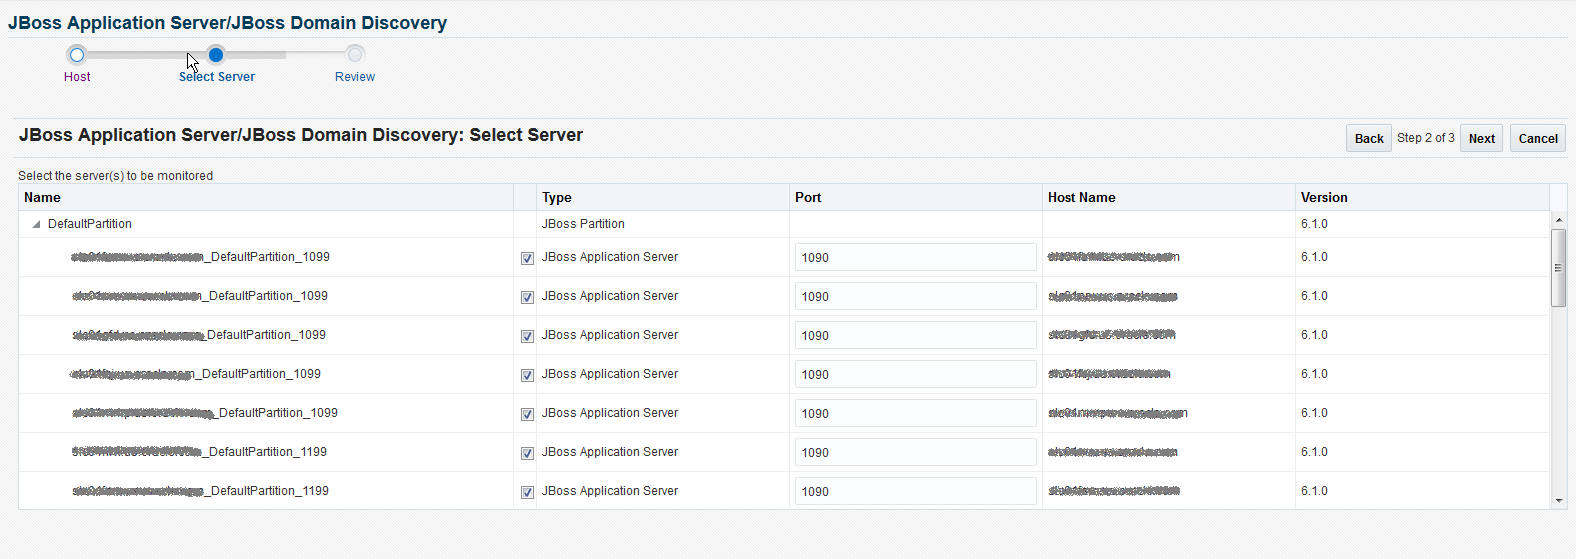
On the Select Server page, view a list of JBoss Partitions and standalone JBoss Application Servers discovered on the host you specified, and to select the ones you want to add and monitor in Enterprise Manager Cloud Control.
Column Description Name Name of the JBoss Partitions and standalone JBoss Application Servers discovered on the specified host. Select Select the JBoss Partition or standalone JBoss Application Server that you want to add and monitor in Enterprise Manager Cloud Control. Note: When you select a JBoss Application Server, the associated JBoss Partition also gets selected for monitoring.
Type Type of JBoss target discovered on the specified host. They can be either JBoss Partition or JBoss Application Server. Port Enter the JMX connector port of the JBoss Application Server. By default, the port number appears for a JBoss Application Server target if you entered it in the previous page of the wizard. Otherwise, the field is blank. Host Name The name of the JBoss Application Server host. Version Version of the JBoss Application Server discovered on the specified host. Note:
Enterprise Manager Cloud Control does not validate the values you provide for User Name and Password. So if you provide incorrect values, Enterprise Manager will add the JBoss target without displaying any errors now, but will eventually show the status as Down.Click Next after you are done.
-
On the Review page, review the details you have provided for discovering and adding JBoss targets to Enterprise Manager Cloud Control. Click Submit to discover the JBoss targets.

Note:
When you discover a JBoss Application Server that is part of a JBoss Partition, the JBoss Partition and all other JBoss Application Servers part of that partition get automatically discovered and added to Enterprise Manager Cloud Control. At any point after discovering a JBoss Partition, if new JBoss Application Servers are added to the partition, then you can refresh the JBoss Partition as described in Section 35.8.4.35.6 Monitoring JBoss Application Servers
This section covers the following:
-
Monitoring Applications Deployed to JBoss Application Servers 7.x and 6.x
-
Monitoring the Performance of JBoss Application Servers 7.x and 6.x
-
Monitoring Servlets and JSPs Running on JBoss Application Servers 6.x
Note:
To view a visual demonstration on how to monitor and manage JBoss Application Server targets, access the following URL and click Begin Video. The monitoring and management described in this visual demonstration is based on Enterprise Manager Cloud Control 12c Release 3 (12.1.0.3).35.6.1 Monitoring JBoss Application Servers 7.x
To monitor JBoss Application Servers version 7.x, follow these steps:
-
From the Targets menu, select Middleware.
-
On the Middleware page, click the desired JBoss Application Servers.
-
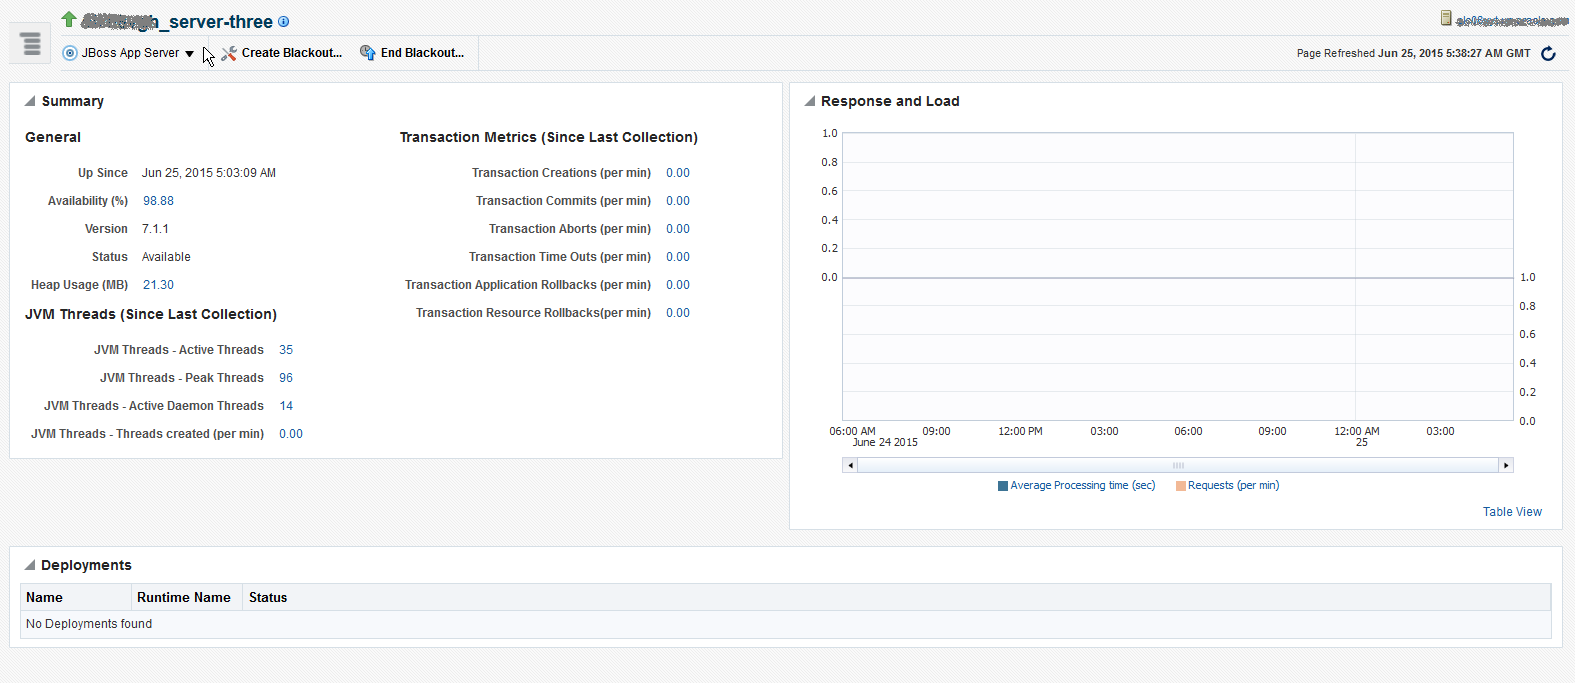
On the JBoss Application Server Home page, you can view a summary of the most critical information pertaining to JBoss Application Server. You can view general information about the server, information about the JVM threads running on the server, and performance summary in terms of load and response time.
The JBoss Partition Home page has the following sections:
-
Summary Section:
35.6.1.1 General
| Element | Description |
|---|---|
| Up/Down/Pending Since | Date and time when the status was last determined. |
| Availability (%) | Indicates whether the JBoss Application Server is available and the availability percentage over the last 24 hours. To drill down to the Status History (Availability) page, click the link. The Status History page displays the availability of the JBoss Application Server along with the availability history of the constituents that are used to compute its availability. |
| Version | Version of the JBoss Application Server. |
| Status | Current status of the JBoss Application Server. The status can be down even if incorrect credentials were provided while discovering the JBoss target. |
| Heap Usage (MB) | Amount of heap space (in MB) used by the JBoss Application Server since the last collection. |
35.6.1.2 JVM Threads
| Element | Description |
|---|---|
| JVM Threads - Active Threads | Number of active JVM threads, including both daemon and non-daemon threads. |
| JVM Threads - Peak Threads | Number of peak active JVM threads since the Java Virtual Machine started or peak was reset. |
| JVM Threads - Active Daemon Threads | Number of active daemon JVM threads. |
| JVM Threads - Threads Created (per min) | Number of JVM threads created per minute. |
35.6.1.3 Transaction Metrics
| Element | Description |
|---|---|
| Transaction Creations (per min) | Number of new transactions created per minute. |
| Transaction Commits (per min) | Number of transactions committed per minute. |
| Transaction Aborts (per min) | Number of transactions aborted per minute. |
| Transaction Time Outs (per min) | Number of transactions timed-out, per minute. |
| Transaction Application Rollbacks (per min) | Number of transactions rolled back by the application, per minute. |
| Transaction Resource Rollbacks (per min) | Number of transactions rolled back by the resource, per minute. |
35.6.1.4 Response and Load Section
Provides a graphical representation of the server's performance, measuring request-processing time for a given interval. To switch to a tabular format, click Table View. To drill down and view more detailed metric-related information and to diagnose issues by looking at other related infrastructure metrics, click the metric names in the legend and select an appropriate option in the Additional Information message.
35.6.1.5 Deployments Section
Provides the deployments on the JBoss Application Server and their statuses.
35.6.2 Monitoring JBoss Application Servers 6.x
To monitor JBoss Application Servers version 6.x, follow these steps:
-
From the Targets menu, select Middleware.
-
On the Middleware page, click the desired JBoss Application Servers.
-
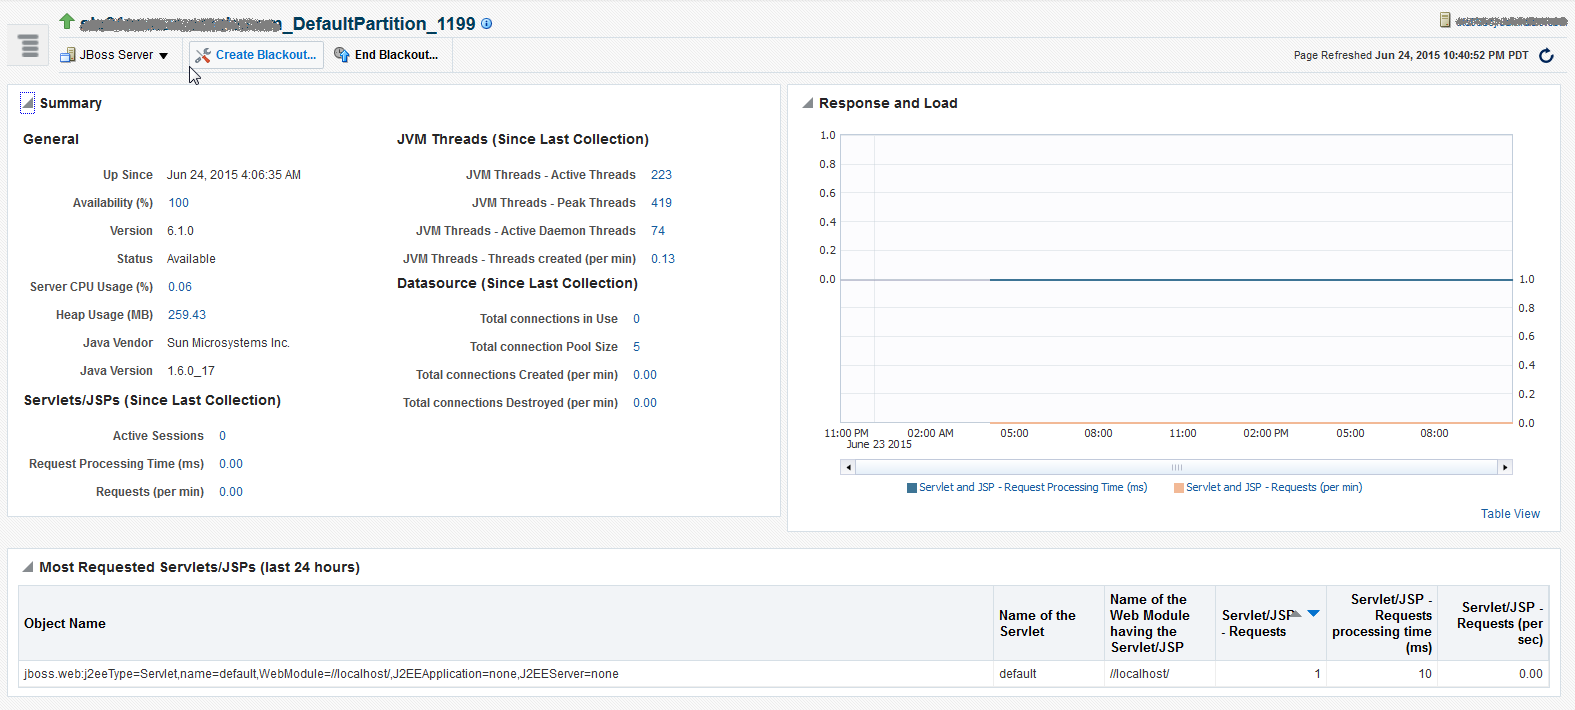
On the JBoss Application Server Home page, you can view a summary of the most critical information pertaining to JBoss Application Server. You can view general information about the server, information about the Servlets and JVM threads running on the server, and performance summary in terms of load and response time.
The JBoss Partition Home page has the following sections:
-
Summary Section:
35.6.2.1 General
| Element | Description |
|---|---|
| Up/Down/Pending Since | Date and time when the status was last determined. |
| Availability (%) | Indicates whether the JBoss Application Server is available and the availability percentage over the last 24 hours. To drill down to the Status History (Availability) page, click the link. The Status History page displays the availability of the JBoss Application Server along with the availability history of the constituents that are used to compute its availability. |
| Version | Version of the JBoss Application Server. |
| Status | Current status of the JBoss Application Server. The status can be down even if incorrect JMX credentials were provided while discovering the JBoss target. |
| Server CPU Usage (%) | Percentage of CPU time used by the JBoss Application Server. |
| Heap Usage (MB) | Amount of heap space (in MB) used by the JBoss Application Server over a given interval. |
| Java Vendor | Vendor of the Java Virtual Machine that this JBoss Application Server runs. |
| Java Version | Version of the Java Virtual Machine that this JBoss Application Server runs. |
35.6.2.2 Servlets/JSPs
| Element | Description |
|---|---|
| Active Sessions | Number of active servlet and JSP sessions. |
| Request Processing Time (ms) | Average time taken (in milliseconds) to service a request in the last 24 hours. |
| Requests (per min) | Number of requests serviced per minute in the last 24 hours. |
35.6.2.3 JVM Threads
| Element | Description |
|---|---|
| JVM Threads - Active Threads | Number of active JVM threads, including both daemon and non-daemon threads. |
| JVM Threads - Peak Threads | Number of peak active JVM threads since the Java Virtual Machine started or peak was reset. |
| JVM Threads - Active Daemon Threads | Number of active daemon JVM threads. |
| JVM Threads - Threads Created (per min) | Number of JVM threads created per minute. |
35.6.2.4 Datasource
| Element | Description |
|---|---|
| Total connections in Use | Number of active database connections in this instance of the data source since the data source was instantiated. |
| Total connection Pool Size | Total size of the connection pool. |
| Total connections Created (per min) | Number of connections created per minute for this data source. |
| Total connections Destroyed (per min) | Number of connections closed per minute for this data source. |
35.6.2.5 Response and Load Section
Provides a graphical representation of the server's performance, measuring request-processing time for a given interval. To switch to a tabular format, click Table View. To drill down and view more detailed metric-related information and to diagnose issues by looking at other related infrastructure metrics, click the metric names in the legend and select an appropriate option in the Additional Information message.
35.6.2.6 Most Requested Servlets/JSPs Section
Provides details of the most requested servlets and JSPs in the last 24 hours.
35.6.3 Administering JBoss Application Servers 7.x and 6.x
To administer JBoss Application Servers, follow these steps:
-
From the Targets menu, select Middleware.
-
On the Middleware page, click the desired JBoss Application Server.
-
On the JBoss Application Server Home page, you can view high-level information pertaining to the selected JBoss Application Server.
To perform administrative tasks on the JBoss Application Server, from the JBoss Server menu, select any of the following according to your needs:
-
Monitoring, to monitor the performance of the target, view metric details, view status information, view incidents and alerts raised so far for the target, and view blackouts and brownouts created for the target.
-
Diagnostics, to analyze and diagnose performance issues.
-
Control, to create or end blackouts and brownouts.
-
Job Activity, to view details of the jobs created for the target.
-
Information Publisher Reports, to view reports.
-
Configuration, to search, view, and compare configuration details.
-
Compliance, to view and create compliance standards.
-
Target Setup, to view monitoring configuration details and target properties, to remove the target or add it to a group, to migrate and use JMX.
-
Target Sitemap, to view the overall topology of the target.
-
Target Information, to view general information about the target.
-
35.6.4 Monitoring Applications Deployed to JBoss Application Servers 7.x and 6.x
To monitor the applications deployed to JBoss Application Servers 7.x and 6.x, follow these steps:
-
From the Targets menu, select Middleware.
-
On the Middleware page, click the JBoss Application Server where the Servlets and JSPs are deployed.
-
On the JBoss Application Server Home page, from the JBoss Server menu, select Monitoring, then select Performance Summary.
-
On the Performance Summary page, scroll down to the Applications section.
35.6.5 Monitoring the Performance of JBoss Application Servers 7.x and 6.x
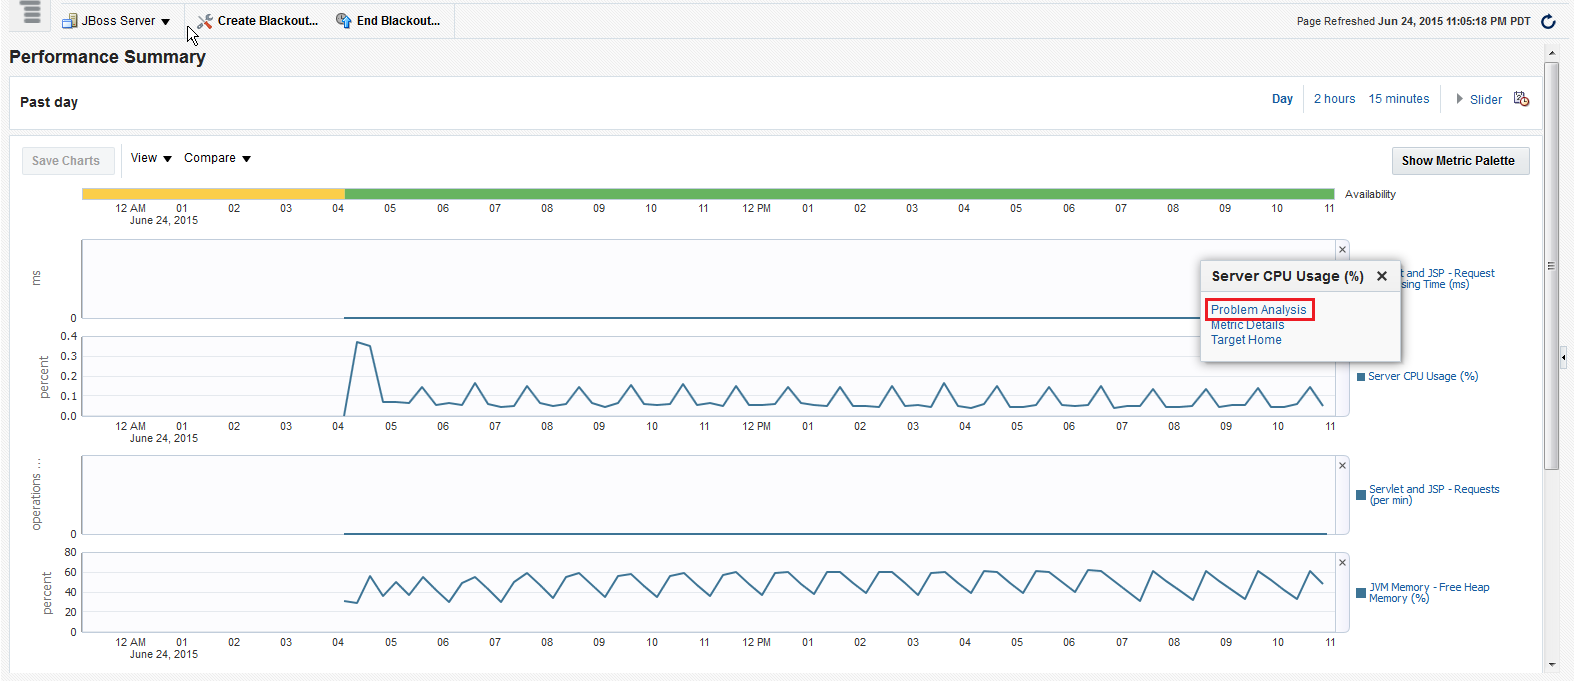
Enterprise Manager Cloud Control helps you monitor the overall performance of JBoss Application Servers. You can view the graphs that depict their memory usage and heap usage. This helps you gauge the performance and perform a root cause analysis to drill down to the problem areas and fix them before they affect the end users.
To monitor the performance of a JBoss Application Server:
-
From the Targets menu, select Middleware.
-
On the Middleware page, click the JBoss Application Server whose performance you want to monitor.
-
On the JBoss Application Server Home page, from the JBoss Server menu, select Monitoring, then select Performance Summary.
-
On the Performance Summary page, you can do the following:
-
View a set of performance charts, monitor the performance over a given interval, and diagnose and correct problems.
-
Customize the set of performance charts that appear on the page. To do so, click Show Metric Palette, and select the charts you want to add to the page.
-
Show or hide the Metrics Palette. To do so, click Show Metric Palette or Hide Metric Palette, respectively.
-
Reorder the performance charts. To do so, from the View menu, select Reorder Charts.
-
Customize the performance charts to show or hide availability and threshold details, and grid lines. To do so, from the View menu, select Availability, Thresholds, or Grid Lines, respectively.
-
Draw a comparison with another IBM WebSphere Application Server's performance, or with the previous day's performance. To do so, from the Compare menu, select With Another JBoss Application Server or Today with Yesterday, respectively.
-
Remove comparison. To do so, from the Compare menu, select Remove Comparison.
-
Create or delete baselines. To do so, from the Compare menu, select Create Baseline or Delete Baseline, respectively.
-
Delete metric performance charts either by clicking the close button on the chart itself, or by deselecting the metric name in the Metric Palette.
-
Change time frames using the slider, or set a default value.
-
Create new metric performance charts by selecting the preferred metrics from the Metric Palette. The charts are automatically created once the metrics are selected.
-
Drag and drop the metrics from a particular metric group to the same chart.
-
35.6.6 Monitoring Servlets and JSPs Running on JBoss Application Servers 6.x
Enterprise Manager Cloud Control helps you monitor the Servlets and JSPs that are running on JBoss Application Servers. You can not only view high-level information about them but also a performance summary that reflects their response time and load. You can also drill down and diagnose issues by viewing related infrastructure metrics, alert history, and so on.
To monitor the Servlets and JSPs running on JBoss Application Servers, follow these steps:
-
From the Targets menu, select Middleware.
-
On the Middleware page, click the JBoss Application Server where the Servlets and JSPs are deployed.
-
On the JBoss Application Server Home page, do these:
-
To view high-level information about the Servlets, see the Servlets region. To understand the metric details displayed in this region, click Help.
-
To monitor the performance of Servlets and JSPs, see the response and load graphic.
-
To drill down and diagnose issues, click a metric name in the legend. From the pop-up message, click Problem Analysis.
-
To view metric statistics, thresholds, and metric value history, click a metric name in the legend. From the pop-up message, click Metric Details.
-
35.6.7 Viewing JBoss Application Server Metrics
To view all JBoss Application Server metrics, follow these steps:
-
From the Targets menu, select Middleware.
-
On the Middleware page, click the desired JBoss Application Server.
-
On the JBoss Application Server Home page, from the JBoss Server menu, select Monitoring, then select All Metrics.
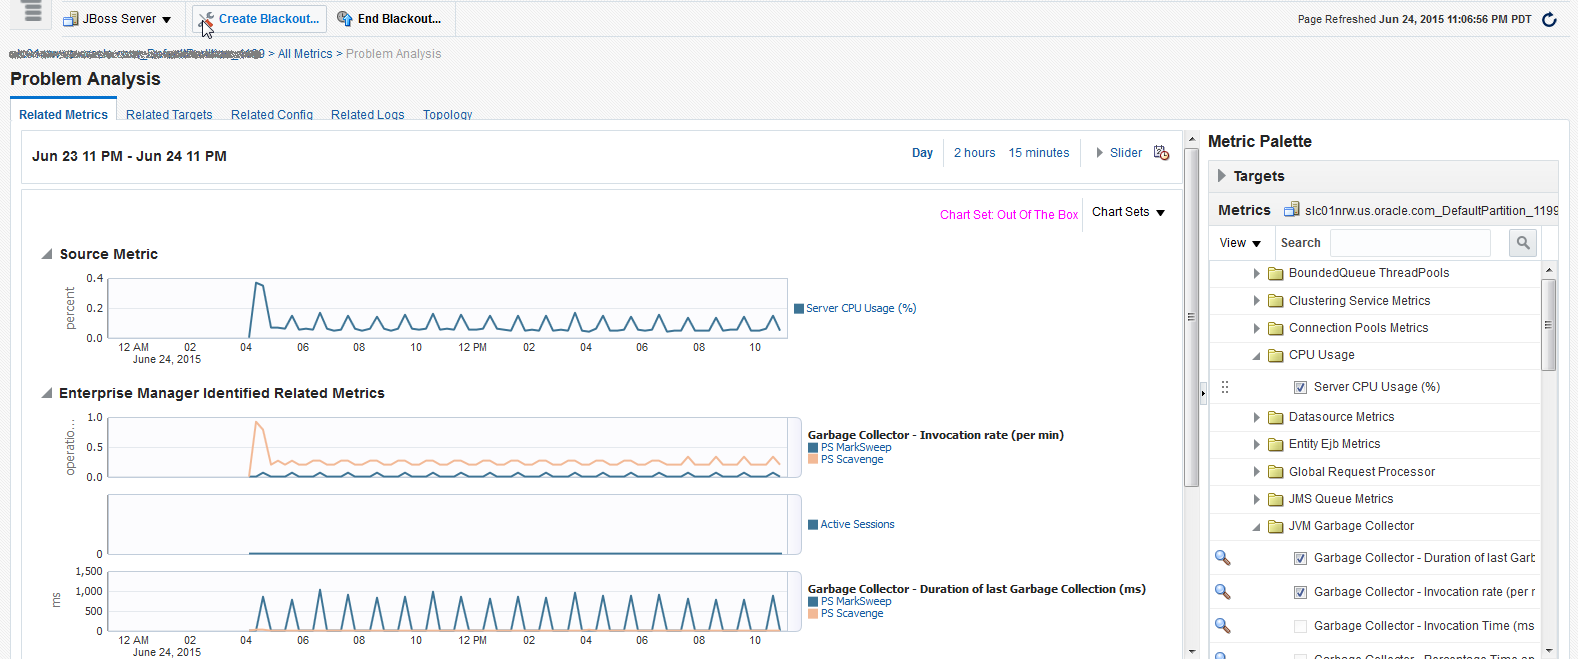
35.6.8 Analyzing Problems Using Metric Correlation
For information on spikes in the performance of metrics, you can use the Problem Analysis page to compare results between the source metric and related metrics. Currently, problem analysis is only available for the following metrics.
-
Server CPU Usage
-
Servlet and JSP - Request Processing Time
To access the Problem Analysis page, follow these steps.
-
In the JBoss Application Server home page from the JBoss Server menu, select Monitoring and then select Performance Summary.
-
From the Performance Summary page, click the name of the metric next to the performance chart.
-
From the window that pops up, select Problem Analysis.
-
On the Problem Analysis page, you can compare the results of the Source Metric and the Related Metrics.
35.7 Monitoring JBoss Domains
This section covers the following:
35.7.1 Monitoring JBoss Domains
To monitor JBoss Domains, follow these steps:
-
From the Targets menu, select Middleware.
-
On the Middleware page, click the desired JBoss Domain.
-
On the JBoss Domain Home page, you can do the following:
-
View a summary of the most critical information pertaining to the JBoss Domain.
-
Monitor the status and availability of all the members within the JBoss Domain.
-
View the incidents reported on the domain.
-
Using the JBoss Domain Home page, you can monitor the individual status of each of the members and also refresh the domain to update the membership and reflect the current deployment state. You can also view the member application servers' resource usage, availability, performance, configuration information, and reports with or without historical data.
The JBoss Domain Home page has the following sections:
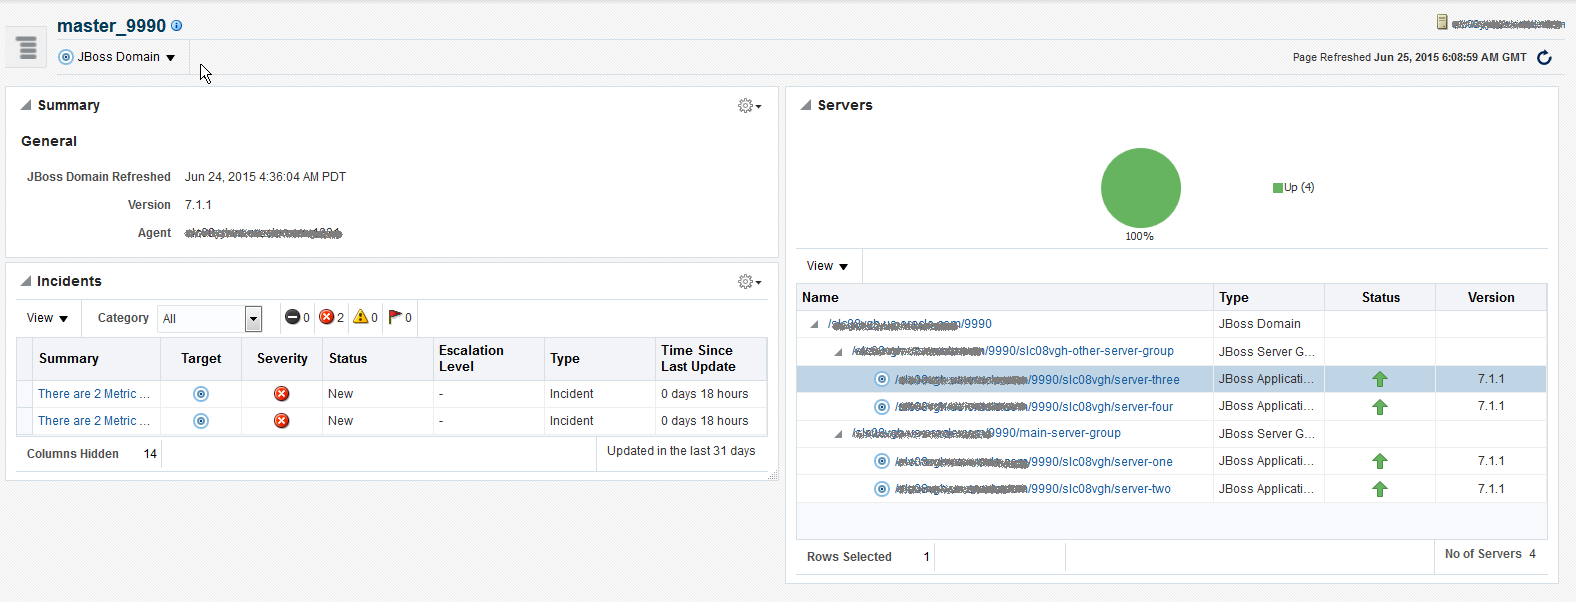
35.7.1.1 Summary Section
The General sub-section under the Summary section provides general information about JBoss Domain.
| Element | Description |
|---|---|
| JBoss Domain Refreshed | Indicates the time and date when the JBoss Domain was last refreshed. |
| Version | Version of the JBoss Domain. |
| Agent | Management Agent used for discovering the JBoss Application Servers that are part of the JBoss Domain. To drill down to the Management Agent home page, click the link. |
35.7.1.2 Servers Section
The Servers section provides a real-time view of the status and availability of all the members within the JBoss Domain. For example, if there are four JBoss Application Servers within a JBoss Domain, and if three of these are up, then the pie chart shows 75% up and 25% down status. Accordingly, the legend shows 3 against the Up status to indicate the JBoss Application Servers that are up, and 1 against the Down status to indicate the server that is down.
The table provides the complete hierarchy of the JBoss Domain. You can drill down and view information about a JBoss Server Group or a JBoss Application Server, by clicking on it. To view more information about the status, click the status icon.
35.7.1.3 Incidents Section
The Incidents section provides a summary of all the incidents reported on the domain. Use the View menu to sort, filter and organize the Incidents table. Click the incident for further information related to each incident.
Switch between Current Target and Hardware Targets tabs to view the related incidents.
35.7.2 Monitoring JBoss Server Groups
To monitor JBoss Domains, follow these steps:
-
From the Targets menu, select Middleware.
-
On the Middleware page, click the pointer before the JBoss Domain to see the Server Groups under it.
-
Click the desired Server Group to open the Server Group Home page.
-
On the JBoss Server Group Home page, you can do the following:
-
View a summary of the most critical information pertaining to the JBoss Server Group.
-
Monitor the status and availability of all the members within the JBoss Server Group.
-
View the incidents reported on the Server Group.
-
Using the JBoss Server Group Home page, you can monitor the individual status of each of the members and see the current deployment state. You can also view the member application servers' resource usage, availability, performance, configuration information, and reports with or without historical data.
The JBoss Server Group Home page has the following sections:
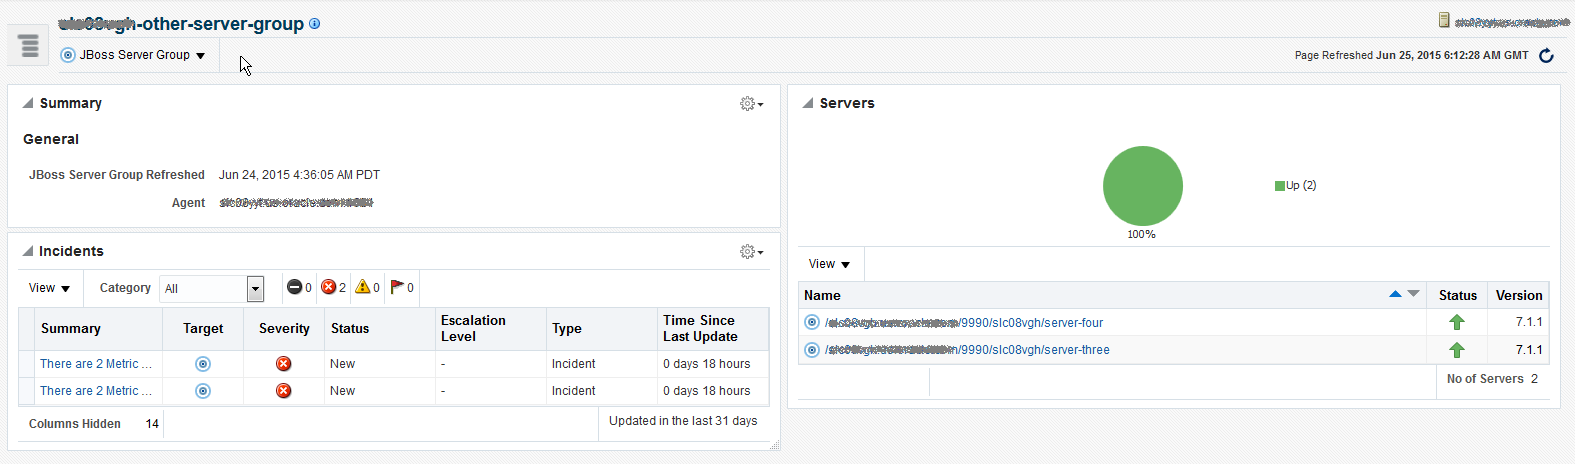
35.7.2.1 Summary Section
The General sub-section under the Summary section provides general information about JBoss Server Group.
| Element | Description |
|---|---|
| Agent | Management Agent used for discovering the JBoss Application Servers that are part of the JBoss Server Group. To drill down to the Management Agent home page, click the link. |
35.7.2.2 Servers Section
The Servers section provides a real-time view of the status and availability of all the members within the JBoss Server Group. For example, if there are four JBoss Application Servers within a JBoss Server Group, and if three of these are up, then the pie chart shows 75% up and 25% down status. Accordingly, the legend shows 3 against the Up status to indicate the JBoss Application Servers that are up, and 1 against the Down status to indicate the server that is down.
The table provides high-level details of the JBoss Application Servers that are part of the JBoss Server Group. To drill down and view information about a JBoss Application Server, click the JBoss Application Server name. To view more information about the status, click the status icon.
35.7.2.3 Incidents Section
The Incidents section provides a summary of all the incidents reported on the Server Group. Use the View menu to sort, filter and organize the Incidents table. Click the incident for further information related to each incident.
Switch between Current Target and Hardware Targets tabs to view the related incidents.
35.7.3 Administering JBoss Domains
To administer JBoss Domains, follow these steps:
-
From the Targets menu, click Middleware.
-
On the Middleware page, click the desired JBoss Domain target.
-
On the JBoss Domain home page, you can view high-level information pertaining to the selected JBoss Domain.
To perform administrative tasks on the JBoss Domain, from the JBoss Domain menu, select any of the following according to your needs:
-
Monitoring, to monitor the performance of the target, view metric details, view status information, view incidents and alerts raised so far for the target, and view blackouts and brownouts created for the target.
-
Control, to create or end blackouts and brownouts.
-
Members, to view details of the JBoss Application Servers that are part of the JBoss Domain.
-
Refresh JBoss Domain, to refresh the JBoss Domain and to add any new JBoss Application Servers added to the domain.
-
Configuration, to search, view, and compare configuration details.
-
Compliance, to view and create compliance standards.
-
Target Setup, to view monitoring configuration details and target properties, to remove the target or add it to a group.
-
Target Sitemap, to view the overall topology of the target.
-
Target Information, to view general information about the target.
-
35.7.4 Viewing JBoss Domain Members
Enterprise Manager Cloud Control helps you view the members of a JBoss Domain. You can see what type of members form the domain, monitor their status, and perform various administrative operations
To view a list of members, follow these steps:
-
From the Targets menu, click Middleware.
-
On the Middleware page, click the desired JBoss Domain target.
-
On the JBoss Domain Home page, from the JBoss Domain menu, select Members, then select Show All to see the following details.
| Column | Description |
|---|---|
| Name | Name of the JBoss Application Server that is part of the JBoss Domain. Click the name to access the home page of that JBoss Application Server. |
| Type | Type of the member. |
| Status | Current status of the member. Click the status icon to see a consolidated availability summary. You can see the current and past availability status within the last 24 hours, 7 days, or month (31 days). |
| Incidents | Number of critical, warning, and error alerts generated for the past 24 hours. Click the alert links to drill down and see more detailed information. |
To search for a particular member, use the Search menu.
By default, all members of the JBoss Partition are listed in the table. To refresh the table and view only a particular type of members, select either Direct Members or Indirect Members from the View section.
To capture the membership configuration details in a spreadsheet, click Export.
35.7.5 Refreshing JBoss Domains
Enterprise Manager Cloud Control allows you to refresh the membership of a JBoss Domain so that it can reflect the current deployment state. This helps you add additional JBoss Application Servers to the existing JBoss Domain.
To refresh a JBoss Domain, follow these steps:
-
From the Targets menu, click Middleware.
-
On the Middleware page, click the desired JBoss Domain target.
-
On the JBoss Domain Home page, click the JBoss Domain menu and select Refresh JBoss Domain.
Enterprise Manager Cloud Control takes you to the Refresh Domain home page.
-
Select the JBoss Application Servers you want to add and click Submit.
35.8 Monitoring JBoss Partitions
This section covers the following:
35.8.1 Monitoring JBoss Partitions
To monitor JBoss Partitions, follow these steps:
-
From the Targets menu, select Middleware.
-
On the Middleware page, click the desired JBoss Partition.
-
On the JBoss Partition Home page, you can do the following:
-
View a summary of the most critical information pertaining to the JBoss Partition.
-
Monitor the status and availability of all the members within the JBoss Partition.
-
View the incidents reported on the partition.
-
Using the JBoss Partition Home page, you can not only monitor the collective status of the partition but also the individual status of each of the members. You can also refresh the partition to update the membership and reflect the current deployment state. You can also view the member application servers' resource usage, availability, performance, configuration information, and reports with or without historical data.
The JBoss Partition Home page has the following sections:
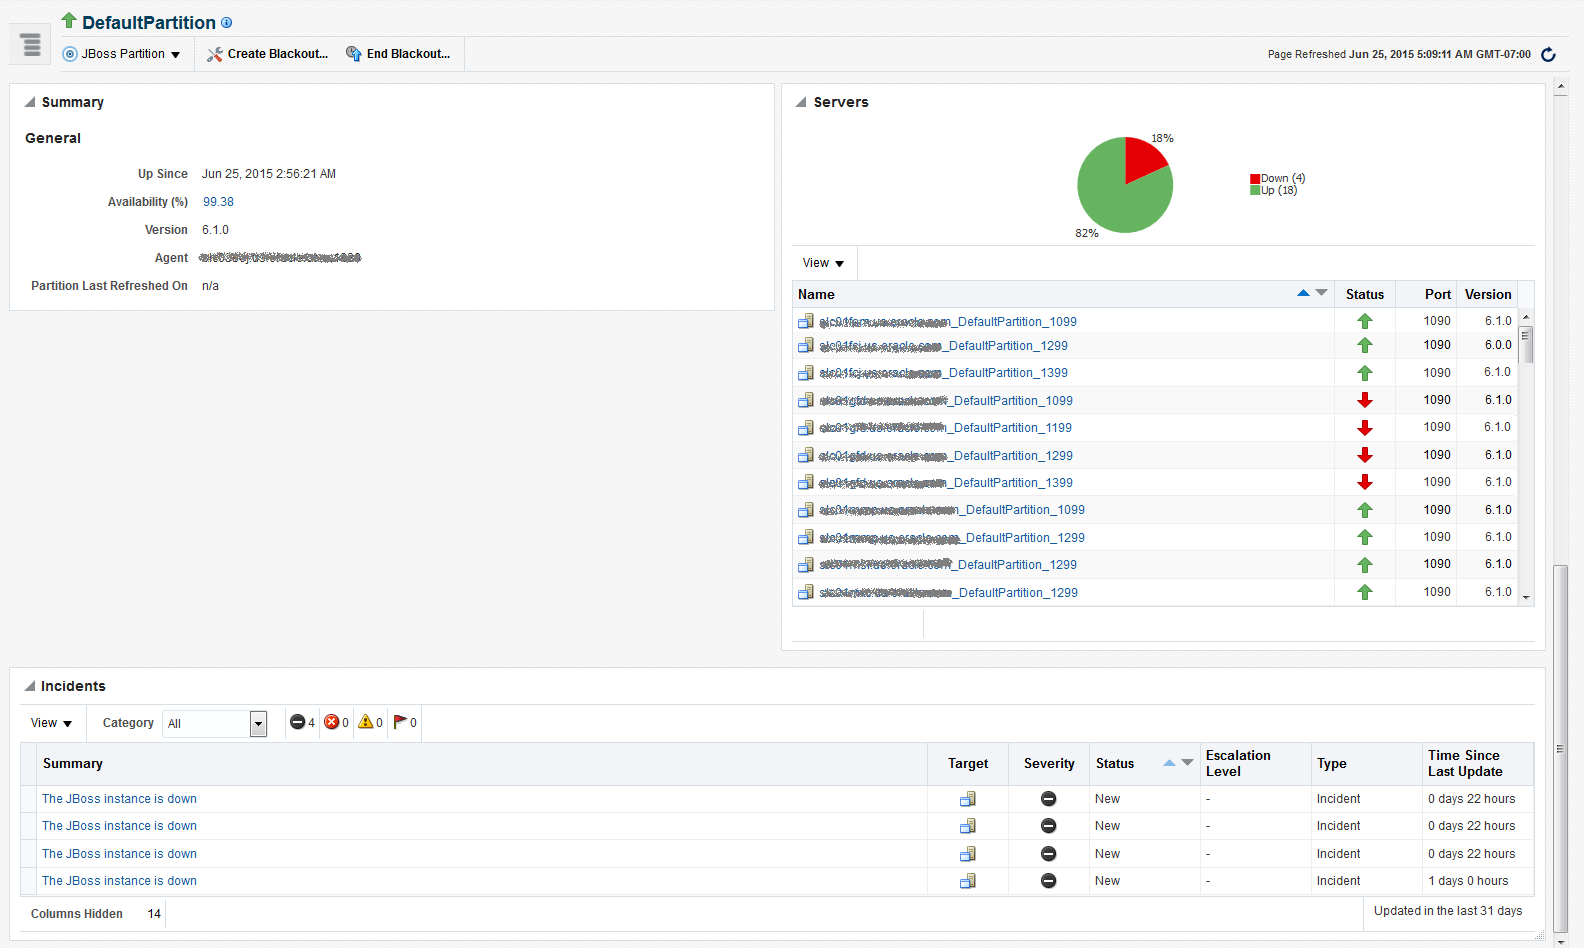
35.8.1.1 Summary Section
The General sub-section in the Summary section provides general information about JBoss Partition.
| Element | Description |
|---|---|
| Up/Down/Pending Since | Date and time when the status was last determined. |
| Availability (%) | Availability rate for the last 24 hours, considering the status of all the members of the JBoss Partition. For example, if there are four JBoss Application Servers within a partition, and if only three of them are up, then the pie chart shows 75% up and 25% down status. |
| Version | Version of the JBoss Application Servers that are part of the JBoss Partition. |
| Agent | Management Agent used for discovering the JBoss Application Servers that are part of the JBoss Partition. To drill down to the Management Agent home page, click the link. |
| Partition Last Refreshed On | Date and time when the partition was last refreshed. |
35.8.1.2 Servers Section
The Servers section provides a real-time view of the status and availability of all the members within the JBoss Partition. For example, if there are four JBoss Application Servers within a JBoss Partition, and if three of these are up, then the pie chart shows 75% up and 25% down status. Accordingly, the legend shows 3 against the Up status to indicate the JBoss Application Servers that are up, and 1 against the Down status to indicate the server that is down.
The table provides high-level details of the JBoss Application Servers that are part of the JBoss Partition. To drill down and view information about a JBoss Application Server, click the JBoss Application Server name. To view more information about the status, click the status icon.
35.8.1.3 Incidents Section
The Incidents section provides a summary of all the incidents reported on the partition. Use the View menu to sort, filter and organize the Incidents table. Click the incident for further information related to each incident.
35.8.2 Administering JBoss Partitions
To administer JBoss Partitions, follow these steps:
-
From the Targets menu, click Middleware.
-
On the Middleware page, click the desired JBoss Partition target.
-
On the JBoss Partition home page, you can view high-level information pertaining to the selected JBoss Partition.
To perform administrative tasks on the JBoss Partition, from the JBoss Partition menu, select any of the following according to your needs:
-
Monitoring, to monitor the performance of the target, view metric details, view status information, view incidents and alerts raised so far for the target, and view blackouts and brownouts created for the target.
-
Diagnostics, to analyze and diagnose performance issues.
-
Control, to create or end blackouts and brownouts.
-
Information Publisher Reports, to view reports.
-
Members, to view details of the JBoss Application Servers that are part of the JBoss Partition.
-
Refresh JBoss Partition, to refresh the JBoss Partition and to add any new JBoss Application Servers added to the partition.
-
Configuration, to search, view, and compare configuration details.
-
Compliance, to view and create compliance standards.
-
Target Setup, to view monitoring configuration details and target properties, to remove the target or add it to a group, to migrate and use JMX.
-
Target Sitemap, to view the overall topology of the target.
-
Target Information, to view general information about the target.
-
35.8.3 Viewing JBoss Partition Members
Enterprise Manager Cloud Control helps you view the members of a JBoss Partition. You can see what type of members form the partition, monitor their status, and perform various administrative operations
To view a list of members, follow these steps:
-
From the Targets menu, click Middleware.
-
On the Middleware page, click the desired JBoss Partition target.
-
On the JBoss Partition Home page, from the JBoss Partition menu, select Members, then select Show All to view the following details of the members.
Column Description Name Name of the JBoss Application Server that is part of the JBoss Partition. Click the name to access the home page of that JBoss Application Server. Type Type of the member. Status Current status of the member. Click the status icon to see a consolidated availability summary. You can see the current and past availability status within the last 24 hours, 7 days, or month (31 days). Incidents Number of critical, warning, and error alerts generated for the past 24 hours. Click the alert links to drill down and see more detailed information. To search for a particular member, use the Search menu.
By default, all members of the JBoss Partition are listed in the table. To refresh the table and view only a particular type of members, select either Direct Members or Indirect Members from the View section.
To capture the membership configuration details in a spreadsheet, click Export.
35.8.4 Refreshing JBoss Partitions
Enterprise Manager Cloud Control allows you to refresh the membership of a JBoss Partition so that it can reflect the current deployment state. This helps you add additional JBoss Application Servers to the existing JBoss Partition.
To refresh a JBoss Partition, follow these steps:
-
From the Targets menu, click Middleware.
-
On the Middleware page, click the desired JBoss Partition target.
-
On the JBoss Partition home page, click the JBoss Partition menu and select Refresh JBoss Partition.
Enterprise Manager Cloud Control takes you to the Refresh Partition page.
-
On the Refresh Partition page, select the JBoss Application Servers that should be added to the JBoss Partition, and click Submit.
35.9 Deploying JVMD on JBoss Application Server 7.x and 6.x to Diagnose Issues
Oracle Enterprise Manager Cloud Control 13c's JVM Diagnostics enables administrators to diagnose performance problems in a Java application in the production environment. By eliminating the need to reproduce problems, it reduces the time required to resolve these problems. This improves application availability and performance. The correlation between the JBoss target and the JVMD/JVM target enables administrators to navigate to the JVM in context of a JBoss Application Server.
To deploy JBoss on JVMD, complete the following:
-
From the Setup menu, select Middleware Management, then select Application Performance Management.
-
On the Application Performance Management page, select JVM Diagnostic Engines, and then click Configure.
-
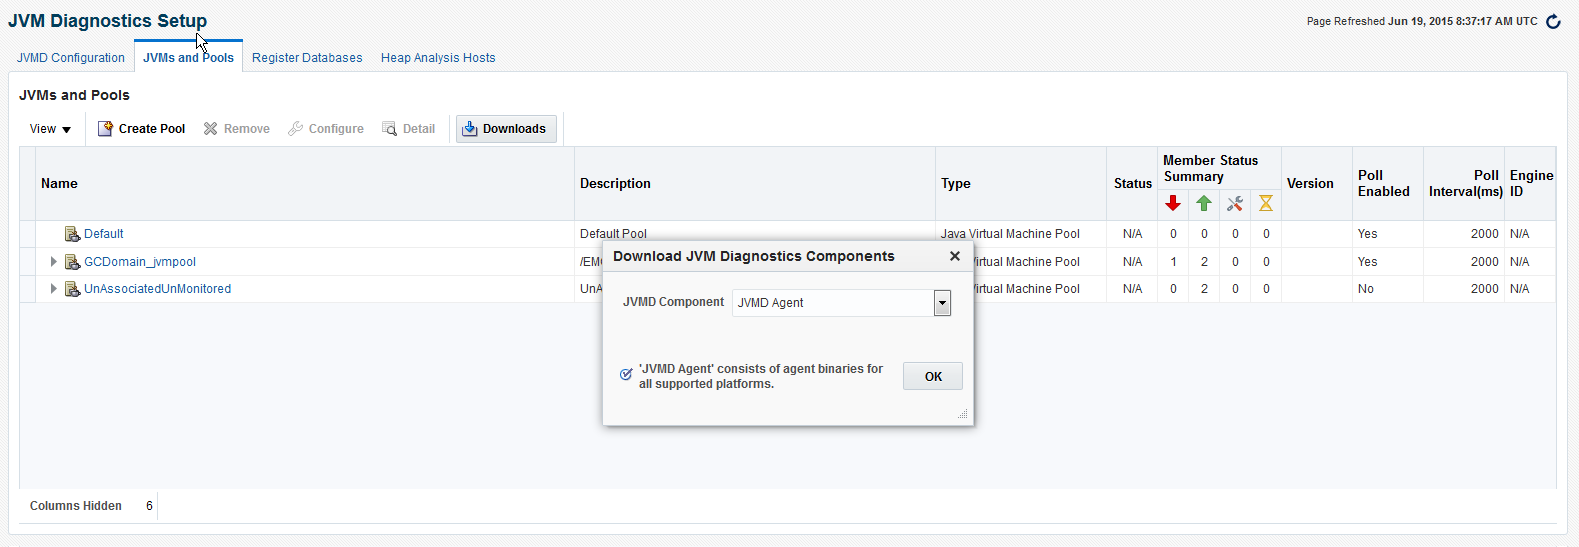
From the JVMs and Pools tab, click Downloads.
-
From the Download JVM Diagnostics Components window, select JVMD Agent, then click OK.
-
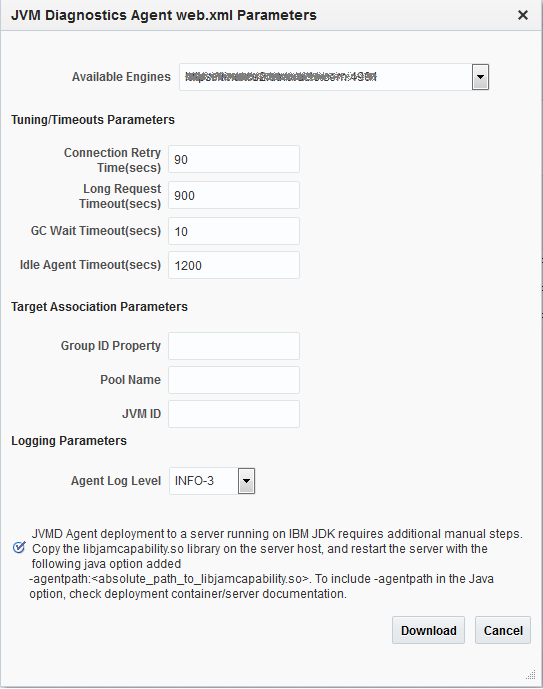
From the JVM Diagnostics Agent web.xml Parameters window, select the appropriate JVMD manager from the Available Managers list.
-
Uncheck the WebLogic Server checkbox, enter a pool name, then click Download.
This will download the jamagent.war file. You need to copy this file to the target machine (the machine the JBoss is running).
-
Copy the script contained at the following location to the same location on the target machine where the jamagent.war. file was copied:
https://stbeehive.oracle.com/content/dav/st/NonOracle%20MW/Public%20Documents/makeJAMagents.sh
-
Run the script passing the names of the JBoss instances (or whatever names you give to the JVM of each JBoss server). The name has to be unique for each server.
This script will create a separate jamagent WAR for each name you pass to this script.
-
Deploy each of these created WARs on the respective JBoss server. Typically you can use the admin console or copy the WAR file to the deploy folder.
If the hot deployment is not enabled, you may have to restart the JBoss server. Once the WAR is deployed successfully, you will see the respective JVM target on the Middleware page.
35.10 Troubleshooting JBoss Application Server Discovery and Monitoring Issues
This section provides troubleshooting tips for the issues encountered while discovering or monitoring JBoss Application Servers.
35.10.1 Troubleshooting Monitoring Issues
-
If the target status is DOWN after discovery, check the Monitoring properties page for the JBoss Application Server and verify the following:
-
Local discovery: only JBoss home is present
-
Remote discovery: only Library path is present
-
-
If the target status is PENDING (due to a metric collection error) after discovery, ensure that no other application server is being monitored using the same Management Agent (such as Weblogic).
The following are the various log locations:
-
JBoss server logs:
$JBOSS_HOME/server/<config_mode>/log -
OMS logs:
emoms.trc(under$OMS_HOME) -
Agent logs:
$AGENT_STATE_DIR/sysman/log
-
35.10.2 Troubleshooting Discovery Issues
In the case of JBoss discovery failure, provide the library path along with the install home and try again.
For discovery related issues, manually run the discovery script to check the output, which should look similar to the following:
java -Doracle.home=<AGENT_PLUGIN_LOCATION> \
 -cp \
<AGENT_PLUGIN_LOCATION>/lib/xmlparserv2.jar:\
<AGENT_PLUGIN_LOCATION>/jlib/emConfigInstall.jar:\
<AGENT_PLUGIN_LOCATION>/sysman/jlib/log4j-core.jar:\
<AGENT_PLUGIN_LOCATION>/modules/oracle.http_client 11.1.1.jar:\
<DISCOVERY_PLUGIN_LOCATION>/archives/em-as-thirdparty-discovery.jar \
   oracle.sysman.emas.thirdparty.discovery.jboss.JBossDiscovery \
   <JMX_PORT> <SERVER_HOST> ""
35.10.3 Additional Useful Resources
Useful troubleshooting information can also be found by checking the following:
-
Monitoring Configuration page
-
Targets.xml on the agent
-
OMS and Agent logs
-
Agent metric browser
-
JBoss JMX Console
-
JConsole
-
JBoss server logs