3 Working With the Data Browser
This chapter explains the use of the Data Browser. This is at the heart of RUEI, and provides direct access to the information gathered during monitoring. Through it, you can drill down, search, and filter information in an intuitive and user-friendly manner.
3.1 Introducing the Data Browser
The information shown in each report is derived from a multi-dimensional data structure that contains all the information captured during monitoring. Through this structure, you can explore Web data by simply clicking down through increasing levels of detail, and view by different dimensions (such as period, referrer, visitor type, and so on). This data structure can be viewed through the Browse data tab.
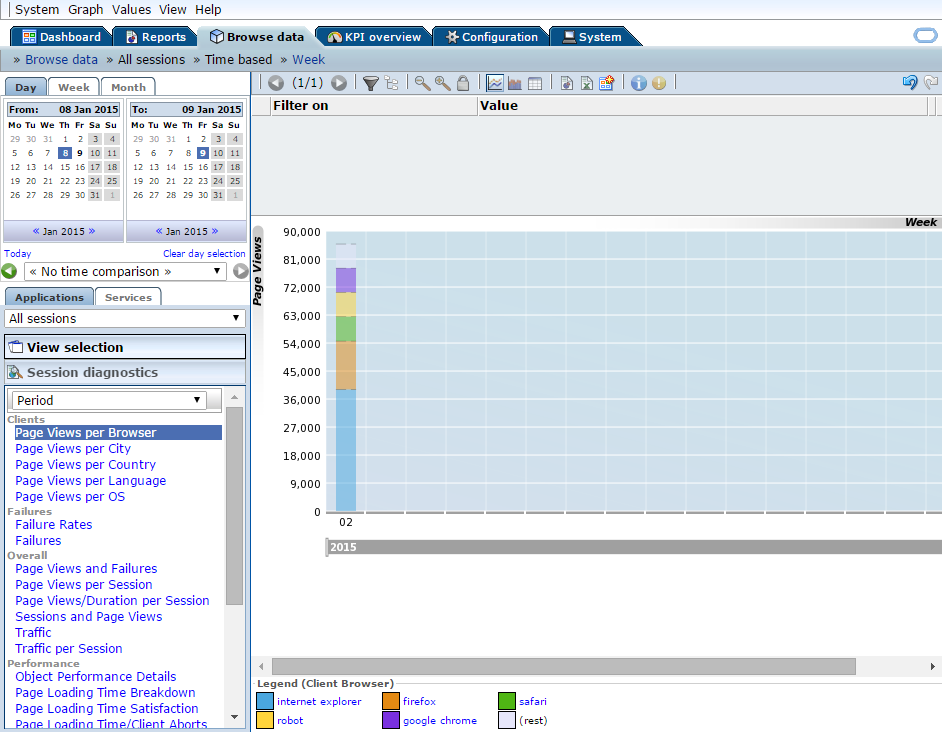
You can use the Data Browser to understand the context of the data shown in a report, and to drill down, rank, sort, and filter information to gain insight into causes, effects, and trends. To open the Data Browser from within a report, select the Browse option from the report menu. To open the Data Browser from elsewhere, click the Browse data tab. A window similar to one shown in Figure 3-1 appears.
The Data Browser Toolbar
The toolbar icons at the top of the Data Browser screen are shown in Figure 3-2, and are described in Table 3-1.
| Icon | Description |
|---|---|
|
Graph. Displays the standard graphic visualization (pie chart, line chart, or bar chart) for the data. The graphic form depends on the underlying data. |
|
|
Edit Filters. Opens a new window where you can edit filters. |
|
|
Hierarchy View. Controls the way the view dimension (used for zooming in/out to different levels of detail) is presented within the report. When disabled (default), only the active level of detail within the dimension is shown. When enabled, all levels up to the active (zoom) level are shown. For more information, see Section 3.6, "Hierarchy View". |
|
|
Additional visualizations. In addition to the standard graphical visualization, depending on the underlying data, additional visualizations may be available, and can be selected by clicking the appropriate icon. You can also use the Type option from the Graph menu to select a visualization. |
|
|
Values. Shows the underlying data values for the data in the browser. See Section 3.4, "Working With Value Lists" for more information about working with value lists. |
|
|
Previous and Next page. Use these controls to move between pages in the displayed data set. |
|
|
Glossary. Provides a brief explanation of the metrics currently shown within the Data Browser. This includes both the dimensions shown in the graph or values table, and any filters that have been applied to it. The use of filters is explained in Section 3.9, "Working With Filters". |
|
|
Search. Allows you to search for strings within in the currently displayed data set. The use of the search facility is described in Section 3.5, "Searching in the Data Browser". |
|
|
Zoom in and Zoom out. Allows you to change the level of displayed detail. When zooming in and out, you change the dimension of the viewed data. The new dimension depends on the currently selected dimension. For example, if you are viewing yearly data, zooming in will change the view to a monthly one. If you are viewing client location by country, zooming in will change the displayed dimension to providers within the client location country. To quickly return to the original dimension, select Reset view from the View menu. |
|
|
Open as report. Opens a new window with the currently shown data in report print layout mode. The creation and customization of reports is described in Chapter 2, "Working With Reports." |
|
|
Open as export. Opens a new window in which you can further customize the currently shown data prior to exporting it to a wide variety of applications (such as Microsoft Excel). This facility is described in Section 3.11, "Exporting Data". |
|
|
Add to dashboard. Adds the current view to a selected dashboard. This facility is described in Section 5.5, "Adding a Data Browser or KPI View to a Dashboard". |
|
|
Back/Forward. Undoes or redoes your most recent actions within the Data Browser. |
|
|
Lock/Unlock zoom. Locks/unlocks the view level so that you can query using a dimension level value that is not available at a higher level of aggregation. For example, when working at a daily level, you set a filter based on full URL. Normally, this filter would be automatically dropped when you zoom out to monthly level because this information is not available at monthly level. But, when Zoom lock is set, 30 daily levels are queried using the defined filter instead of one month level. |
|
|
Save customized view. Saves a customized view so that all users can view the customized view from the data browser. This facility is described in Section 3.13, "Customizing Browser Views". |
3.2 Understanding the Data Structure
The information available within the Data Browser is divided across groups. At the highest level, there are two types of groups: application-related groups and services-related groups. Each group provides a number of perspectives, or views, on the collected data. These views can be selected from the View selection panel, located on the left-hand side of the Data Browser window (Figure 3-1).
Each main group within the View selection panel relates to a broad category of information. There are groups available about the pages visited on the monitored web environment, visitor sessions, user flows, failed URLs and pages, and key pages.
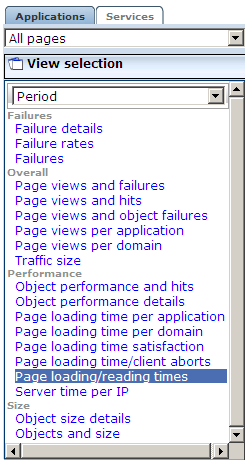
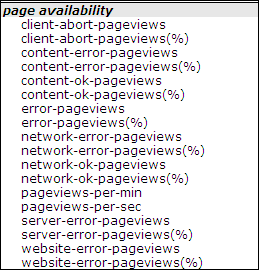
Within each of these groups, sub-groups offer information about a specific aspect of the selected category. More specifically, they offer information across specific dimensions. These dimensions are indicated in the name of the sub-group. For example, within the All sessions group, views are available across the dimensions domain, period, user ID, client browser, language, location, and operating system. This is shown in Figure 3-3.
Figure 3-3 Data Structure Selection Panel
Description of ''Figure 3-3 Data Structure Selection Panel''
Individual views are grouped according to a standard classification (failure, performance, overall, and size) that reflects the type of information they provide. Within these, you can select the active dimension you want to use to explore the underlying data.
In addition to the standard dimensions discussed in this section, it is also possible to extend the information available within the Data Browser through the use of custom dimensions. These are described in Section 3.12, "Working With Custom Dimensions".
The session diagnostics feature is described in Chapter 4, "Working With the Session Diagnostics Feature".
3.2.1 Real-Time and Session-Based Data
Within RUEI, two types of information are available: information derived from all active sessions detected during a 5-minute period, and information derived from finished (closed) sessions. Each of these are described in the following sections.
Active Sessions-Derived Information
Nearly all information reported in RUEI is based on the open (active) sessions detected within a 5-minute period. There is one exception to this: the reporting of multiple-day periods within the All sessions group. This is discussed in the next session.
Be aware that the properties reported for a session within the 5-minute period, such as IP address and user ID, are effectively snapshots taken at the end of the 5-minute period. While the value of these properties can potentially change during the 5-minute period, it is their values at the end of the period that are reported.
Closed Sessions-Derived Information
Information reported for multiple-day periods within the All sessions group is derived from finished (closed) sessions. As a result, this information has a delay associated with it. The delay arises from the defined session idle time. This specifies the period of inactivity after which a visitor session is regarded as terminated. By default, this is 60 minutes.
As a result of how this information is derived, it is not possible to drill-down to the level of 5-minute intervals. In addition, imagine a visitor session starting at 9 AM, and finishing at 5 PM. The session is active throughout the day, except for lunch, from 12 AM to 1 PM. This session would normally be reported as one session. However, multiple-day periods within the All sessions group would be reported as two sessions because of the inactive period.
Why are There Sometimes Differences in Reported Data?
It is possible that small differences arise between the data reported for a single-day period and a multiple-day period. For example, the number of reported sessions in the All sessions view for a day may be slightly different to that reported for the same day when viewed within a two-day period in the All sessions view. In order to understand why these differences arise, it is necessary to understand how data for a single day and for a multiple-day period is processed.
Consider the situation shown in Figure 3-4. Two visitors, A and B, both start browsing at 12:05. A's session ends at 12:45, while B's session ends at 13:55. Visitor A returns at 14:05, and leaves at 14:55.
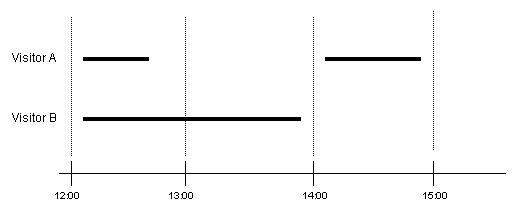
On a hourly level, the number of concurrent visitor sessions is reported as shown in Table 3-2.
Table 3-2 Hour-Level Reporting
| Hour | Sessions |
|---|---|
|
12:00 |
2 (during 12-13 there two unique visitors seen). |
|
13:00 |
1 (during 13-14 there was one unique visitor seen). |
|
14:00 |
1 (during 14-15 there was one unique visitor seen). |
On a daily level, two concurrent sessions would be reported. However, when viewed on the monthly or two-day level, the number of sessions is reported. In this case, because of the elapsed idle time between A's two sessions, that is reported as three. In order to prevent differences between the number of reported sessions, you should ensure that the specified session idle time matches that of the monitored application.
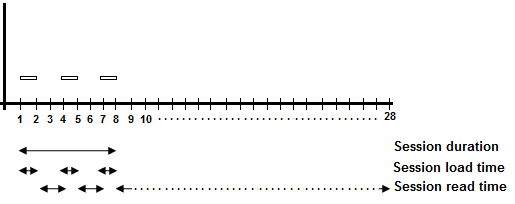
Understanding Session Duration, Page Load and Read Times
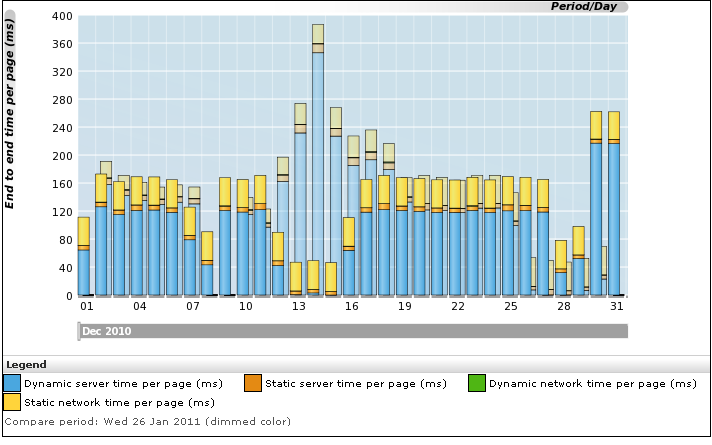
Be aware that session duration is calculated and reported as the time when the last page was loaded within the session minus the time of starting to load the first page. The session loading time represents the sum of all page loading times within a session. The session reading time is the sum of all page reading times within a session. Each individual page reading time is calculated as the difference between when the last hit on it was loaded and the start of the first hit on the next page. In the case that there is no next page in the session, a default of 20 seconds is assumed. Note that in the case of short sessions, this means that the reported page read time can be longer that the session duration. Consider the example shown in Figure 3-5.
User Flows
For an explanation of user flows, see Section 9.1, "Understanding User Flows". Flows are tracked in a manner similar to sessions, simultaneous multiple flows are supported and you can view reports on active and completed flows. Completed flows can result from the user completing the last step of the flow, aborting the flow, or as a result of the session timing out. If flow report data is not what you expected, consider the following:
-
If 2 identical flows are defined with different step idle settings, the reported flow-duration and flow-idle-time will differ despite the user behaviour being identical for both flows.
-
If users typically spend a lot of time on a particular step and step idle setting is low, you will see lots of step-idle time associated with the step. Increasing the step idle setting would provide more accurate results regarding user behaviour.
-
During the step idle time the user might close the browser (or other behaviour), but the data in RUEI will show this period as active time.
3.2.2 Problem Analysis Groups
The Problem analysis category of views (shown in Table 3-4) provides, for applications, in-depth information about failing or problematic page views and hits. It contains the groups shown in Table 3-3.
Table 3-3 Problem Analysis Groups
| Name | Description |
|---|---|
|
Service tests |
Reports on Services traffic in relation with real end user traffic. For more information, see Section 7.3.7, "Reporting Service Test Beacon Traffic". |
|
URL diagnostics |
Reports on specific URLs. For more information, see Section 3.2.4, "URL Diagnostics for Problem Analysis". |
|
Failed URLs |
Reports on the objects (hits) within failed pages. For example, those pages that contain broken images and unavailable downloads. Note that it logs a maximum of 1000 objects per 1-minute period. All technical errors (described in Appendix D, "Explanation of Failure Codes") for that object are reported. Because this view does not use application information, it can still report possible reasons for failed pages when no applications have been configured. |
|
Failed pages |
Reports on the server, network, web site, and content errors experienced with application pages. |
|
Slow URLs |
Reports on the slowest 1000 objects per minute detected by the system, based on the object's end-to-end time. Note that objects must have an end-to-end time of at least the configured slow URL threshold (by default, 2000 milliseconds) to be reported in this view. Applications do not need to be configured for this view. For more information, see Section 12.5, "Controlling Slow URL and Function Call Reporting". |
|
Failed functions |
Reports on the server, network, web site, and content errors experienced with function calls. |
|
Slow functions |
Reports on the slowest 1000 objects per minute detected by the system, based on the call's end-to-end time. Note that the calls must have an end-to-end time of at least the configured slow URL threshold (by default, 2000 milliseconds) to be reported in this view. Services do not need to configured for this view. For more information, see Section 12.5, "Controlling Slow URL and Function Call Reporting". |
|
Suite URL Diagnostics |
For more information on suite URL diagnostics and and how these data groups are not created, see Section 3.2.5, "Suite URL Diagnostics for Problem Analysis". |
Note:
The period for which information about failed URLs, pages, and service calls is available is determined by the Reporter's data retention policies. These are described in Section 12.10.1, "Defining Reporter Retention Policies".The procedure for configuring external utilities for clickout from within RUEI is described in Section 4.6, "Configuring Clickouts to External Tools".
3.2.3 Page Delivery Dimension
The page delivery dimension is available within the Failed pages, All pages, Key pages views, and reports which errors have been detected on a monitored web site. All errors reported in the page delivery dimension are also available through the Session diagnostics replay facility (see Chapter 4, "Working With the Session Diagnostics Feature").
Note if a page or object experienced several types of errors (for example, both a network and a web service error), the page or object error is not recorded multiple times. Instead, it is reported according to the following order: web site, server, network, and content. For example, an object that experienced both a web site and a network error, is recorded as a web site error rather than a network error.
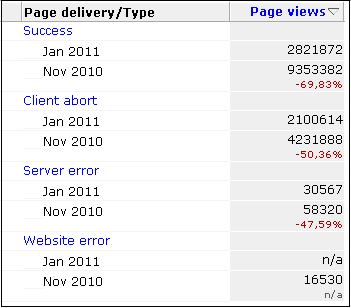
The errors reported in this dimension are also available as the basis for KPIs as metrics expressed both as counters and percentages. This is shown in Figure 3-6.
Application and User Violations
The application violation counter reports the total number of web site, network, server, and content errors. The user violation counter reports the total number of content notifications and client aborts. An example of the possible use of these counters would be the creation of dashboards to track the general health of specific applications. These counters are also available for use as KPI metrics. Note that specific page views can contain both application and user violations.
3.2.4 URL Diagnostics for Problem Analysis
The URL diagnostics group is specifically orientated towards the separate recording of dynamic objects within pages (such as portlets and frames). Instead of reporting the literal URLs associated with particular hits, the URL diagnostics group reports functional URLs. These are customizable reporting schemes where session and unique information is typically stripped from the reported URLs.
Note:
Data gathered in the URL Diagnostics group is not available to other groups, for example Failed URLs and Slow URLs.The information available within this group enables you to access dynamic server-interacting URLs independently of pages. This approach has the advantage that relevant hit-based information is more quickly located. For example, you could specify that you are only interested in the monitoring of Java or PHP-based calls. This is supplemented by a powerful clickout facility that provides dedicated support for diagnostic utilities, such as CAMM and AD4J.
The configuration of URL diagnostics is specified at application and suite level, and is described in Section 7.3.21, "Controlling Reporting Within the Problem Analysis Group" and Section 3.2.5, "Suite URL Diagnostics for Problem Analysis".
3.2.5 Suite URL Diagnostics for Problem Analysis
The suites category of views (shown in Table 3-4) provides in-depth information about the operation of monitored suites. The availability of individual suite groups depends on at least one suite instance being configured.
For each installed and configured suite type, a diagnostics group can be created that provides for the suite type the equivalent information available for applications through the URL diagnostics group (described in Section 3.2.4, "URL Diagnostics for Problem Analysis").
Note:
Data gathered in the Suite URL Diagnostics group is not available to other groups, for example Failed URLs and Slow URLs.Controlling the Creation of Suite URL Diagnostics Groups
By default, suite URL diagnostics data groups are not created. In order to enable their creation, do the following:
-
Ensure that at least one instance of the required suite type has been has defined.
-
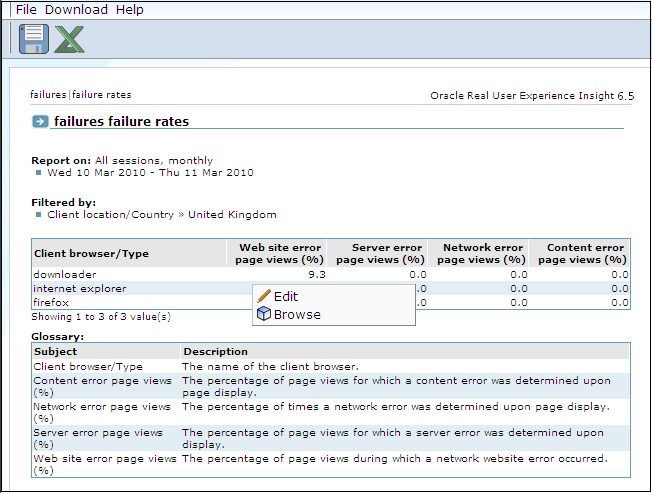
Select Configuration, then General, then Advanced settings, and then Suite URL diagnostics. Click the required suite type. A dialog similar to the one shown in Figure 3-7 appears.
Figure 3-7 E-Business Suite URL Diagnostics Dialog
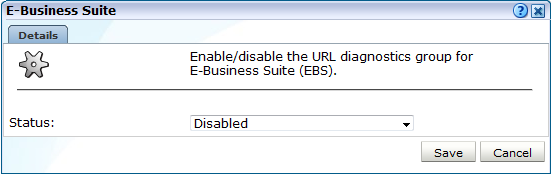
Description of ''Figure 3-7 E-Business Suite URL Diagnostics Dialog''
-
Specify whether reporting to a URL diagnostics group for the selected suite type should be enabled or disabled. By default, it is disabled. When ready, click Save.
Note that the availability of data within an enabled suite URL diagnostics group depends on the defined data retention policies (see Section 12.10, "Specifying Data Retention Policies").
3.3 Access to Data Browser Groups
Each Data Browser group is either Business or IT-related (or both). Access to the Data Browser is only available to users with the relevant Analytical (or higher) access level permission. The user type assignments for each Data Browser group are shown in Table 3-4.
Table 3-4 Data Browser Group User Types
| Category | Group | Business | IT |
|---|---|---|---|
|
Applications |
Overall |
||
|
All pages |
X |
X |
|
|
All sessions |
X |
X |
|
|
User flow completion |
X |
X |
|
|
User flow activity |
X |
X |
|
|
Monitored KPIs |
X |
X |
|
|
ADF Framework |
X |
X |
|
|
Fusion Applications |
X |
X |
|
|
Webcenter |
X |
X |
|
|
E-Business (Forms) |
X |
X |
|
|
Siebel |
X |
X |
|
|
PeopleSoft |
X |
X |
|
|
JD Edwards EnterpriseOne |
X |
X |
|
|
FC Direct Banking |
X |
X |
|
|
FC Universal Banking |
X |
X |
|
|
Weblogic Portal |
X |
X |
|
|
Applications |
Problem analysis |
||
|
Service tests |
X |
X |
|
|
URL diagnostics |
X |
||
|
Failed URLs |
X |
||
|
Failed pages |
X |
X |
|
|
Slow URLs |
X |
||
|
ADF Framework Diagnostics |
X |
||
|
Fusion Applications Diagnostics |
X |
||
|
Webcenter Diagnostics |
X |
||
|
E-Business (Forms) Diagnostics |
X |
||
|
Siebel Diagnostics |
X |
||
|
PeopleSoft Diagnostics |
X |
||
|
JD Edwards EnterpriseOne Diagnostics |
X |
||
|
FC Direct Banking Diagnostics |
X |
||
|
FC Universal Banking Diagnostics |
X |
||
|
WebLogic Portal Diagnostics |
X |
||
|
Services |
Overall |
||
|
All functions |
X |
||
|
Problem analysis |
|||
|
Failed functions |
X |
||
|
Slow functions |
X |
3.4 Working With Value Lists
When working with value lists, you can add additional columns to the displayed list. Select Show percentage or Show growth from the Values menu to add indicator columns to the displayed data. Note that availability of these options depends on the currently viewed list, and the columns are also carried forward when you view the list as a report (by selecting Open as report from the View menu).
Changing the Sort Order
You can also change the sort order by selecting a column header at the top of the Values list. The view changes to reflect the selected column sorted in ascending order. Click it again, and the sort order becomes descending. The order symbol within a column heading indicates the current order. An example is shown in Figure 3-8.
Inclusive and Exclusive Filters
Within value lists, you can also right click items to open the context menu shown in Figure 3-9.
The following options are available:
-
Select value: adds the selected value as an inclusive filter to the Filters panel. That is, only values that match the selected value are displayed in the browser.
-
Exclude value: adds the selected value as an exclusive filter to the filters panel. That is, only values not matching the selected value are displayed in the browser.
3.5 Searching in the Data Browser
You can use the Search facility to locate the incidence of strings in the currently displayed data set. This is shown in Figure 3-10.
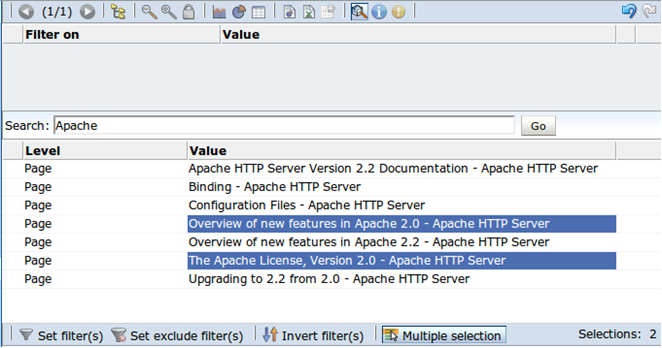
The search facility will try to match any search pattern you specify either as a full match or as a substring. Hence, the search pattern "fire" will match the occurrences of "firefox", "x-fire", and "sefirewall", as well as, of course, all occurrences "fire".
You can then filter the data using one or more results by clicking the Multiple section command button, and then clicking each required results.
After selecting the required values, you can use the toolbar at the bottom of the screen to specify whether the values should be inclusive or exclusive filters. You can also use the toolbar to invert all currently defined filters, or to remove them.
As mentioned earlier, the search is restricted to the currently displayed data. To extend the search further, you will need to modify the current view, or remove applied filters, and repeat the search. If the search did not find any matches, a pop-up dialog informs you that "No results were found".
Note:
The search facility does not support the use of wildcard characters (such as *). All characters are treated as literals. The results list is a values list and has the same functionality (see Section 3.4, "Working With Value Lists").3.6 Hierarchy View
The hierarchy view functionality is implemented as a toggle, available within Browse Data, Reports, and Dashboards. It controls the way the view dimension (used for zooming in/out to different levels of detail) is presented within the report.
When disabled (default), only the active level of detail within the dimension is shown. When enabled, all levels up to the active (zoom) level are shown. An example of a report on the Application dimension, zoomed in to the lowest level of detail (Page Name) with hierarchy view disabled is shown below:
The following shows the same report, but now with hierarchy view enabled:
Table 3-6 Application Dimension with Hierarchy View Enabled
| Application | Page Group | Page Name | Page Views |
|---|---|---|---|
|
Twiki |
Home |
index.html |
10 |
|
Twiki |
Services |
index.html |
4 |
|
Twiki |
FAQ |
index.html |
1 |
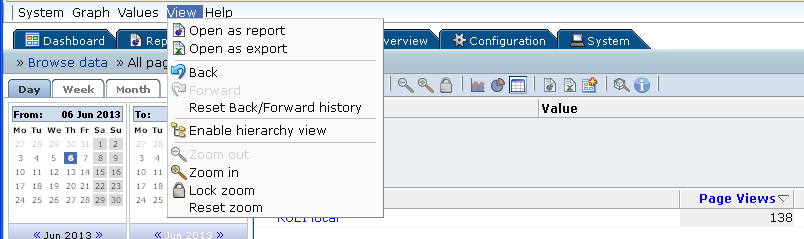
You can enable/disable hierarchy view using the icon on the toolbar or from the View menu, as shown below:
3.7 Sorting Data
To sort data in a graphic visualization, select the corresponding dimension from the legend beneath the graph. This is shown in Figure 3-12.
For information on sorting within a value list, see Section 3.4, "Working With Value Lists".
In addition, you can use the Sorting option within the Data menu to undo any specified sorting specifications (Remove sorting), or swap the current sorting specification (Invert sorting).
3.8 Moving Backwards and Forwards Within the Data Browser
When working within the Data Browser, you can use the Back and Forward icons within the taskbar (see Table 3-1) to move between your previous selections. In this way, you can undo previous actions (such as setting filters) without having to repeat your complete viewing actions. When using this facility, bear in mind the following points:
-
A maximum of 20 actions are remembered.
-
Within the session diagnostics feature, the Exit diagnostics icon returns you to your position within the Data Browser immediately before you entered the session diagnostics feature, and your previous actions are preserved in the selection history.
-
If you leave the Data Browser for another module (for example, the Configuration or Report module), your selection history is preserved on return to the Data Browser.
-
If you use the Back icon to undo a selection, and then perform a new selection, your selection history from that point onwards is discarded.
-
You can select the Reset Back/Forward history option from the View menu to reset the remembered viewing actions.
3.9 Working With Filters
You can use the Filter panel at the top of the Data Browser window to tighten the profile of the information you want to view. An example is shown in Figure 3-13.
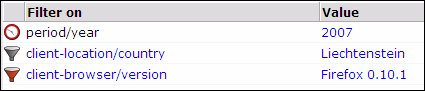
The first item shown in the Filter panel is always the date or period for which information is required. In the example shown in Figure 3-13, this is the year period 2007. This can be thought of as the highest-level filter, and can be changed through the calendar (explained in Section 2.6, "Using the Calendar").
After that, additional filters can be set. There are two kinds of filters: inclusive and exclusive. Inclusion filters specify that only data items that match the data value in the filter should be shown. Exclusive filters specify that only data items that do not match the data value in the filter should be shown.
For example, the filter profile in Figure 3-13 specifies that only information should be displayed for the year 2007 in which the client location was Liechtenstein, and the client browser was not Firefox.
Note that filters on different dimensions will be considered to be part of a logical 'AND' clause, while multiple filters on the same dimension are considered to be part of a logical 'OR' clause. For example, if you create two inclusive client browser filters, one for 'firefox', and one for 'chrome', the filter will pass requests by both Firefox and Chrome browsers.
3.9.1 Defining Filters
You can define any data item within the Data Browser window as a filter by right clicking it to open the menu shown in Figure 3-9. After you have defined a filter, you are free to modify it by clicking it and using the context menu shown in Figure 3-14.
The following options are available:
-
Invert: changes the selected inclusive filter into an exclusive filter, and vice versa.
-
Invert filters(s): inverts (as described above) all currently defined filters.
-
Remove: deletes the selected filter.
Note:
Filters are applied in the order in which you define them. Once defined, it is not possible to change the order in which they appear in the Filter panel. To re-order them, you must remove and redefine them in the required order. -
Mark as report filter: the use of this option is described in Section 3.9, "Working With Filters".
-
Remove all: deletes all current defined filters.
3.9.2 Working With Multiple Filters
Within value lists, you can select multiple values by clicking the Multiple section command button, and then clicking each required value outside of the its associated link. The selected item(s) are then highlighted. An example is shown in Figure 3-17.
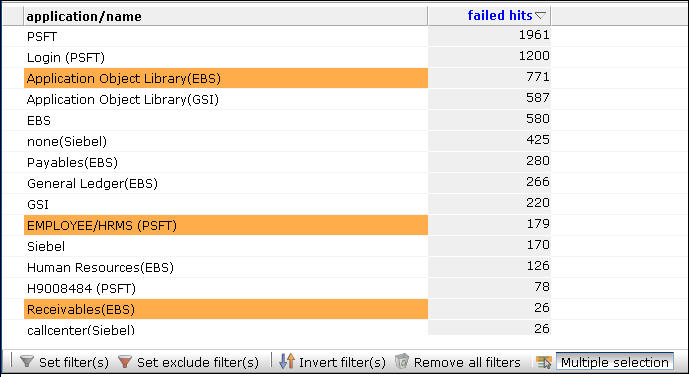
After selecting the required values, you can use the toolbar at the bottom of the screen to specify whether the values should be inclusive or exclusive filters. You can also use the toolbar to invert all currently defined filters, or to remove them.
3.9.3 Using Report Filters
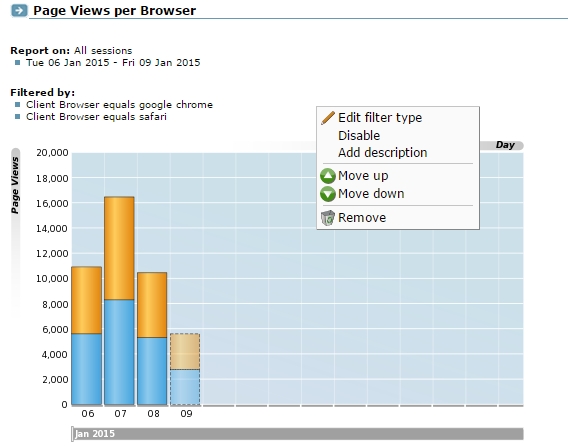
Report filters can be used with reports that you create from the Data Browser. When you specify a report filter for information you include in a report, the user opening the report can use the defined filter when viewing the report's contents.
For example, if you are viewing browser type information (via the All sessions groups, and the page views per browser sub-group), you could create a report that allowed its users to select a particular browser type. To define the filter, do the following:
-
Select a value from the displayed list of locations, and define it as a filter.
-
To add more filters, click on the filter icon on the toolbar as described in Table 3-1 and Add to define more filters. When finished, click Save.
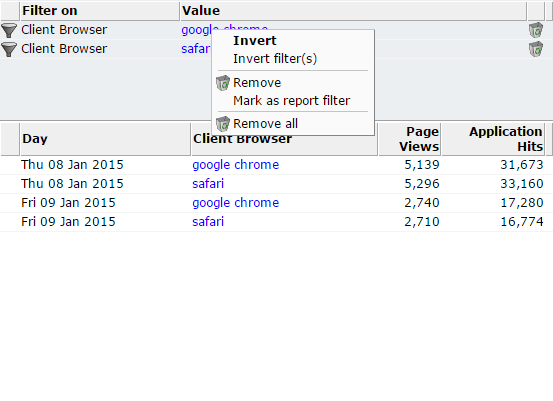
-
For each filter listed in the filter panel, right click it, and select Mark as report filter from the menu. An example is shown in Figure 3-16.
Note:
Be careful when designing reports with multiple filters because it can make the report difficult to view. -
Select Open as report from the View menu, and finalize the structure of the required report. Notice that the selected filter is now shown within the report. An example is shown in Figure 3-17.
-
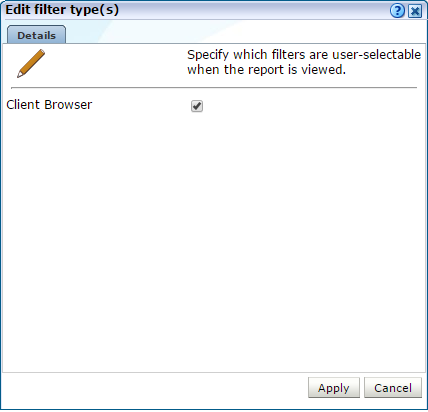
Highlight the filter by placing the mouse pointer over it, and select Edit filter type from the menu. A dialog similar to the one shown in Figure 3-18 appears.
-
Use the check box(s) shown in the Edit filter type(s) dialog to control which filters can be selected by a user when the report is opened. There will be a check box for each defined report filter. When ready, click Apply.
-
Save the report, as described in Section 2.11, "Creating New Reports".
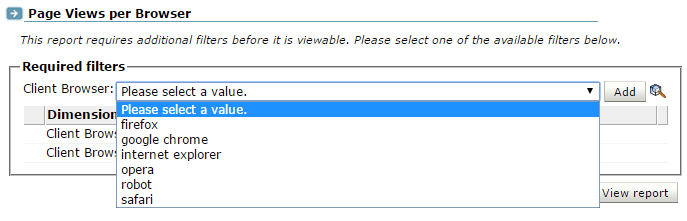
When the report is opened, and a report filter has been enabled, you can choose one or more values to filter the report. An example is shown in Figure 3-19:
3.9.4 Using Advanced Filters
Sometimes it is useful to create a set of filters with more complex logic, combining filters to see only the results that you require. For example, you can create a filter to view only results from either of 2 IP addresses, but only show results where the application language is English. This example is shown in Figure 3-17.
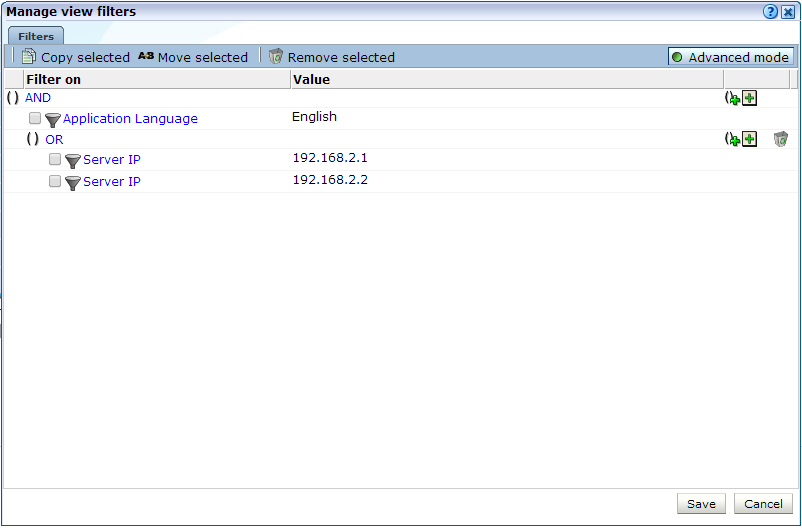
To create an advanced filter:
-
Click on the filter icon on the toolbar as described in Table 3-1 to view all the filters currently applied.
-
Click the Advanced mode button on the filter screen.
-
Click the plus icon to create a new filter.
-
Click the group plus icon (+) to create a new group. Each group has it's own logic, for example an OR group can contain a set of filters which will produce results if any of the individual filter criteria is met.
-
To change a group from AND to OR, click the group label text. For example, clicking on AND changes that group logic to OR.
These advanced filters can be used in reports, but cannot be used in dashboard or KPI definitions.
3.10 Comparing Data Across Different Periods
Sometimes it is useful to be able to compare data relating to one period with a comparable period. For example, to compare traffic levels or the incidence of page errors. Do the following:
-
Select Browse data, and select the required group.
-
Use the Calendar controls to select the active period. The use of these controls is described in Section 2.6, "Using the Calendar". Note that the two periods to be compared must not overlap. For example, it is not possible to compare two 2-day periods when there is only a 1-day gap between them.
-
Use the Compare offset menu to select the period with which the active period should be compared. Note that the options available depend on the selected period scheme (Day, Week, or Month). Up to 50 previous period selections are available.
-
Select the required view from the View selection panel. Figure 3-21 shows an example of a period comparison.
Figure 3-21 Comparison of Object Performance and Hits for two Periods
Description of ''Figure 3-21 Comparison of Object Performance and Hits for two Periods''
-
Optionally, use the Bar chart, Line chart, or Values icons within the toolbar to change the comparison's visualization. Note that other visualizations (such as pie charts) are not available for comparisons, and that restrictions are applied to the displayed data within bar and line charts. Within value lists, an additional row is created for comparative analysis. If the amount for the principle period is greater than that of the compare period, the compare value is shown in green. Otherwise, it is shown in red. An example is shown in Figure 3-22.
3.11 Exporting Data
You can export the data currently shown in the Data Browser to a wide variety of applications, such as spreadsheets. To start working with export data, open the Export window by clicking the Open as export icon, or selecting Open as export from the View menu. A new window with the current data is opened. An example is shown in Figure 3-23.
Exporting Large Numbers of Items
Be aware that a maximum number of 5000 items can be directly exported to Microsoft Excel. As a workaround to this limitation, it is recommended that you do the following:
-
Save the required view as a report. To do so, click the Open as report icon on the toolbar, and within the new window, select the Save as new option from the File menu.
-
Select System, and then Export report data. Select the newly created report. Note that the use of this facility is described in Section 2.13, "Exporting Report Data".
-
Copy the URL that appears when the report is selected, and append the string
&output=xlsto the end of it. -
Use the created URL to access the complete Microsoft Excel export.
3.11.1 Modifying the Exported Data
The Export window (Figure 3-23) shows the raw data that is available for export. However, you can customize how the data should be exported. To do so, right click within the export window, and select Edit. A dialog similar to the one shown in Figure 3-24 appears.
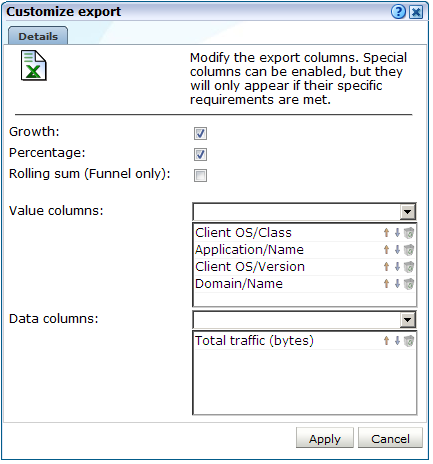
This dialog allows you to modify the order of data columns, the order in which values appear in those columns, and specify additional columns that will appear in the Microsoft Excel export.
Within the Data columns and Value columns fields, you can use the lists to add additional primary (index) columns, and the data columns that should appear within them. The exact selection of data and value columns that are available within each list depends on the view group with which you are working. For example, if you are viewing data from the All clients group, the selection of web site/page data columns is limited to domain and web site. However, if you are working in All pages group, additional data columns are available for such things as page content and page user flow. For a complete description of the data and value columns that are available for export within each view group, see Appendix E, "Summary of Data Items."
The Percentage check box allows you to specify whether an additional column, showing the percentage make up from the reported values, is added to the export.
The Growth check box allows you to specify whether an additional column, showing the actual increase in the reported metric, is added to the export.
The Rolling sum check box allows you to specify whether an additional column, showing the cumulative total of user flows, is added to the export. Note that this option only applies to the funnel graph (available from the User flows view within the User flow completion group).
You can use the Up, Down, and Remove icons next to a data column selection to control the sort order hierarchy, or to remove a data column as an index to the data. Similarly, you can use these controls within the value column field to rearrange the order in which they appear in the export.
You can save the export to a new or existing file, or append it to an existing export.
3.11.2 Selecting the Export Format
In addition to controlling how the exported data will appear, you can also specify the format in which the data will be exported. To do so, select the Download menu. The following export formats are available:
Be aware that the exported data is in Unicode (UTF-8) format.
3.12 Working With Custom Dimensions
Custom dimensions allow you to add your own user-defined dimensions to views in the Data Browser. These new dimensions are then also available for use within KPIs, as well as reports and exports. For example, you might want to add a dimension "supplier" so that you could more easily track and analyze your organization's suppliers. Using this facility, you could determine which suppliers have the highest conversion rates associated with them within key business operations, or which suppliers attract the most page views on the organization's web site. Note that the use of problem-based custom dimensions is primarily intended for application debugging purposes.
Note:
Custom dimensions can be page, session, function, user flow, or problem -based. Because KPIs are based on real-time data, session-based custom dimensions cannot be used as metrics within KPIs. However, page-based custom dimensions can be used as KPI filters.Reporting of Custom Dimensions
Each custom dimension has a unique name, and is page, session, function, user flow, or problem-based. This determines the Data Browser groups within which it is reported and, as explained in the following section, how dimension information is preserved between page views. The reporting of custom dimensions within Data Browser groups is highlighted in Table 3-7.
Table 3-7 Reporting of Custom Dimensions Within Data Browser Groups
| Source | All pages | Key pages | All sessions | Failed pages | Failed URLs | Slow URLs | Slow functions | All functions | Failed functions | (named) Suite | URL diagnostics | All user flows |
|---|---|---|---|---|---|---|---|---|---|---|---|---|
|
Page |
X |
X |
X |
X |
X |
X |
X |
X |
||||
|
Page (session aware) |
X |
X |
X |
X |
X |
X |
X |
|||||
|
Session |
X |
X |
X |
X |
X |
X |
||||||
|
Function |
X |
X |
||||||||||
|
Problem analysis |
X |
X |
X |
X |
||||||||
|
User Flow |
X |
Be aware that when reviewing live session-based custom dimension information (that is, during the same day as the session), the reported user name can change. When viewing the same information across multiple days, the reported user name is based on the last value detected during the session.
Preserving Dimensional Information
As previously explained, the entity (page, session, function, user flow, or problem) upon which a custom dimension is based, determines how information within the dimension is preserved between page views. This section provides a detailed explanation of how the selected scheme effects the reporting of custom dimension information. This is based on the presentation of example visitor sessions. Each example session refers to a monitored web site containing a sales catalog. To capture information about which collections within the catalog visitors are viewing, a custom dimension with three levels is defined. These three levels are derived from three arguments: a, b, and c.
When a custom dimension is specified as page-based, the values shown in Table 3-8 are reported.
Table 3-8 Page-Based Custom Dimension Information Retention
| Input | Dimension level | ||
|---|---|---|---|
|
1 (a) |
2 (b) |
3 (c) |
|
|
a=men |
men |
'(no value)' |
'(no value)' |
|
a=men, b=coats |
men |
coats |
'(no value)' |
|
a=men, b=coats, c=winter |
men |
coats |
winter |
|
a=men, b=hats |
men |
hats |
'(no value)' |
|
a=men, b=hats, c=trilby |
men |
hats |
trilby |
|
a=children |
children |
'(no value)' |
'(no value)' |
Notice that when using this scheme, only the information available within the current page view is used when reporting on the custom dimension levels. No information is inherited from previous page views.
When a custom dimension is specified as page (session aware)-based, the values shown in Table 3-9 are reported.
Table 3-9 Page (Session Aware)-Based Custom Dimension Information Retention
| Input | Dimension level | ||
|---|---|---|---|
|
1 (a) |
2 (b) |
3 (c) |
|
|
a=men |
men |
'(no value)' |
'(no value)' |
|
(a=men,) b=coats |
men |
coats |
'(no value)' |
|
(a=men,) (b=coats,) c=winter |
men |
coats |
winter |
|
(a=men,) b=hats |
men |
hats |
'(no value)' |
|
(a=men,) (b=hats,) c=trilby |
men |
hats |
trilby |
|
a=children |
children |
'(no value)' |
'(no value)' |
Notice that now when custom dimension level information is not available on a page view, the information is inherited from the previous page view. This inheritance is indicated with the use of brackets. The information between the brackets is not available in the current page view, and so is derived from the previous page view.
When a custom dimension is specified as session-based, the values shown in are Table 3-10 are reported.
Table 3-10 Session-Based Custom Dimension Information Retention
| Input | Dimension level | ||
|---|---|---|---|
|
1 (a) |
2 (b) |
3 (c) |
|
|
b=coats |
'(no value)' |
coats |
'(no value)' |
|
b=coats, c=winter |
'(no value)' |
coats |
'(no value)' |
|
c=winter |
'(no value)' |
'(no value)' |
winter |
|
...... |
'(no value)' |
'(no value)' |
'(no value)' |
Notice that in the above example, no inheritance occurs for custom dimension information. In addition, be aware that only one page view can be reported using this scheme. This is the first page view for which custom dimension information is available. In this case, that is the first page in the viewing history ('(no value)' » coats » '(no value)'). All custom dimension information on other page views is discarded. Note that Table 3-8, Table 3-9, and Table 3-10 each refer to a single session.
Translations for Custom Dimensions
Optionally, you can also define a set of translations for each unique source value reported for the dimension level. For example, you could define the service-based custom dimension "server ID" with the associated translations shown in Table 3-11:
Table 3-11 Example Custom Dimension Translations
| Value | Translation |
|---|---|
|
178349 |
Business Partnerships |
|
561808 |
Newsletter and Events |
|
405969 |
Catalog |
|
969533 |
Payment Handling |
To define a custom dimension, do the following:
-
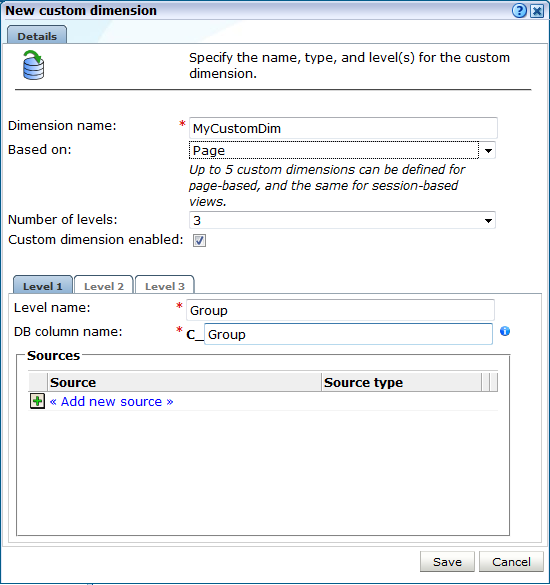
For function-based custom dimensions, select Configuration, then Services, and then Custom dimensions. For application-based custom dimensions, select Configuration, then Applications, and then Custom dimensions. A list of the currently defined custom dimensions appears. A maximum of two user flow, and a maximum of five page or session-based custom dimensions can be defined. For function-based custom dimensions, the maximum is 10. Click the New dimension command button. A dialog similar to the one shown in Figure 3-25 appears.
-
Specify a unique name for the new dimension. Note that in displays (such as within the Data Browser or a report) that feature the defined custom dimension, the dimension's name is appended with an asterisk (*).
-
Use the Based on menu to specify the entity type upon which the dimension should be based. For function-based dimensions, this is automatically selected as function, and cannot be modified. For application-based dimensions, you can selected this to be page, page (session aware), session, user flow, or problem analysis. The use of these options is explained in a previous section. Note a maximum of five page, session, user flow, or problem-based custom dimensions, and a maximum of 10 function-based custom dimensions, can be defined.
-
Use the Number of levels menu to specify the level of dimension information that should be retained. By default, only one level of information is retained for the defined custom dimension. However, you can use this facility to build a hierarchy of retained session information. For example, you might want to capture information about the user's location using the three levels of country, region, and city. A maximum of four levels is supported.
-
Use the Custom dimension enabled checkbox to enable or disable processing for this custom dimension.
-
Within the displayed Level tabs, specify a name for the dimension level. Enter the name of the column in the RUEI table that stores the custom dimensions in the DB Column name field.
-
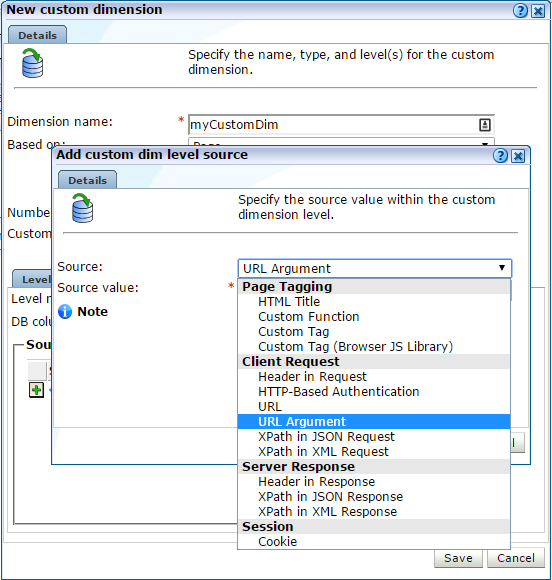
Click Add Source and complete the following screen to add one or more sources to the custom dimension.
Use the Source menu and Source value field to specify the scope of the search for the dimension, and whether the search should use an XPath expression, a header, the cookie, HTML title, a URL, a URL argument (request), or a custom tag or function. More information about using XPath queries is available in Appendix F, "Working with XPath Queries". Note if the source is a URL argument, the raw (original) input is used. However, in the case of an HTTP header, only ASCII input is allowed. Non-ASCII characters are replaced by an underscore (_) character when reported. For more information encoding support, see Appendix G, "Working with National Language Support".
If the custom tag or custom function options are selected, the tag or function name must be specified within the Source value field. Note that, in the case of a custom function, only the first parameter is used, and it must be enclosed in single or double quotes. For example:
wiViewState("wi_menu_main_menu");More information about how custom tags and functions are interpreted within pages is available in Appendix A, "Tagging Conventions".
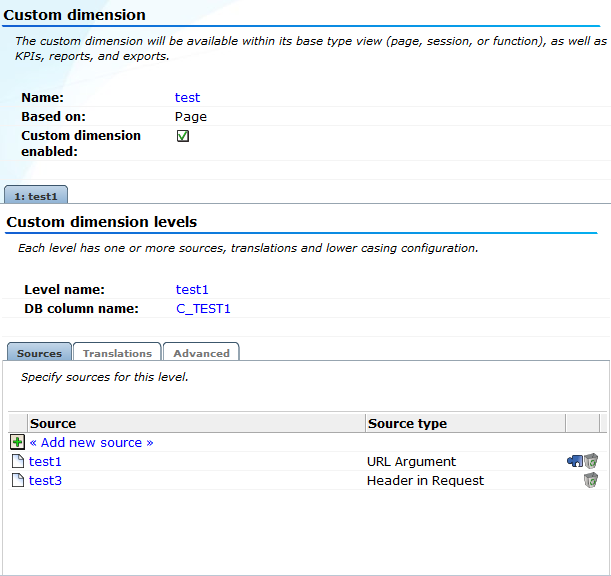
When ready, click Save. An overview of the defined custom definition (similar to the one shown in Figure 3-27) appears.
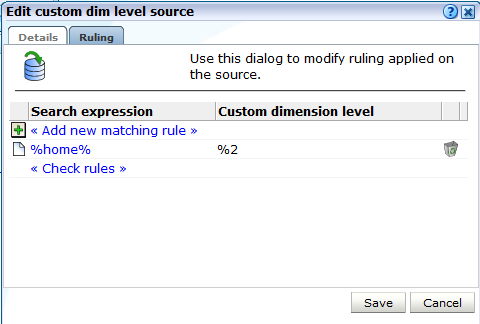
-
Optionally, you can edit the rulings for the custom dimension. To do so, click an existing source. The dialog shown in Figure 3-29 appears.
For an introduction to ruling, see Section 7.3.5, "Using the Ruling Facility".
-
Optionally, you can also define a set of translations for each unique source value reported for the dimension level. To do so, click Add new translations. The dialog shown in Figure 3-29 appears.
Specify the required source value and its translation. When ready, click Save.
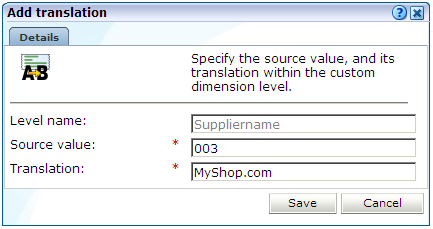
Note that if the list of imported translations is very large, you can use the controls in the toolbar at the bottom of Figure 3-27 to scroll through the displayed list. In addition, you can use the search facility to locate a required translation. The search string can be specified in terms of either a source value or a translation. The use of wildcard characters (such as *) is not supported, and all characters are treated as literals.
Importing Lists of Translations
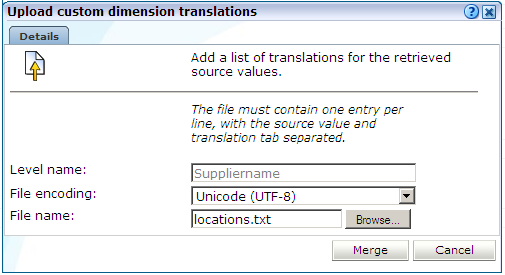
Instead of separately defining each translation, you can click the Upload list icon within the toolbar (at the bottom of Figure 3-27) to import a file containing a list of translations. The dialog shown in Figure 3-30 appears.
Figure 3-30 Upload Custom Dimension Translations
Description of ''Figure 3-30 Upload Custom Dimension Translations''
Use the Browse button to locate and select the required file. Optionally, use the File encoding menu to specify the file's character encoding. For more information on international character set support, see Appendix G, "Working with National Language Support". If an unsupported encoding is encountered, or the transcoding fails, an error is reported.The file may only contain one translation per line, with source values and translations tab separated. When ready, click Merge.
Note:
You can also use the custom dimension facility to redefine the functionality of standard dimensions.Fallback Values Reported For Custom Dimensions
Within custom dimensions, two fallback values can be reported:
-
'(no value)': indicates that the source defined for the custom dimension was not found within the page or function call.
-
Unknown: indicates that the defined source was defined after the cited period for the page or function call. For example, if a custom dimension is defined at 1 PM on a Monday, the daily view will show "unknown" for the period before 1 PM. Similarly, within the week and month views, it will be reported for the period before the custom dimension was defined.
3.12.1 Removing Custom Dimensions
To remove a custom dimension, do the following:
-
For application-based dimensions, select Configuration, then Applications, and then Custom dimensions. For function-based dimensions, select Configuration, then Services, and then Custom dimensions. A list of the currently defined custom dimensions appears. Right click the required custom dimension, and select Remove from the menu.
-
If the custom dimension is used as a filter in a KPI or a report, you are warned that deleting the custom dimension also results in the deletion of the associated KPI or report. Click Yes or No.
3.13 Customizing Browser Views
The RUEI data browser includes a set of standard views, that can be used as a basis for custom reports and data export definitions. When you customize a report or data export definition, you can save that customization as a customized view, making it available in the data browser. The newly created customized views appear as on option in the Custom classification or subgroup of the panel shown in Figure 3-3.
Note:
Customized views can only be viewed as a values table.There are two methods to create a customized view, using a saved report or export, or editing an export definition.
Note:
Only users with Administrator access can create customized views. All users with data browser access can view all customized views.To create a customized view using a saved report or export:
-
Create a report as described in Section 2.11, "Creating New Reports" or create a data export definition as described in Section 3.11, "Exporting Data".
-
Open the report or export definition you created in step 1 by selecting Reports and then selecting the report or export definition.
-
Right click on the values table and click Browse to navigate to the data browser.
-
Click on the Save icon (as shown in Table 3-1).
To create a customized view using an export definition:
-
Create a data export definition as described in Section 3.11, "Exporting Data".
-
When viewing the export definition as shown in Figure 3-23, right click on the values table and click Edit.
-
Modify the export definition, for example add a dimension.
-
When viewing the modified export definition, right click on the values table and click Browse to navigate to the data browser.
-
Click on the Save icon (as shown in Table 3-1). Note that the Save icon does not appear unless you modified the export definition in step 3.