4 ACSLS GUI
Introduced in ACSLS 8.0, the Web-based ACSLS Graphical User Interface (GUI) provides a graphical console for manipulating and monitoring library operations and for the administration and operation of logical libraries. Refer to the online help for procedures and detailed information for using the GUI.
The GUI provides:
-
An alternative library console with greatly expanded flexibility and ease of use. It provides most of the operations that are available in the legacy
cmd_proc(exceptions are shown under "System Operations Excluded in the ACSLS 8.4 GUI"). -
Logical library support.
For more information about logical libraries, refer to "About Logical Libraries".
-
For library administration and operation. It provides the ability to perform most legacy
cmd_procoperations, along with new operations related to logical library management. -
Real-time monitoring of tape library components.
-
A tree browser to navigate physical and logical configuration.
-
Real time alerts that are visible from each screen.
An alert informs you of conditions that might result in damage to hardware, corruption of data, or corruption of application software. It always precedes the information to which it pertains.
-
The ability to filter volume and drive displays with user-specified criteria.
-
User-customized views of system events and system logs.
-
Online help.
To create, manage, or delete logical libraries, you must use the ACSLS Graphical User Interface (GUI). The GUI is automatically included in the ACSLS 8.4 installation package. For more information on logical libraries, refer to "Logical Library Support".
Starting the ACSLS GUI
The software that controls the ACSLS GUI starts automatically when the ACSSS services are enabled. The ACSLS GUI is deployed among other applications inside WebLogic on the Solaris platform.
To log in to the ACSLS GUI:
-
Open a browser and submit a URL with the server hostname or IP address:
https://myAcslsHostName.myDomainName:7002/SlimGUI/faces/Slim.jspor
http://127.99.99.99:7001/SlimGUI/faces/Slim.jspIt is best to use the fully-qualified host name or the IP address of the host system. Some pages, including the ACSLS help pages, may not display properly if the URL cannot be fully resolved by WebLogic.
If you use http with port 7001, WebLogic automatically re-routes you to https on port 7002.
Since WebLogic is using the secure https protocol, your browser may warn you the site security certificate has not been registered, and therefore is un-trusted. If you are confident that the URL is your local ACSLS server, you are safe to proceed. At this point, you should see the login screen. If your browser requires a security certificate, refer to "Configuring a Self-Assigned Digital Certificate for HTTPS".
-
On the login screen, enter a valid ACSLS user ID and the corresponding password. These are the user IDs that you set up when installing WebLogic or through
userAdmin.sh(such asacsls_admin). -
After successful login, you should see the ACSLS GUI Welcome page.
Administering GUI Users and Passwords
Use the userAdmin.sh menu-driven utility to add and manage ACSLS GUI users and passwords. See "userAdmin.sh".
Overview of the GUI
The following sections cover a basic overview of the GUI.
The GUI Welcome Screen
The ACSLS GUI Welcome screen displays three windows:
-
The masthead in the top frame
-
The navigation tree in the left-hand frame
-
The Overview and Status page in the right-hand frame
After an initial load of the GUI into your browser, if the right-hand frame does not display, refresh your browser.
The following figure shows the ACSLS GUI.
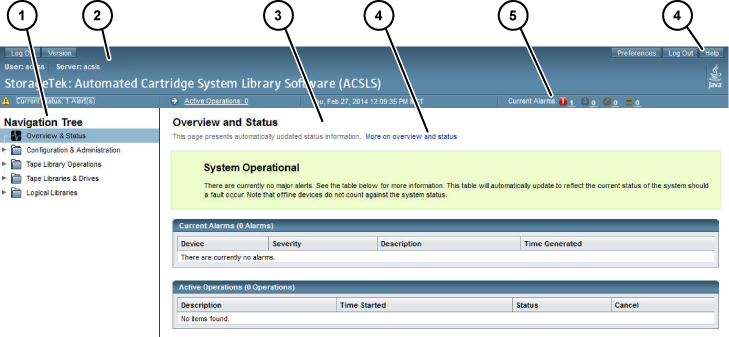
Legend:
-
Navigation tree
-
Masthead
-
Page
-
Help links
-
Alarms
Masthead
The masthead comprises the following buttons:
-
Log Out
The Log Out button logs you out of the GUI.
For added security, it is recommended that you clear your browsing history very time you log out of the GUI.
-
Version
The Version button displays the current ACSLS version and copyright notice.
-
Preferences
The Preferences button opens up a page so you can specify GUI system preferences.
-
Logout
The Logout button ends the current session.
-
Help
The Help button launches the online help system
-
Active Operations
The Active Operations button shows the number of ACSLS operations in progress. This is a hyperlink to the Overview and Status page which reveals details about alarms and active operations.
-
Current Status
The Current Status button displays the number of active alerts. This is a hyperlink that takes you to the Overview and Status page.
-
Date and Time of Login
The Date and Time of Login is the time stamp showing the original login time of the current GUI session.
-
Current Alarms
The Current Alarms button is a dashboard view showing the number and severity of any current system alarms. The details of any current alarm is summarized on the Overview and Status page.
Alarms Color Codes
The following table describes the alarms color codes:
| Color | Severity Level | Device Affected |
|---|---|---|
| Red | Critical | This signifies a condition that seriously inhibits normal ACSLS operation. A critical alarm displays when the underlying problem requires immediate attention. The resulting impact leads to a system-wide halt to normal ACSLS library operations. |
| Black | Down | This alarm indicates that one or more subsystems within ACSLS is offline. The offline status may be due to intentional manual operation or may be due to other factors. Usually the presence of associated technical factors will be indicated by the yellow (minor) alarm or the orange (major) alarm icon. |
| Orange | Major | A major alarm indicates a perceived malfunction with the software or with any of the underlying components that enable ACSLS or the GUI to function. |
| Yellow | Minor | This color implies that the system is not fully functional. The system may be initializing, or there may be one or more discrete subsystems that are not operational. This interruption is viewed as temporary, or when the function it represents is discrete and not vital to the overall library control operation. |
The masthead alarms are not illuminated in color unless there is at least one active alarm in that category. The actual number of alarms is displayed in numeric text next to the color icon. If there are no active alarms, the number shows zero (0).
For color-blind users, there is a "tool-tip" feature that allows you to hover over each color icon with the mouse. A small pop-up window displays the meaning of that graphical icon in plain text.
System Preferences
This page is accessed from the Preferences button in the Masthead. The page provides numerous drop-down menus that allow you to alter system behavior depending on your personal preferences:
-
Default Tree Menu - Specify an expanded or collapsed menu format.
-
Log Page Size - Specify the number of events to be displayed on pages in the Log Viewer.
-
Alert Update Interval - Specify how often the browser should probe the server for system alerts. If your GUI response time is slow, you can increase this interval.
-
Number of Days to Retain Events - Specify how much history should be displayed on the System Events page.
-
Enable Fast Load for SCSI Clients - Specify (yes) to return a successful response to the SCSI client immediately after a valid mount request has been received, or (no) to wait until the robotic mount operation has actually completed.
Navigation Tree
The Navigation Tree will always be located in the left-hand frame of the ACSLS GUI. The collapsed tree offers navigational links to:
-
The Overview and Status page
-
Configuration and Administration pages
-
Tape Library Operations pages
-
Tape Libraries and Drives pages
-
Logical Libraries pages
Overview and Status
This page is the first place to go when you want to identify the specific malfunction or interruption of service indicated by the alarm icons in the Masthead. At the top of this page is a status summary that reflects the severity of the overall system condition.
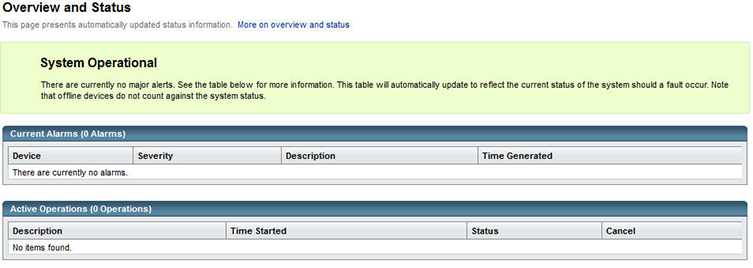
Two boxes display under the status summary. They are:
-
Current alarms
Current alarms show the device affected, the severity level, a description, and the time the event took place. The severity levels, are:
-
System Critical is shown with a red icon and red background color. This signifies a condition that seriously inhibits normal ACSLS operation.
-
System Degraded is shown with a yellow icon and yellow background color. This implies that the system is not fully functional. The system may be initializing, or there may be one or more discrete subsystems that are not operational.
-
System Operational is shown with a green background color. This indicates that all subsystems are functional and no errors have been detected with system components.
-
-
Active alarms
Active operations table lists library operations that are currently in progress. Each operation is listed with a brief description, the time the action started, the current status, and a radio-button option to cancel the operation.
Configuration and Administration
The Configuration and Administration section contains links to pages that enable you to monitor the ACSLS system and other pages that allow you to manage logical library configurations. When you expand this leaf of the tree, you get the following submenu:
-
Log Viewer
-
System Events
-
Logical Library Configuration
The Log Viewer
The default Log Viewer page displays a running tail of the various logs that monitor system events, including the acsss_event.log, the smce_trace.log. This page provides navigational buttons that enable you to scroll through the history of the log back to its beginning.
System Events
Every discrete library operation is recorded in the System Events log. Each record in this log contains an event time stamp, an event type, and a description of the event.
Logical Library Configuration
When you expand this leaf of the tree, it opens into various options for configuring and managing logical libraries:
-
Create a logical library
-
Edit a logical library
-
Assign volumes to a logical library
-
Un-assign volumes from a logical library
-
Manage client connections.
For more information on logical libraries, refer to "Logical Library Support".
Tape Library Operations
Tape operations enable you to:
-
Audit the ACS, LSM, or panel
-
Mount volumes
-
Dismount volumes
-
Enter volumes
-
Eject volumes
Tape Libraries & Drives
The following detailed information is provided for tape libraries and drives:
-
Library operations that let you stop or start processing
-
Capability to view:
-
physical state of the library server
-
current activity that graphically shows mounts in the past hour and mounts in the past 24 hours
-
physical components which includes:
-
total number of ACSs
-
capacity
-
total volumes
-
total volumes by type
-
total free cells
-
graphical view of the cell usage
-
total LSMs
-
total LSMs by type
-
total drives
-
total drives by type
-
total number of CAPs
-
list of logical libraries
-
System Operations Excluded in the ACSLS 8.4 GUI
Most installation utilities, diagnostics, and other shell-command utilities remain outside the scope of the ACSLS GUI console. There are a few operations in the legacy cmd_proc that have not been implemented in the ACSLS GUI for Release 8.4. These include:
-
Define, delete, query, or display pools
-
Display panels
-
Idle or start the server
-
Lock or unlock volumes
-
Lock or unlock drives
-
Mount scratch volumes
-
Query or switch LMUs
-
Perform a query mount
-
Set scratch volumes
-
Set or clear locks
-
vary, query, or display ports
-
venter
Firewall and the GUI
If firewall protection is enabled on your ACSLS server, it will impact remote user access to the ACSLS GUI unless an explicit policy is configured with the firewall software.
On Solaris
Consult the man pages for ipf and ipfilter. The ipfilter firewall is enabled (disabled) by root using the following command:
svcadm enable ipfilter (svcadm disable ipfilter)
-
To learn the current status of ipfilter:
svcs ipfilter
Firewall policies can be defined in the file, /etc/ipf/ipf.conf. To allow free communication between components on the local host (such as, between ACSLS and WebLogic), include a statement, like the example below:
pass in quick from 127.0.0.1 to 127.0.0.1, or
pass in quick from 127.0.0.1 to all
-
To provide a policy allowing remote Web-based browsers to access the ACSLS GUI, you must open up ports 7001 and 7002.
pass in quick from any to any port = 7001
pass in quick from any to any port = 7002
For ACSLS ACSAPI clients, you must discover which ports are in use by ACSLS. Use the following command from your UNIX shell:
rpcinfo -p | egrep "300031 | 536871166"
The port IDs are listed in the last field of the display. You must add 'pass in quick' statements for each of these. It is also be necessary to include a 'pass in quick' statement for the RPC portmapper port, 111.
For further firewall information for ACSLS, refer to "Firewall Security Option".
The last statement in your proposed rule set, block in from any, assumes that no traffic should reach the host unless specifically allowed in previous statements.
On Linux
Consult the man pages for iptables. The iptables firewall is enabled (or disabled) by user root,using the following command:
service iptables start (service iptables stop)
-
To check the status of iptables:
service iptables status
The policy file for iptables is /etc/sysconfig/iptables.To include a policy that allows remote http/https access to the ACSLS GUI, you should update that file to include exceptions for ports 7001 and 7002, using statements like the example below:
-A input -p tcp --dport 7001 -j ACCEPT
-A input -p tcp --dport 7002 -j ACCEPT
For more information on iptables, see "Verifying the GUI is Operational".
For ACSLS ACSAPI clients, you must discover which ports are in use by ACSLS. Use the following command from your Linux shell:
rpcinfo -p | egrep "300031 | 536871166"
The port IDs are listed in the last field of the display. You must add exceptions for each of these ports in your iptables policy. It is also necessary to provide an exception statement for the RPC portmapper port, 111.
For further firewall information for ACSLS, refer to "Firewall Security Option".
Configuring a Self-Assigned Digital Certificate for HTTPS
When you install WebLogic on your ACSLS server, a simple 512-bit public key is automatically available to support basic https exchanges with client browsers. Normally, no further configuration should be necessary. However, some browsers, notably the Microsoft Internet Explorer, require a lengthier key of no less than 1024 bits.
Internet Explorer and FireFox Version 39 and above require a WebLogic set-up procedure for use with https servers that do not employ certificates verified by a third-party digital signing authority.
Refer to "Configuring a Self-Assigned Digital Certificate for HTTPS" in the ACSLS 8.4 Installation Guide for procedures.