In Workbench, a report describes the search and navigation usage of your Web site on a daily or weekly basis.
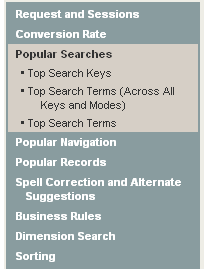
Reporting data is organized into report sections and further organized by individual report items. For example, Popular Searches and Popular Navigation are report sections. Report sections contain report items, for example the Popular Searches section contains the Top Search Keys item, among others. The following image shows the report sections available in a typical Guided Search application. It also shows the report items that display when Popular Searches is selected.
Selecting a report item in the left-hand pane displays report entries in the body of the report. This information includes the report’s name, the reporting data in tabular format, and in some cases a chart of the reporting data displayed in the table.
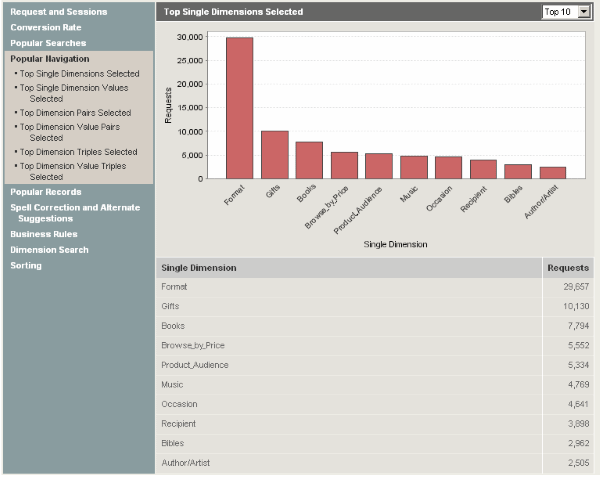
If a chart appears with the reporting data, the chart may have a drop-down list to view subsets of the reporting data. For example, if you view Top Single Dimensions Selected item, under the Popular Navigation section, you can view subsets of the reporting data by selecting Top 10, Top 20, Top 50, and so on from the list. If you choose a value for Top N that is greater than 30, the chart displays only the first 30 items. However, the table displays all items.
The following image shows the report item named Top Single Dimensions Selected. The report item contains a bar chart representation of the tabular data and it contains a drop-down list to display subsets of the data. In this image, the report items shows the top single dimensions selected and the number of requests for each.
You can configure which report sections and report items you want to
display in Workbench by modifying the
report_settings.xml file.


