Data source types: Essbase, Planning, Oracle Planning and Budgeting Cloud Service, Oracle Enterprise Performance Reporting Cloud Service, Financial Management, Hyperion Enterprise
You can remove members and their associated data from the grid as follows:
To keep only the currently selected members, select the member cells that you want to keep. Then, from the data source ribbon, click Keep Only. All other members in the dimension are removed.
To remove all members except the currently selected member cells, select the cells that you want to remove. Then, from the data source ribbon, click Remove Only.
Keep Only and Remove Only operate on all instances of the selected members in the grid within the selected group.
About Keep Only and Remove Only
The results of Keep Only and Remove Only depend on how the selected group is evaluated within the grid. A group consists of two or more dimensions down the grid as rows or across the grid as columns.
To use the Keep Only or Remove Only command, the selected member must have a group of members associated with it. Members do not have to be from the same dimension to be considered a group. The selected member shouldn’t be the lowest or last member of the group.
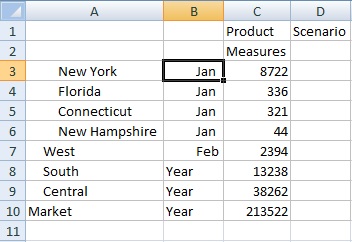
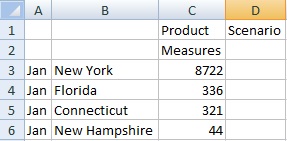
For example, in Figure 39, Grid with Market Members in Column A, Year Members in Column B, you could think of New York, Florida, Connecticut, and New Hampshire as individual groups that all contain the January member. We want to keep the data for January for those four states. Yet, when we select Jan, and then click Keep Only, the grid doesn’t change. This is because Jan is not its own group, it’s actually a member of a group originating with the Market dimension, and also belongs to the New York, Florida, Connecticut, and New Hampshire groups.
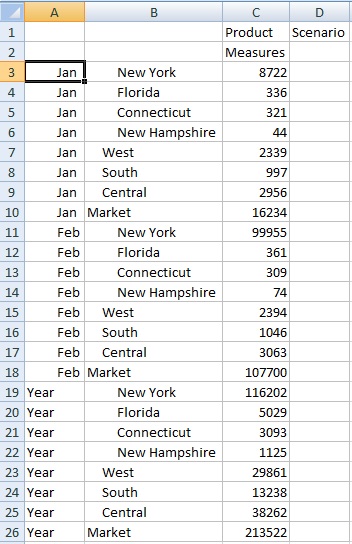
Try moving Jan to reposition it so that Jan is now a group, and the members New York, Florida, Connecticut, and New Hampshire belong to the Jan group, as shown in Figure 40, Grid with Year Members in Column A, Market Members in Column B
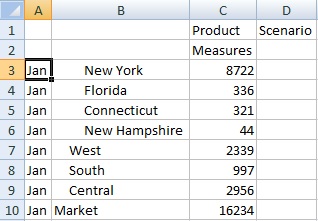
Now select a Jan cell and click Keep Only. The resulting layout shows only the Market dimension members grouped under Jan.
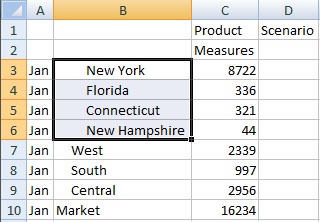
You can further refine the report to show only the New York, Florida, Connecticut, and New Hampshire members. Select those members in the grid (see Figure 42, Members Selected for Keep Only).
And then click Keep Only. The result is shown in Figure 43, Grid with Only Jan Group Members New York, Florida, Connecticut, and New Hampshire.
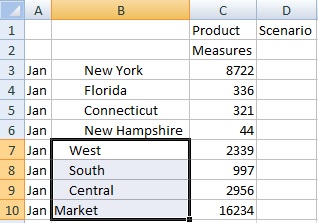
Note that you can also achieve the result in Figure 43, Grid with Only Jan Group Members New York, Florida, Connecticut, and New Hampshire in another way. Select the West, South and Central members, and the Market dimension, as shown in Figure 44, Members Selected for Remove Only.
And then click Remove Only.
Remember that the Keep Only and Remove Only commands are always performed on the selected groups, evaluated within the grid.