5 Monitoring Oracle Database Appliance
Oracle Enterprise Manager Database Appliance management simplifies monitoring by integrating all hardware and software components into one entity. You can view all critical issues in the system, monitor performance, and drill down to individual targets from the Oracle Database Appliance home page.
Monitoring All Oracle Database Appliance Targets
By default, when you open the Oracle Database Appliance home page, you will see data aggregated from all of the Oracle Database Appliance systems that are managed by Oracle Enterprise Manager.
To display data for all systems:
-
From the Targets menu, select Oracle Database Appliance.
Oracle Enterprise Manager displays the Oracle Database Appliances page showing all the available targets.
-
Use the tabs in the Oracle Database Appliance home page to monitor the aggregated topology.
Available Data for All (or Groups of) Oracle Database Appliance Targets
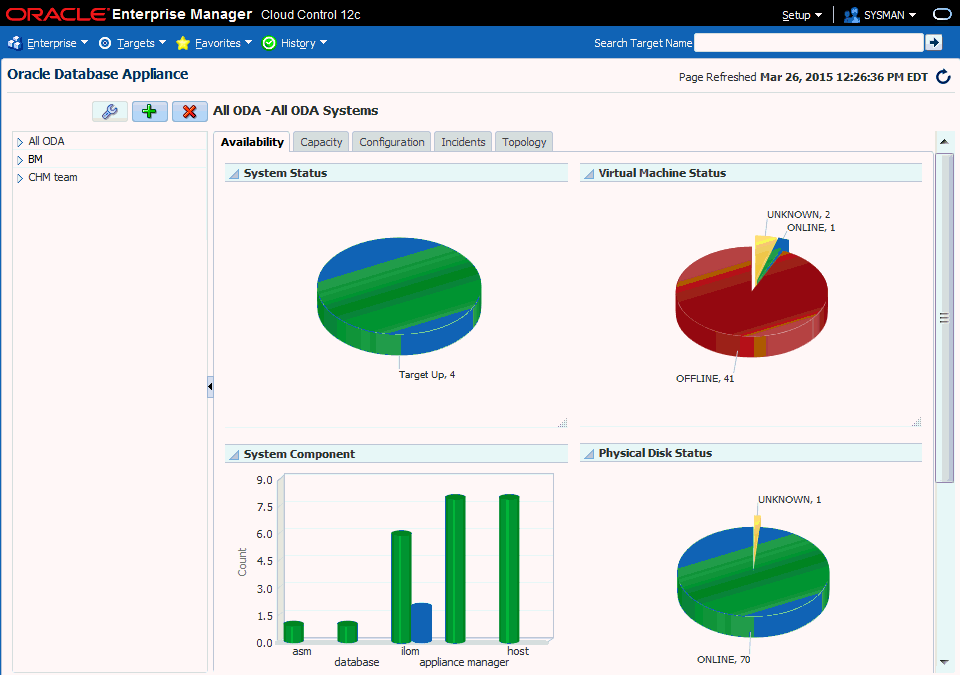
Whether you are monitoring all or a subset (group) of the Oracle Database Appliance systems in the topology, the data are organized and grouped in tabs on the Oracle Database Appliance home page, as show in Figure 5-1.
Figure 5-1 Oracle Database Appliance Home Page
Description of ''Figure 5-1 Oracle Database Appliance Home Page''
Oracle Database Appliance Availability Tab
The Availability tab contains several charts displaying the states of the Oracle Database Appliances.
The System Status pie chart indicates whether the Oracle Database Appliance systems in the selected group are currently online or offline.
You can click on the sections of the pie chart to view detailed information about the system availability represented by the chart. The details are displayed in the table at the bottom of the page.
The Virtual Machine Status chart displays the status (online, offline, or missing) of all of the virtual machines in the selected group. If Oracle Database Appliance is not deployed with the Virtualized Platform, this chart is not displayed.
You can click on the elements in the chart to view detailed status information about the virtual machine components. The details are displayed in the table at the bottom of the page.
The System Component graph displays the status (online, offline, or missing) of components such as Appliance Manager, Oracle ASM, Oracle Database, hosts, and ILOMs for the selected group.
You can click on the bars in the chart to view detailed information about the components represented by the bar. The details are displayed in the table at the bottom of the page.
The Physical Disk Status chart displays the status of all of the disks in the selected group.
You can click on the sections of the pie chart to view detailed information about the physical disk availability represented by the chart. The details are displayed in the table at the bottom of the page.
The table at the bottom of the page changes based on elements you click on in the other sections of the page
To display the system status of each system in the group, click the pie chart in the System Status section. The table lists all Oracle Database Appliance systems in the selected group, along with their statuses. Each Oracle Database Appliance system name is a URL link, which, if clicked, opens the Oracle Database Appliance system home page of the selected system.
The Oracle Database Appliance system home page contains detailed information for one Oracle Database Appliance system. See "Monitoring Individual Oracle Database Appliance Targets" for more information.
Oracle Database Appliance Capacity Tab
The Capacity tab displays the space, memory, and CPU capacities that are utilized by the managed Oracle Database Appliance systems.
Local Filesystem Space Utilization
Each Oracle Database Appliance server node contains 600GB local storage. The local file system space utilization chart displays the mount points and their space utilization. Place your mouse over the bar to display the mount point details. Clicking on a bar in the chart lists all systems in that utilization range in the table at the bottom of the Capacity tab.
Systems are grouped in ranges of percentage of CPU utilization. Clicking on a bar in the chart lists all systems in that CPU load range in the table at the bottom of the Capacity tab.
The Memory Utilization chart displays the memory utilization across the Oracle Database Appliances in the group. The bars represent the percentage of memory utilization. Place your mouse over the bar to display the total number of nodes in this utilization range. Clicking on a bar in the chart lists all systems in that utilization range in the table at the bottom of the Capacity tab.
Shared Filesystem Space Utilization
Oracle Database Appliance uses ACFS file systems to store database and non-database files, guestVM templates, and virtual disk. The chart displays the shared file space utilization groupings, and the number of mount points that fall into this utilization grouping. Place your mouse over the bar to display the utilization group and number of mount points. Clicking on a bar in the chart lists all systems in that utilization range in the table at the bottom of the Capacity tab.
Disk groups (such as RECO, REDO, DATA, and FLASH) are grouped in ranges of percentage of space utilization. Clicking on a bar in the chart lists all systems in that utilization range in the table at the bottom of the Capacity tab.
Oracle Database Appliance Configuration Tab
The Configuration tab displays the hardware and software configurations on the managed Oracle Database Appliance systems.
The pie chart displays a segment representing the number of systems with a similar number of cores configured. Clicking a segment causes the table at the bottom of the tab to display the names of each system with that number of configured cores.
The pie chart displays a segment representing the number of systems with a similar hardware platform (such as X5-2, X4-2, X3-2, and V1). Clicking a segment causes the table at the bottom of the tab to display the names of the systems with that hardware platform.
The pie chart displays a segment representing the number of systems with a similar configuration type (such VM-ODA_BASE). Clicking a segment causes the table at the bottom of the tab to display the names of the systems with that configuration type.
The pie chart displays a segment representing the number of systems with the same software version (such as 12.1.2.2.0). Clicking a segment causes the table at the bottom of the tab to display the names of the systems with that software version.
The table at the bottom of the page changes based on elements you select in the other sections of the page.
Oracle Database Appliance Incidents Tab
The Incidents tab displays all incidents related to all or a subset (group) of the Oracle Database Appliance systems managed by Oracle Enterprise Manager. The Summary links are clickable, opening a page with details about the selected incident.
You can adjust the columns and order of the table using the options in the View menu.
You can filter the incidents by category using the Category drop-down list.
Oracle Database Appliance Topology Tab
Use the Topology tab of the Oracle Database Appliance home page to view the topology of all systems or a group of systems. See "Viewing Oracle Database Appliance Topology" for more information.
Monitoring Groups of Oracle Database Appliance Targets
Oracle Database Appliance systems are grouped using tags. When you monitor groups of targets, the Oracle Database Appliance home page only displays an aggregate of the data available for the group of targets defined by the tag. Oracle Database Appliance targets can belong to more than one group.
To monitor a group of Oracle Database Appliance systems, click on its tag in the tree on the left side of the page.
Creating an Oracle Database Appliance Group
To create a group of Oracle Database Appliance targets, you create a tag, and then add targets to the tag.
-
From the Targets menu, select Oracle Database Appliance.
Oracle Enterprise Manager displays the Oracle Database Appliances page showing all the available system groups in the navigation tree.
-
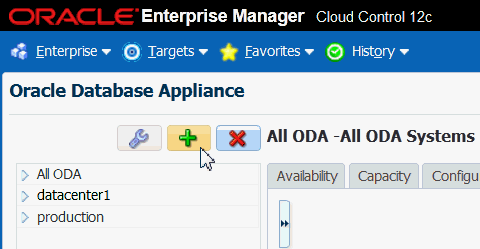
Click the green plus sign icon (Add Tag) above the navigation tree as shown here.
Description of the illustration ''group_tag_add.gif''
Clicking the icon opens the Add Tag dialog.
-
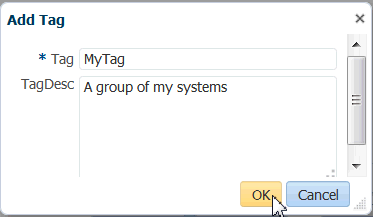
Enter a display name for the tag, enter an optional description, and click OK.
Description of the illustration ''group_tag_add_dialog.gif''
-
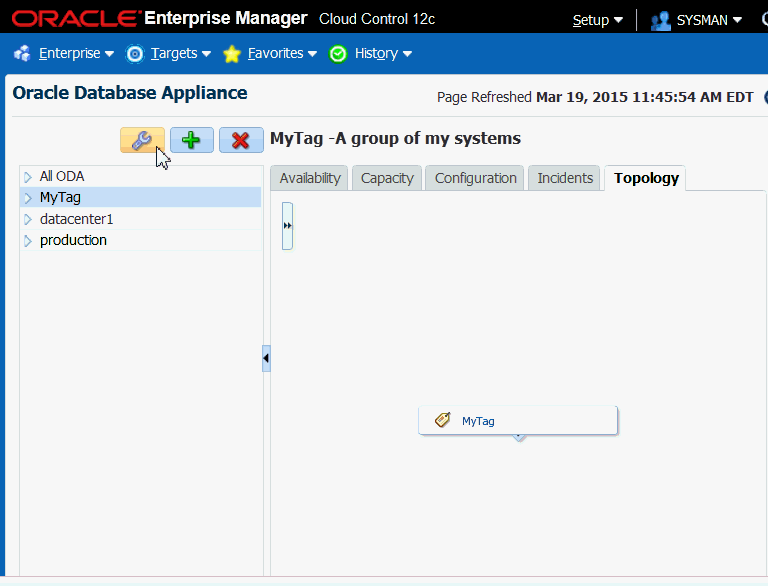
Select the tag in the navigation tree, and click the wrench icon (Modify Systems).
Description of the illustration ''group_tag_modify.gif''
Note that when you select the tag in the navigation tree, the topology tab shows a representation of MyTag, the tag created for this example, but there are no systems branched from it.
The Modify Systems dialog opens.
-
Select systems to add to the group by moving them from the left column to the right column in the Modify Systems dialog, then click OK.
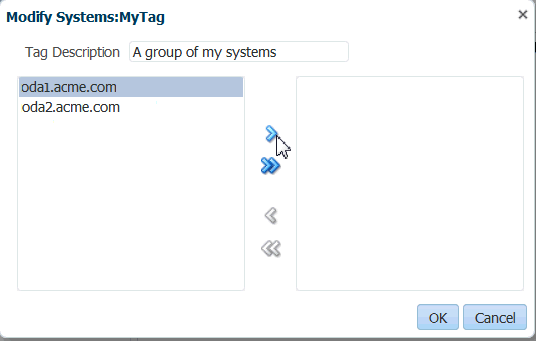
Description of the illustration ''group_tag_mod_dia.gif''
If you expand the tag in the navigation tree the selected systems appear beneath it and you can refresh the topology diagram to show the added system.
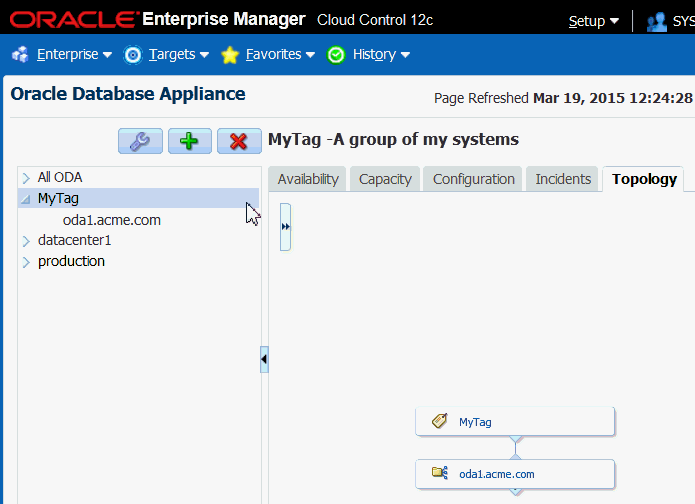
Description of the illustration ''group_tag_system.gif''
Modifying an Oracle Database Appliance Group
You can add or remove targets from a group at any time.
-
From the Targets menu, select Oracle Database Appliance.
Oracle Enterprise Manager displays the Oracle Database Appliances home page showing all of the available system groups in the navigation tree.
-
Select the tag in the navigation tree, and click the wrench icon (Modify Systems).
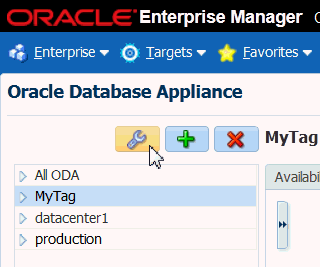
Description of the illustration ''modify_tag.gif''
The Modify Systems dialog opens.
-
Select systems to add or remove from the group by moving them to the left or to the right in the Modify Systems dialog, then click OK.

Description of the illustration ''group_tag_mod_dia.gif''
Deleting an Oracle Database Appliance Group
You can delete a group of targets by removing the tag.
-
From the Targets menu, select Oracle Database Appliance.
Oracle Enterprise Manager displays the Oracle Database Appliances page showing all the available system groups in the navigation tree.
-
Select the group you want to delete, then click the red X icon (Remove Tag) above the navigation tree.
The All ODA tag cannot be deleted because it is the default tag for all of the discovered Oracle Database Appliances.
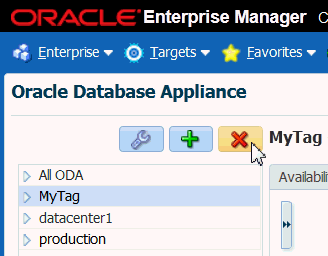
Description of the illustration ''group_delete.gif''
-
In the Remove Tag dialog, select the checkbox next to the group you want to delete and click OK.
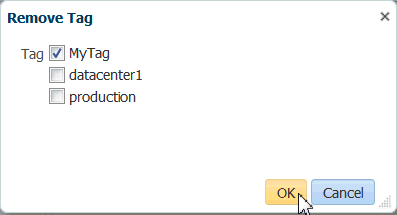
Description of the illustration ''group_delete_dia.gif''
Removing the tag from the navigation tree does not remove any Oracle Database Appliance targets from Oracle Enterprise Manager. For information about removing a target see "Removing an Oracle Database Appliance Target."
Monitoring Individual Oracle Database Appliance Targets
URL links are used to display the names of the Oracle Database Appliance systems, and clicking a link opens the page for monitoring that individual system.
-
From the Targets menu, select Oracle Database Appliance.
Oracle Enterprise Manager displays the Oracle Database Appliances page showing all the available targets.
-
Select All ODA in the navigation tree on the left side of the page.
The systems are listed under the expanded All ODA group.
-
Select the link corresponding to the system you want to monitor.
The target page opens as shown here.
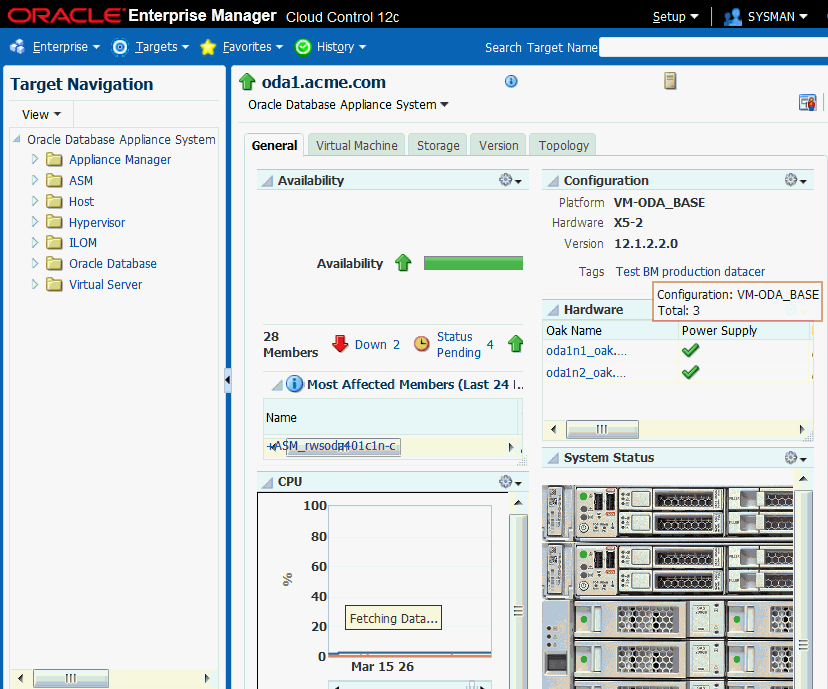
Description of the illustration ''target_home.gif''
Available Data for an Individual Oracle Database Appliance Target
You can monitor all components of the Oracle Database Appliance. Oracle Database Appliance monitors all subcomponent targets, whether hardware or software. This includes the hosts, databases, virtualization, ASM, and more.
On the left hand side of the individual Oracle Database Appliance, you can navigate to the specific component details which includes Appliance Manager, ASM, Host, Hypervisor, ILOM, Oracle Databases, and the virtualization components.
Oracle Database Appliance System General Tab
The General tab has several sections.
The Availability section lists the name, type, status, and availability for the last 24 hours of all of the components in the Oracle Database Appliance. The links in the Name column redirects the page to the home page of the component selected.
The Configuration section displays the platform, hardware type, software version, and tags configured for the Oracle Database Appliance.
Each tag is clickable, once clicked will redirect the page to the Oracle Database Appliance home page displaying the data pertinent to the group of systems configured with the selected tag.
The CPU chart shows the CPU utilization percentage of hosts for the last 24 hours.
The Hardware table shows the status of power supply, enclosure, cooling, and memory of each oak target. Statuses include online, offline, pending, and unknown.
You can move your mouse to the status icon to see a popup of the detailed status for each category. The Oak Name links redirect the page to the OakHome page.
The System Status is an illustration of the back panel of the Oracle Database Appliance. A green light indicates that a node is online; a red light means either the system is offline or the status is unknown. You can hover your mouse over each of the disks to see a popup displaying the status for each disk.
The Memory chart shows the memory utilization percentage of hosts for the last 24 hours.
The Incidents table lists the incidents for the selected Oracle Database Appliance. The Summary links are clickable, opening a page with details about the selected incident.
You can adjust the columns and order of the table using the options in the View menu.
You can filter the incidents by category using the Category drop-down list.
Oracle Database Appliance Target Virtual Machine Tab
The Virtual Machine tab lists information in the following six categories: Virtual Machine, Repository, Network, Vdisk, VM Template, and CPU Pool. This tab only appears in Oracle Database Appliance targets configured with Virtualized Platform environments and not in Oracle Database Appliance targets configured with Bare Metal environments.
The Virtual Machine tab has several groupings of sections. Use the list of links on the left side of the Virtual Machine tab to view each section.
When the Virtual Machine category is selected, the tab displays a summary, a list of virtual machines, and further details about virtual machine metrics.
The Virtual Machine list shows summary information for all the virtual machines created by users in the Oracle Database Appliance, including virtual machine name, memory, CPU, repository, node number, and state. You can select a virtual machine name and the detailed information is shown in the Details section to the right.
When Repository is selected, the tab displays a summary, a list of repositories, and further details about repository metrics.
The Repository list shows summary information for all of the repositories created by users in the Oracle Database Appliance, including repository name, free space, node number, and state. You can expand the repository name using the grey arrow to display the node number and state. You can select a repository name and the detailed information is shown in the Details section to the right.
When Network is selected, the tab displays a list of VLANs and related summary information, including name, interface, node number, and ID.
You can select a VLAN name to display the list of virtual machines attached to the VLAN in the Details section to the right.
When Vdisk is selected, the tab displays summary information about vdisks created by users, including the repository, name, size, and type. You can select a vdisk name to display detailed information in the Details section to the right.
When VM Template is selected, the tab displays summary information for all the virtual machine templates created by users in the Oracle Database Appliance, including template name, memory, CPU, and repository. You can select a template name to display detailed information in the Details section to the right.
When CPU Pool is selected, the tab displays all of the CPU pools for node 1 and node 2 in the Oracle Database Appliance. You can click a pool name to display details about the Node1 and Node2 CPUs in the Details section to the right.
Oracle Database Appliance Target Storage Tab
The Storage tab displays all of the physical disk and ASM disk information. On the left, the pie charts and lists show the number of disks and their statuses. You can select a disk name to display detailed information for an individual disk in the Details section to the right.
Oracle Database Appliance Target Version Tab
The Version tab displays a list of the component versions on the Oracle Database Appliance target.
Viewing Oracle Database Appliance Topology
The Oracle Database Appliance plug-in provides a Topology Viewer that allows you to view the relationships between the components within the Oracle Database Appliance. You can zoom, pan, see selection details and summary information, and evaluate aggregate components. Unique icons are used for each object type, and standardized visual indicators are used across all applications.
Select the Topology tab of the Oracle Database Appliance home page or system page to view the topology of the system by group or individual target. Groups are a collection of Oracle Database Appliance systems. The individual targets define one physical Oracle Database Appliance that consists of several components including hosts, databases, virtual machines, and more.
To view the topology of an existing Oracle Database Appliance target:
-
From the Targets menu, select Oracle Database Appliance.
Oracle Enterprise Manager displays the Oracle Database Appliances page showing all the available targets.
-
From the Oracle Database Appliance page, select the Oracle Database Appliance target (group or individual system) whose topology you want to view.
-
Select the Topology tab.
You can click an element in the Topology and view data associated with the element.
Each Oracle Database Appliance system tree node has three children: Hosts, Databases, and Virtualization. You can click the system tree node to open a popup which contains information about the system, including system name, availability, and a list of components and their statuses.