You can create a filter that restricts the objects displayed in a visualization filter. (A visualization filter updates the data displayed in a visualization; for background information, see Creating a filter for the data on a visualization.)
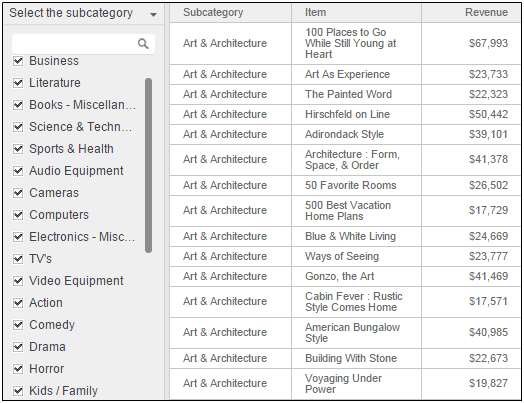
For example, the grid shown below displays revenue values for items. The filter on the left lists product subcategories. When you select a subcategory in the filter, only the items in the selected subcategory are displayed in the grid. Note the scrollbar in the filter—there are too many subcategories to display all of them in the filter at the same time.

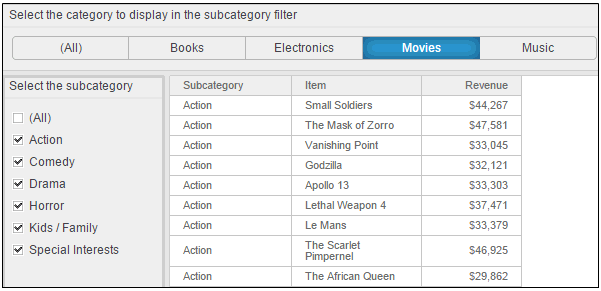
To reduce the number of subcategories that have to be displayed in the filter, add a second filter, on product category, that targets the subcategory filter. When you select a category in the category filter, the grid is not affected, but only the subcategories in the selected category are displayed in the subcategory filter. In the example below, Movies is selected in the category filter. Only movie subcategories are displayed in the subcategory filter.

Notice that the titles of these two filters help describe how the filters work together.
For steps to create a filter that restricts the objects displayed in a filter that targets a visualization, see Creating a filter on the data in a visualization or another filter.
Creating a filter on the data in a visualization or another filter
Creating a filter for the data on a visualization
Limiting the data displayed in a dashboard: Filters, sheets, and pages
_____________________________
Copyright © 2019, Oracle and/or its affiliates. All rights reserved.
Legal Notices