By default, the aggregation and subtotal behavior for derived metrics on a dashboard or document is automatically determined. (Dynamic aggregation is the roll-up of metric values that occurs when an attribute is removed from a visualization or document.) If you need a different calculation than the values provided by the default automatic behavior, you can use manual mode. Manual mode allows you to specify whether the derived metric is calculated using the whole dataset (the base) or the data in the visualization or document section that it is placed on.
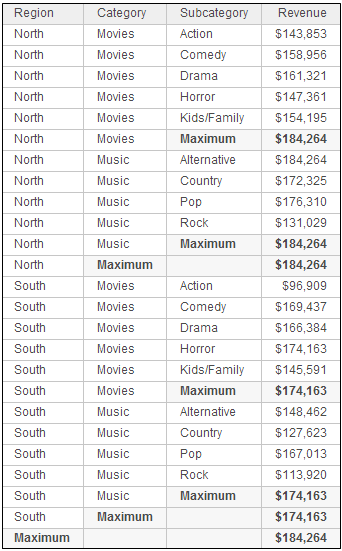
For example, a dataset in a dashboard contains Region, Category, and Subcategory, with the Revenue metric. The Grid visualization is subtotaled at the Category and Region levels, returning the maximum revenue in the category or region, as shown below. (The subtotal values will help you understand the dynamic aggregation that occurs later.)

You create two derived metrics, returning the maximum revenue at the level of Region:
The Max Revenue (visualization) metric uses the attributes on the visualization when dynamic aggregation is triggered.
The Max Revenue (base) metric uses the attributes on the dataset (the base) when dynamic aggregation is triggered.
Remove the subtotals from the grid and add the derived metrics. Remove Subcategory from the grid, to trigger dynamic aggregation. The new grid is shown below:

Notice that the two Max Revenue metrics return different values. The Max Revenue (visualization) metric is returning the maximum revenue value from what is displayed on the visualization. That is, the metric is choosing between the two revenue values for each region. The Max Revenue (base) metric returns the maximum revenue value at the subcategory level (which is the level of the dataset or base), the same as the subtotals calculated in the previous grid.
You must have Edit Dashboard and Run Dashboard privileges.
To change the aggregation and subtotal behavior of a derived metric:
Click the name of the dashboard or document to open it.
Right-click the derived metric and select Edit. The Metric Editor opens.
Click Properties. The Metric Options dialog box opens.
From the Aggregation and Subtotal Behavior drop-down list, select Manual.
By default, the derived metric is aggregated at the level of the attributes on the visualization or document. To aggregate it at the level of its dataset, select the Aggregate From Base check box.
By default, the derived metric is subtotaled at the level of the attributes on the visualization or document. To subtotal it at the level of its dataset, select the Subtotals From Base check box.
Click OK to return to the Metric Editor.
Click Save to save your changes.
Creating a metric based on existing objects: Derived metrics
Editing or deleting derived metrics in a dashboard
_____________________________
Copyright © 2019, Oracle and/or its affiliates. All rights reserved.
Legal Notices