8 Administering Oracle API Manager
This chapter describes administration tasks for Oracle API Manager.
The following topics are covered:
8.1 Viewing Subscription Statistics Using the Subscriptions Page
You can view subscription statistics for users and for APIs. User subscription statistics display the applications created for each user and the APIs subscribed to these applications.
This section describes how to view subscription details. The tasks described here are performed by users with the APIApplicationAdministrator role using the API Manager Portal.
8.1.1 Viewing a User's Subscriptions
You can view each user's created applications and the APIs subscribed to these applications.
To view a user's subscriptions:
8.1.2 Viewing API Subscription Details
You can view the users and applications that subscribe to an API.
To view API subscription details:
- From the Subscriptions page, click APIs to display the APIs panel. Each API with subscriptions is displayed. The APIs panel displays the number of users that have subscribed to and the number of subscriptions to each API.
- Click the Details icon for an API to display the Usages tab of an API detail page. This page lists all users and applications that subscribe to this API.
8.2 Viewing Analytics in Oracle API Manager
You can view usage and performance analytics statistics in the API Manager Portal. The tasks described here are performed by users with the APIApplicationAdministrator role.
Note:
You may have to enable API Analytics, as described inEnabling API Analytics , for analytics data to populate in API Manager.
8.2.1 Enabling API Analytics
You must enable the Monitoring operational setting for proxy services in Fusion Middleware Control to enable analytics information in API Manager.
Note:
Analytics are available only for services for which the Monitoring operational setting is selected. If you are having difficulty accessing analytics information, ensure that monitoring is enabled for each service for which you want API analytics.
To enable API Analytics:
8.2.2 Viewing Simple Analytics for an API
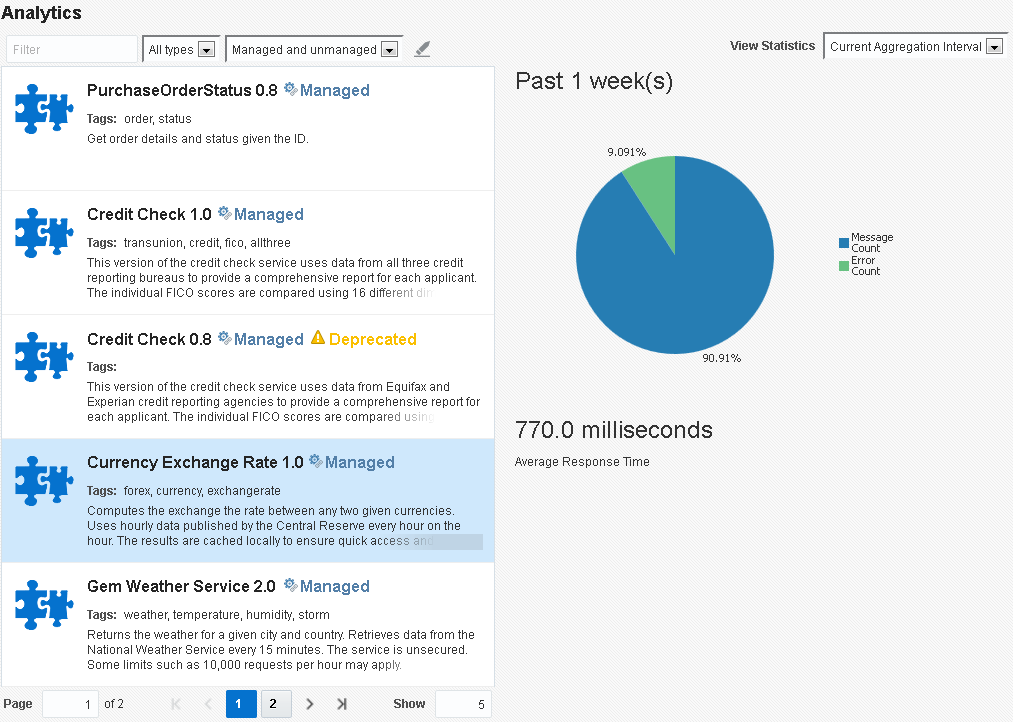
You can view simple analytics for an API using the Analytics page. A graph representing the total message count and the error message count received over the aggregation interval and the average response time (in milliseconds) is displayed for the API you select.
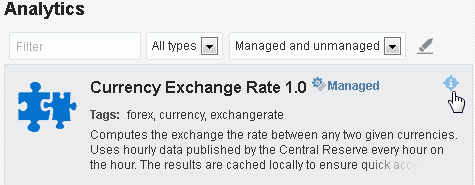
To view analytics for an API, from the Analytics page, click the Details icon for the API for which you want to view simple analytics data, as shown in the following figure.
The data is displayed in the pane on the right side of the page, as shown in the following figure.
The analytics displayed are determined by the option selected in the View Statistics list. Select Current Aggregation Interval to display analytics for only the current aggregation interval (the Time Period displayed on the detail page), or select Since Last Reset to display analytics statistics since the last reset.
8.2.3 Viewing Detailed Analytics for an API
You can view more detailed statistics for an API on its detail page. The data on an API detail page is described in Analytics Data Displayed on API Detail Pages.
To view detailed analytics for an API:
- From the Catalog page, find the API for which you want to view detailed analytics data.
- Click the Details icon of an API, and then click the Details tab to display its details page.
- (Optional) From the View Statistics list, select Current Aggregation Interval to display analytics for only the current aggregation interval (the Time Period displayed on the detail page), or select Since Last Reset to display analytics statistics since the last reset.
8.2.4 Analytics Data Displayed on API Detail Pages
The API Detail page displays the following status for an API:
Managed Status: Indicates whether the API is managed or unmanaged.
Deprecation Status: Indicates whether the API is deprecated or undeprecated
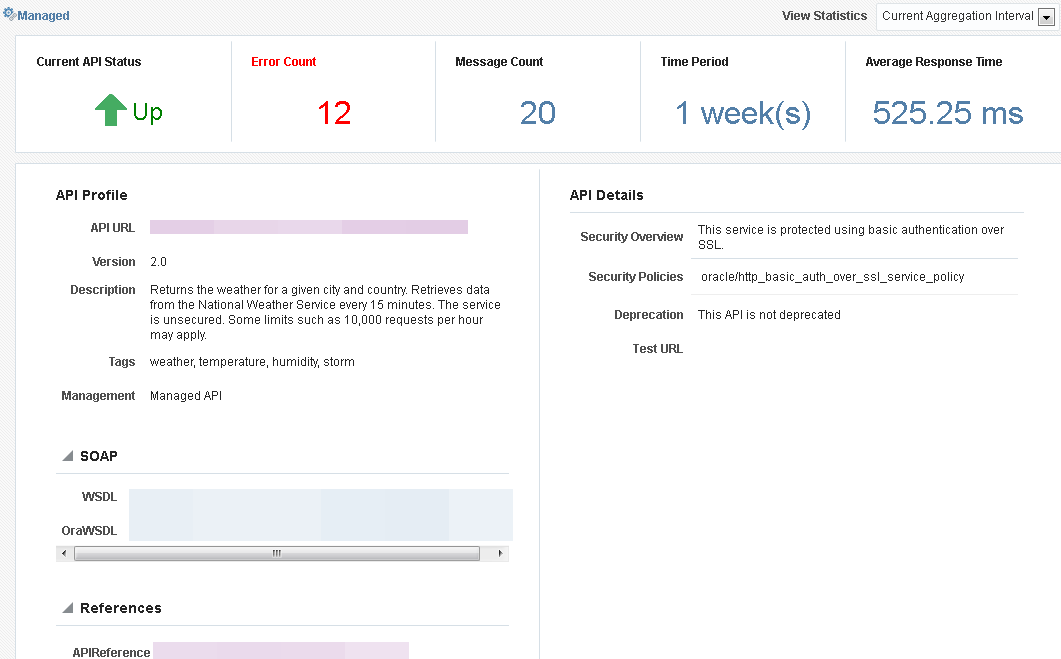
A sample API Detail page is displayed in the following figure.
The API Detail page displays the following analytics:
Current API Status: Indicates whether the API is up or down.
Error Count: Displays the number of errors received when invoking this API.
Message Count: Displays the number of messages received from the API.
Time Period: Displays the length of time for which the displayed data has been aggregated.
Average Response Time: Displays the average message response time (in milliseconds). See "Configuring Operational and Global Settings" in Administering Oracle Service Bus for more information about changing the aggregation interval.
The analytics displayed are determined by the option selected in the View Statistics list. Select Current Aggregation Interval to display analytics for only the current aggregation interval (the Time Period displayed on the detail page), or select Since Last Reset to display analytics statistics since the last reset.
The API Detail page also displays the following metadata:
| Element | Description |
|---|---|
API Profile |
Displays basic metadata associated with an API. |
API URL |
Links to the URL of the API. |
Version |
Displays version information for the API |
Description |
Contains a detailed description of the functionality of an API. |
Tags |
Lists tags associated with the API. |
Management |
Indicates whether the API is managed or unmanaged. |
SOAP |
Displays links for the associated WSDL file. Note: this region is displayed only for WSDL-based SOAP APIs. |
WSDL |
Displays a link to the WSDL file. |
OraWSDL |
Displays a link to the OraWSDL file, if applicable. |
REST |
Displays a link to the WADL file Note: This region is displayed only for REST APIs. |
References |
Displays external documentation references and other information sources for the API. |
API Details |
Displays additional details for the API. |
Security Overview |
Displays an overview of the Global security policies attached to this API. |
Security Policies |
Displays the security policies attached to this API. Hover over a policy and click its Details icon to display a policy's description. |
Deprecation |
Indicates whether the API is deprecated or not deprecated. |
Testing |
Displays the testing URL for the API. |
8.3 Importing and Exporting APIs and API Curation Metadata
When moving from a one environment to another environment, you must export the APIs and the API metadata from the first environment, and then import the data into any additional environments. To help you migrate the data to additional environments, Oracle API Manager exposes Import and Export functions.
This section describes using the import and export functions and provides sample WLST scripts for use in migrating the APIs and API metadata from a test to a production environment. The tasks described here are performed by users with the Deployer or IntegrationAdministrator roles.
8.3.2 Sample Script for Exporting Curation Metadata
The following example displays a sample exportCuration.py script that can be modified and used for exporting curation metadata from the Service Bus Console.
Example - Sample exportCuration.py Script for Exporting Curation Metadata
from oracle.apimanager.importexport import CatalogExportPlan

hostname = sys.argv[1]
port = sys.argv[2]
username = sys.argv[3]
password = sys.argv[4]

connect(username, password,'t3://'+hostname+':'+port)

domainRuntime()
cd('DomainServices/AdminService')

print '*********Exporting curation metadata...'
#export curation metadata for all projects
explan=CatalogExportPlan()

filename='<file_path>/<file_name>'

print '*********Exporting curation metadata to' + str(filename)
exportedjar=cmo.exportCatalog(explan)
exportfile=open(filename, 'wb')
exportedjar.tofile(exportfile)
exportfile.close()
print '*********Export curation metadata finished...'

print '*********Exiting...'
exit()
8.3.4 Sample Script for Importing Curation Metadata
The following example displays a sample importCuration.py script that can be modified and used for importing curation metadata into the Service Bus Console.
Example - Sample importCuration.py Script for Importing Curation Metadata
from oracle.apimanager.importexport import CatalogImportPlan
from java.util import HashSet

hostname = sys.argv[1]
port = sys.argv[2]
username = sys.argv[3]
password = sys.argv[4]

connect(username, password,'t3://'+hostname+':'+port)

domainRuntime()
cd('DomainServices/AdminService')

print 'Importing curation metadata...'
implan=CatalogImportPlan()

#select projects to be imported
#if project set is empty, all projects will be included
projects=HashSet()
projects.add('SOAPProject')
implan.setProjects(projects)

print 'import plan: '
getproj=implan.getProjects()
for gp in getproj:
	print str(gp)

jar=open('<file_path>/<file_name>', "rb").read()

result=cmo.importCatalog(jar,implan)
jar.close()
print 'Import curation metadata finished...'

print '*********Printing All entries in archive...'
content=result.getContent()
for ct in content:
	print ct.getFullName()

print '*********Printing imported entries...'
importset=result.getImported()
for ref in importset:
	print ref.getFullName()

print '*********Printing skipped entries...'
skipset=result.getSkipped()
for skref in skipset:
	print skref.getFullName()

print '*********Exiting...'
exit()


