29.7 Using the Services Dashboard
The services dashboard provides a brief summary of all service related information in a single place. It provides a consolidated view of critical aspects of a service such as availability, performance, SLAs associated with the service, status of key system components, and so on.
29.7.2 Viewing the Dashboard Details Page
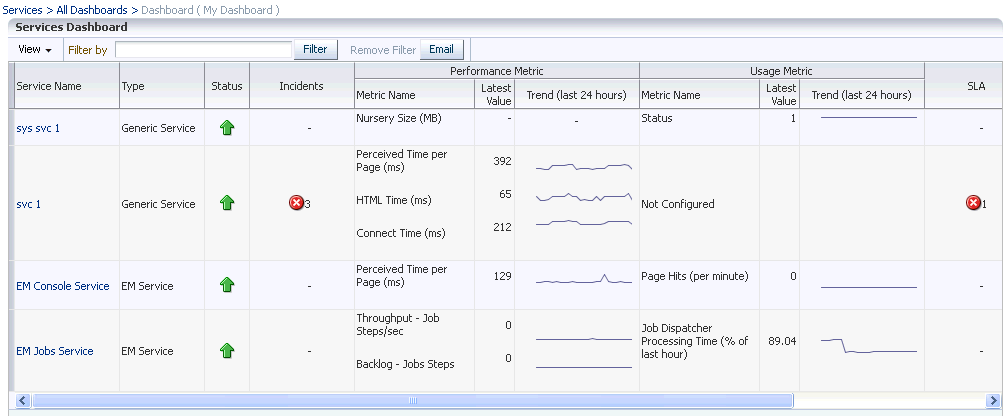
This page displays the following details:
-
Service Name: Click on the link to drill down to the Service Details page.
-
Incidents: Any incidents that have occurred.
-
Performance / Usage Metric: The name of the performance and usage metrics available for the service and the latest value of each metric is displayed. The Trend charts show the metric trend over the last 24 hours. Click on the Trend chart to see a detailed view over the trend.
-
SLA: Shows the number of enabled SLAs that are in Active, Critical or Warning state.
-
Key Components: Shows the key targets that are up or available for this service.
-
System Incidents: Any incidents that have occurred for the underlying systems of the service are displayed.
Figure 29-6 Services Dashboard

You can filter the list of services that are listed in the dashboard. Specify a value in the Filter By field and click Filter. The filter will be applied on each row in all the services and the resulting list is displayed.
You can email a dashboard to one or more email addresses. Click Email and enter the email address and the subject of the dashboard. Click Send. This feature works only the htttp mode.
29.7.3 Customizing and Personalizing the Dashboard
You can customize a dashboard and make the changes available to all users. To customize a dashboard, select a row on the All Dashboards page and click Customize.
Note:
The following privileges are required to cr
To add one or more services to the dashboard, click the Wrench icon. The Component Properties: Services Dashboard window appears. Select the type of service that you want to add to the dashboard and click Search. A list of services is displayed in the Available Targets table. Select one or more services that you want to add, move them to the Selected Targets table and click Apply. To add metrics to the respective services click on the Metrics tab and select the respective services to add metrics and click OK. The selected services and metrics now appear in the Services Dashboard table.
To delete a service target from the dashboard, select the row and click the Wrench icon. The Component Properties: Services Dashboard window appears. Deselect the services and metrics that are to be removed from the dashboard, click Apply and then click OK. To reset the changes you have made to the dashboard, click Reset Page. Any changes that have been made to the dashboard will be removed permanently. Click Close to exit the Edit mode.
You can make specific changes to a dashboard to suit your requirements. Click the Personalize icon and add or delete one ore more services from the dashboard. The changes that you make will be visible only to you and the other users cannot see the changes.
29.7.4 Viewing the Dashboard Service Details Page
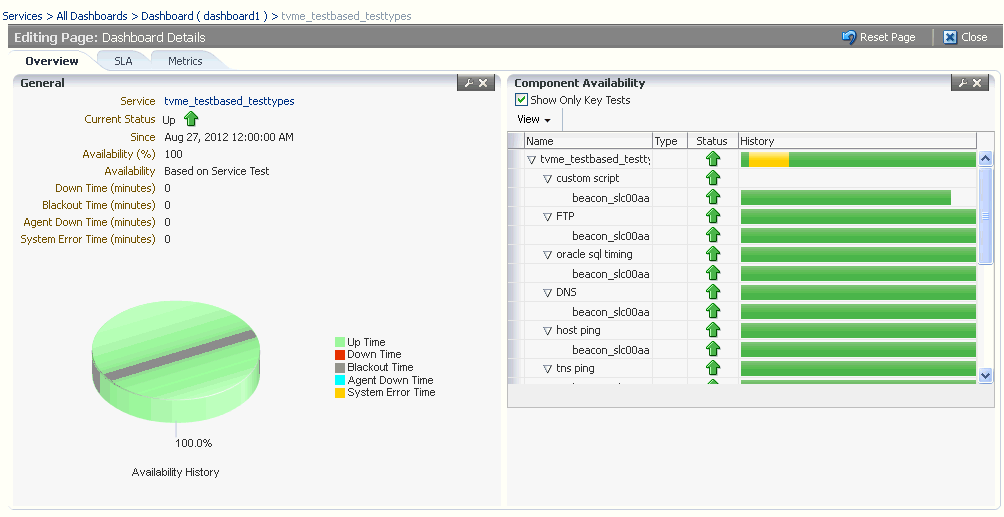
This page shows detailed information for the selected service.
Figure 29-7 Dashboard Details Page

It contains the following tabs:
-
Overview: This tab provides a brief overview of the selected service. Click on the Service link to drill down to the Service Home page. It contains the following regions.
-
General: This region shows the name of the service, status, date from which the service is available, availability percentage, type of service (test or system based), down time, and error time. Click on the service name to drill down to the Service Home page.
-
Component Availability: This region shows the status of the components in the service. It shows the status of the component and the date from which the service has been Up. Select the Show Only Key Tests check box to view only the key service tests
-
-
SLA: Shows a list of SLAs that have been enabled for this service. The name, status and the date from which the SLA is applicable is displayed. The SLA history over the last 7 days is also displayed.
-
Metrics: This tab shows the performance and metrics charts that have been defined for this service. It also shows the incidents that have occured for the service and the underlying systems on which the service is based.