31.1 Overview of Enterprise Manager Systems Infrastructure
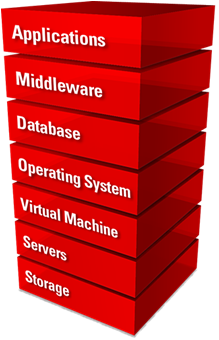
A host is a computer where managed databases and other services reside. A host is one of many components or targets that Oracle Enterprise Manager Cloud Control monitors. Oracle Enterprise Manager Cloud Control is an enterprise-level data center management solution for the Oracle product stack, from applications to storage disks, as shown in Figure 31-1.
The Enterprise Manager Systems Infrastructure (EMSI) plug-in is a fully integrated software plug-in that provides monitoring and an enterprise-wide view the bottom half of the stack, including Oracle Solaris and Linux operating systems, virtualized operating systems (zones) and virtual machines (logical domains), servers, storage appliances, storage for a host, and network resources.
The Oracle Enterprise Manager Cloud Control console interface provides detailed information about managed components and shows the relationship between the components. You can drill down to view greater details about specific components or metrics.
For server targets, you can view server details, including power usage, network information, service processor configuration, and fan and temperature information. Other hardware targets include chassis, racks, power distribution units, and network equipment. You can view the storage resources and their components for a host or a storage appliance, including storage pools, storage hardware, filesystems, logical volumes, and Logical Units (LUNs).
For Oracle Solaris and Linux operating system targets, you can view resource and process information, top consumers, performance, and open incidents details. In addition, you can view details about Oracle Solaris alternate boot environments and zones.
When you use Oracle VM Server for SPARC to virtualize hardware or Oracle Solaris to virtualize operating systems, the details appear on virtualization platform pages. Virtualization platform pages provide high-level details such as overall guest, CPU and memory, incident, and configuration information. You can drill down to individual virtual server pages to view metrics specific to a selected logical domain or zone.
The Enterprise Manager Systems Infrastructure also provides a view of Oracle SuperCluster engineered systems. Oracle SuperCluster integrates SPARC compute nodes, an Oracle ZFS Storage Appliance, InfiniBand switches, PDUs, and Exadata Storage Servers into a multi-rack system. You can view all of the components of an Oracle SuperCluster including Compute Nodes, Exadata Storage Servers, InfiniBand Switches, Power Distribution Units, and ZFS Storage Servers. You can expand the Compute Nodes to view the logical domains and zones.
31.1.1 About Monitoring for the Systems Infrastructure Targets
A series of monitoring rules and parameters monitor your managed targets. Alerts and incidents are raised for resources that are not performing as expected.
Each target has a dashboard that displays details based on the target type. All dashboards show the number of warning, critical, and fatal open incidents with links that enable you to drill down to the Incident Manager for the specific incident.
A Management Agent deployed on the host gathers information and keeps track of activity, status, performance and the health of the targets. You can view metrics for the following discovered Oracle target types:
-
Servers
-
Storage servers
-
Networks
-
Racks and power distribution units (PDUs)
-
Oracle Solaris and Linux operating systems
-
Oracle Solaris Zones
-
Oracle VM Server for SPARC and logical domains
-
Oracle SuperCluster engineered systems
31.1.2 About Dynamic Views for the Systems Infrastructure Targets
Depending on the type of target, a target home page might include graphs, charts and tables to provide greater detail at a glance. The home pages of more complex targets include dynamic photorealistic views and relationship charts. In some cases, you can interact with the images to better understand how hardware is deployed and how resources are utilized.
The following charts and views enable you to assess a target quickly and determine the relationships at a glance:
-
Relationship Chart: Displays how resources are allocated among guests. For example, the Systems Infrastructure Virtualization Platform page of an Oracle VM Server for SPARC includes a Core Distribution tab that displays the vCPU and core allocation. The chart contains concentric circles with segments that display which CPUs and cores are allocated to which guests, and which CPUs and cores are not allocated. You can click a guest in the outer ring to view detailed information about that guest's resource consumption.
-
Photorealistic View: Displays the components and ports of a hardware target, and if there are open incidents. For example, the Oracle SuperCluster engineered system monitoring pages provide a photorealistic view, which enables you to see how the system is laid out in the rack. All active targets in the system appear in the image. You can view greater detail by hovering your mouse over a target in the image. When a component of the engineered system has an open incident, the component appears in the image with a red border.
-
Schematic View: Displays a symbolic view that displays the labels of an engineered system's components. At a glance, you can see the LED status (up, down, or blackout) and temperature of the server, ZFS Storage Appliance Server, InfiniBand Switch, and PDU in the engineered system.
