20 Using JVM Diagnostics
In particular, it contains the following:
Setting Up JVM Diagnostics
Follow these steps to set up and configure JVM Diagnostics:
Note:
JVMD Load Balancers information is also displayed on the Setup page. The table includes Load Balancer URL, its status, and a list of engines associated with it.
Configuring the JVM Diagnostics Engine
You can configure the JVM Diagnostics Engine by defining engine parameters and advanced settings. You can then create new idle thread rules and system call rules. Operations on existing rules include importing and exporting a rules, as well as deleting a rule.
Configuring JVMs and JVM Pools
You can group sets of JVMs into JVM pools that provide monitoring information across all related JVMs in a single view. You can view all the JVM pools in the WebLogic Domain, create a new JVM pool, and edit existing JVM pools.
-
From the Setup menu, select Middleware Management, then select Setup. Select the JVM Diagnostics Engine row in the RUEI/JVMD Engines table and click Configure.
-
Click the JVMs and Pools tab. The list of all available JVM pools is displayed. For each pool, you can set the Poll Enabled flag and specify the Poll Interval. If the Polling Enabled flag is set to Yes, JVMs belonging to this pool will be polled for active requests periodically based on the Poll Interval.
-
Click Create Pool to create a new pool.
-
In the Create New JVM Pool dialog box, enter the name and description of the JVM pool.
-
In the Poll Interval field, specify the sample interval for JVMs belonging to this pool when monitoring (polling) is enabled.
-
Check the Poll Enabled check box to poll the JVMs belonging to this pool.
-
Click Create to save the JVM Pool information.
-
-
To delete a pool, highlight the pool click Remove.
-
Select a JVM Pool or a JVM and click Details to view additional details about the JVM Pool or JVM.
-
Click Downloads to download JVM Diagnostics components. You can download the following components:
-
JVMD Agent: Contains JVM Diagnostics Agent binaries for all supported platforms.
-
LoadHeap: Contains scripts to upload heap snapshots to the repository.
-
Load JFR: Contains scripts to upload JFR snapshots to the repository. Use JMC (Java Mission Control) to download and analyze the JFR snapshot.
-
-
Select a JVM Pool or a JVM and click Configure.
For JVM Pools, see Configuring a JVM Pool for details.
For JVMs, see Configuring a JVM for details.
Configuring the Heap Analysis Hosts
Please note the following:
Note:
The analysis and load heap steps have significant memory requirement on the Heap Analysis Host. Ensure you have a 64-bit JVM and sufficient free memory on the Heap Analysis Host.
To configure the heap analysis hosts, follow these steps:
Accessing the JVM Diagnostics Pages
From the Targets menu, select Middleware, and click on a Java Virtual Machine Pool or Java Virtual Machine target. The Home page for the target is displayed.
To start using JVM Diagnostics, select the appropriate option from the Java Virtual Machine Pool menu.
You can also access the JVM Diagnostics pages from the WebLogic Server, WebLogic Domain, JBoss Server, or Cluster target Home pages. To do so, click on a target to navigate to the Home page. From the Target menu, select Diagnostics, then select the appropriate JVM Diagnostics menu option.
Managing JVM Pools
You can group sets of JVMs into JVM pools that provide monitoring information across all related JVMs in a single view. You can monitor all the JVMs in a pool, view historical and real time data for the JVM pool, manage threads and heap snapshots, create a new pool, and edit an existing JVM pool. JVMs and JVM Pools are now targets in Enterprise Manager. You can do the following:
Viewing the Java Virtual Machine Pool Home Page
The Java Virtual Machine Pool Home page shows the summary and configuration information of all the JVMs in the JVM pool.
It shows the following details:
-
Summary: Shows whether polling is enabled and the Polling Interval. It also shows the number of incidents and the number of configuration changes. Click the incident number to drill down to the Incident Manager page
-
Availability: This region shows the availability status of the members in the JVM Pool. Click on a Member link to drill down JVM Home Page.
-
JVM Activity (Last 15 Minutes): This region shows the active threads for each JVM in the pool. You can also select the following JVM Activity graphs: Active Thread States, Memory Utilization, CPU Utilization, GC Overhead, and Response and Load.
-
Overview (Last 15 Minutes): This region shows the status for the last 15 minutes for each JVM in the pool. The current activity of the JVM including CPU usage, memory, average number of threads waiting for a database response, network response, or average number of threads waiting for synchronization lock, idle threads, and configuration changes are displayed. Additional information includes: Target Status, Diagnostics Findings, GC Overhead %, Host CPU Usage. MAX JVM Heap Used %, Major GC Count, Minor GC Count, Major GC Time (ms), Minor GC Time (ms), Host, OS, Vendor, JVM Version, Min Heap Size (MB), Max Heap Size (MB), Open File Descriptor (%), Swap Space (%), Host Memory (%), Context Switch (per sec), and OSR.
If JVMs displayed are present in different WebLogic domains, you can view the WebLogic Domain and the host on which the JVM is running. Click on the JVM link to drill down to the JVM Home page.
-
Top Requests (Last 15 Minutes): This region shows the top requests for each JVM in the pool. Statistics include: JVM time, JVM CPU, thread allocation, count, maximum duration of each request, the average duration of each request, throughput (per minute) and minimum duration (ms).
Promoting JVM Diagnostics Events to Incidents
An event is a notable occurrence detected by Enterprise Manager that is related to target, job, monitoring template at a particular point in time, which may indicate normal or problematic behavior. Example for events – database target going down, performance threshold violation based on metrics, unauthorized change in the application configuration file changes, failure in job execution, and so on.
An incident is an event or set of closely correlated events that represent an observed issue requiring resolution, through (manual or automated) immediate action or root-cause problem resolution.
By default JVM Diagnostics events are not promoted to incidents and will not appear in the JVM Pool or JVM Home page. To promote events to incidents, follow these steps:
- From the Setup menu, select Incidents, then select Incident Rules.
- Click Create Rule Set. In the Create Rule Set page, in the Targets region, select the All Targets of types option. Select Java Virtual Machine and Java Virtual Machine Pool target types.
- Click Create in the Rules region and in the Select Type of Rule to Create window, choose Incoming events and updates to events option and click Continue. The Create New Rule: Select Events page appears. In the Type drop down list, select JVM Diagnostics Threshold Violation.
- Then select Specific events of type JVM Diagnostics Threshold Violation.
- Click Add. The JVM Diagnostics Threshold Violation Rule window appears. Select the JVM Diagnostics metrics that will trigger threshold violation events. These events will be promoted to incidents. Click OK. Click Next, review the rules, and click Continue to save the rule. All events that match the criteria will be promoted to incidents and will appear in the JVM Diagnostics Pool Home page.
Viewing the JVM Pool Live Thread Analysis Page
This page shows the real-time data for all the JVMs in the selected pool. This data is useful in analyzing the various active and idle threads on the JVM. During analysis you can drill down from the thread level to methods used in the thread to local variables that are part of the method.
From the Targets menu, select Middleware, and then click on a Java Virtual Machine Pool target. Select the Live Thread Analysis option from the Java Virtual Machine Pool menu.
This page shows the following:
-
JVMs: This table shows the list of JVMs and the current status of each JVM. The current activity of the JVM including CPU usage, memory, number of threads waiting for a database response, number of threads waiting for synchronization lock, and other details are displayed
-
JVM Threads: This table shows a list of all the threads running in the selected JVM. For each thread, the following details are displayed:
-
Thread Name: Name of the thread. Click on the link to view the JVM Stack.
-
Request: Application request being processed by the thread.
-
OS PID: Operating system and Thread IDs for this thread.
-
Current Call: Lowest user method being executed by the thread.
-
File Name: Name of the file that contains the class and method for the current call.
-
Line: Line number in the method currently being executed.
-
State: The current state of the thread. This can be DB Wait, RMI Wait, or Network Wait.
If the ADP or DMS is configured, the Request Name and Request Age values are displayed.
If a thread is in the DB Wait State, the Waiting On column displays the name of the database the thread is waiting on, and the time the thread has to wait is displayed in the Waiting Time column.
Click the link to view the database diagnostics details. See Performing Cross Tier Analysis for more details.You can track database issues and determine the application request responsible for the database activity. You can also view the complete call stack including the method and line number information.
Note:
To view the database diagnostics details, ensure that:
-
The JVM Diagnostics Agent is running on the JVM that initiated the request.
-
The monitored database must be registered by the JVM Diagnostics Engine.
-
-
Additional columns include: App Name, Module Name, Work Manager, Frames Count, Is Stuck, Is Hogger, Read Characters, Write Characters, Blocked Count, Blocked Time (ms), Wait Count, Waited Time (sec), IO File Name, OS Thread ID, Age (ms), Waiting Time (sec), Lock Held, ECID, RID, User, Session, and Is Idle.
You can do the following:
-
Export: Select a thread and click Export to export the thread details along with thread stacks information to an Excel file.
-
Search/Filter: To minimize the number of reported rows, in the Search field select the column name and then provide a filter. For example, select Thread Name then type the word job. The search reports on threads that include the word job.
-
Show Idle Threads: Select this check box to list all the Idle Threads in the JVM Threads table.
-
Detach: Select a thread and click Detach to view the table in a separate window.
-
Take Snapshot of Selected Thread: Select a thread, and from the Action menu, select Take Snapshot of Selected Thread. The Thread Snapshot page is displayed. You can configure the snapshot settings and click Take Thread Snapshot. A snapshot file with details of the selected thread is generated. From the Java Virtual Machine Pool menu, select Thread Snapshots to view additional details.
-
Take Snapshot of Active Threads: This option allows you to take a snapshot of all the active threads. From the Action menu, select Take Snapshot of Active Threads, the Thread Snapshot page is displayed. You can configure the snapshot settings and click Take Thread Snapshot. A snapshot file with details of all the active threads is generated. From the Java Virtual Machine Pool menu, select Thread Snapshots to view additional details.
-
View Thread History: Select a thread and from the Action menu, select View Thread History. The historical data for the thread for the selected time interval is displayed on the Java Workload Explorer page.
-
Mark Idle: Select a thread and from the Action menu, select Mark Idle. The selected thread will be marked as Idle based on the Idle Thread Rule and will no longer be collected in the monitoring data. Marking a thread idle in JVMD will not affect the OS or JVM thread management.
-
Mark Active: Select an Idle thread and from the Action menu, select Mark Active to change the status to Active.
-
Mark System Call: Apart from the threads defined as System Calls in the JVMD Configuration page (see Configuring the JVM Diagnostics Engine), you can mark specific threads as system calls so that JVMD will not consider the marked method as a user call method.
Select a thread from the JVM Threads table. From the Action menu, select Mark System Call to mark this thread as a System Call. All user calls that are marked in this manner will now be treated as System Calls. If you selected a marked call and click Unmark System Call, the thread will now be treated as a User Call.
-
-
Thread Info: This section shows the detailed information for a selected thread. Details of thread including Current Call, Request, ECID, State, Waiting On, and Wait Request are displayed. If the thread is in the DB Wait State, click the link to drill down to the Database Home page
-
Thread Stack: The Thread Stack table shows the details of the selected thread such as:
-
Class Method: The class and method for the stack frame. Click the link to view the method locals.
-
File: The file where the class is defined.
-
Line: Current execution point in the method. If a method is inlined or native, the line number might not be available.
You can do the following:
-
Browse Local Objects: Select a method from the table and click Browse Local Objects. A popup window is displayed which shows the local variables, objects, their classes, and values.
-
Export: You can export the details of a selected thread to a file by clicking Export. You are prompted to specify the directory in which the file is to be stored. Enter the path and click Save to save file in .csv format.
-
-
Auto Refresh: You can refresh the data that is displayed by specifying the Auto Refresh period.
You can refresh the data that is displayed by specifying the Auto Refresh period.
Configuring a JVM Pool
From the Targets menu, select Middleware, and then click on a Java Virtual Machine Pool target. Select the Configure JVM Pool option from the Java Virtual Machine Pool menu. You can do the following:
-
Modify the JVM pool details. You can enable or disable monitoring of pools or change their polling intervals by updating the pool properties. Click Save to save the changes.
-
Configure the JVM pool thresholds. See Updating Pool Thresholds.
Removing a JVM Pool
You can remove a JVM Pool from the following:
-
Middleware page: Highlight the JVM Pool and click Remove.
-
JVM Pool home page: From the Java Virtual Machine Pool menu, select Target Setup, then click Remove Target.
You will see a warning message that displays the name of the target being deleted and that when a pool is deleted, all the JVM targets in the pool are also displayed. Click Yes to delete the JVM Pool or No to return to the JVM Pool Home page.
Adding a JVM Pool to a Group
From the JVM Pool home page, select the Java Virtual Machine Pool menu. Select Target Setup, then click Add to Group...
Select this option to add the JVM Pool to one or more groups. A pop-up window appears with a list of groups on which you have Operator privileges. Select one or more groups and click Add to add the target to the group.
Managing JVMs
You can monitor a specific JVM in a pool, view historical and real time data, and so on. You can do the following:
Viewing the JVM Home Page
The JVM Home page shows the summary and configuration information of all the JVMs in the JVM pool. Follow these steps to view the JVM Home page:
Viewing the JVM Performance Diagnostics Page
This page shows the summary and detailed information for a specific JVM. To view this page:
- From the Targets menu, select Middleware, then click on a Java Virtual Machine target.
- Select the JVM Performance Diagnostics option from the Java Virtual Machine menu.
The page shows the summary details of the JVM which include the Server State Charts, Active Threads by State, Top Methods, Top Requests, Top DBWait Events, Top SQLs, and Top Databases. You can filter the data that is displayed by specifying various criteria such as State, Method, Database, Thread Name, ECID, DBWait Event, Schema Name, Request Name, SQL, and Lock. If request names are not present, enter a '/' in the Request field located in the Filter Options section. The Filter Menu for Request with a list of top requests is displayed. Select an entry from the table and click OK to set it as a filter.
Check the Ignore Filters check box if you want to ignore the specified filters. Select the Order by Duration checkbox in the Top Activities table to see the top 5 requests and SQLs by average duration.
Note:
If you choose to filter the data based on Schema Name, you must ensure that the target or custom database has been registered and database cross tier correlation has been established.
Click the Threads tab to view the Thread State Transition chart. This chart shows how the threads have transitioned from one state to the other in the selected period. You can change the time interval and move it to a different time period by using the quick time selection control at the top of the page. You can hover over the colored bars to see the transition changes from one state to the other, for example from Runnable to Not Active or to Runnable. The following server state charts are displayed:
-
Active Threads: This chart shows the status of all threads in the pool. The threads can be different states like RMI, IO, NET, DB, CPU and LOCK
-
CPU Utilization by JVM: This chart shows the CPU utilization for the JVM.
-
Heap Utilization by JVM: This chart shows the heap utilization for the JVM.
-
Garbage Collections: This chart shows the major and minor garbage collections for the JVM.
Click on a bar graph in the Thread State Transition chart to view the Sample Analyzer which provides a detailed analysis on the state of the thread. This feature allows you to analyze each sample (JVM snapshot at a specific time) in the monitored data.
In the JVM Performance Diagnostics page, you can do the following:
-
You can compare data between two periods. Select the Compared With checkbox and specify the comparison period. The data for the selected period and the current period is displayed.
-
Click the Create Diagnostics Snapshot link to collect diagnostic data for the JVM target for a specific period and analyze this data in offline. For more details, see JVM Offline Diagnostics
Viewing the JVM Diagnostics Performance Summary
You can view the performance metrics (system and active threads) for a JVM target on the Performance Summary page. A set of charts is displayed on this page for the JVM target. To view the JVM performance metrics, follow these steps:
Viewing the JVM Live Thread Analysis Page
This page shows the real-time data for a selected JVM. This data is useful in analyzing the various active and idle threads on the JVM. During analysis you can drill down from the thread level to methods used in the thread, to local variables that are part of the method. To view this page:
- From the Targets menu, select Middleware, then click on a Java Virtual Machine target.
- Click the Live Thread Analysis link at the top of the page or select the Live Thread Analysis option from the Java Virtual Machine menu.
This page shows the following:
-
JVMs: This table shows the list of JVMs and the current status of each JVM. The current activity of the JVM including CPU usage, memory, number of threads waiting for a database response, number of threads waiting for synchronization lock, and other details are displayed. JVM Process statistics include: CPU (%), Memory (%), Context Switch (per sec), and Open File Descriptors (%). Threads statistics include: CPU, DB Wait, Lock, Network Wait, IO Wait, RMI Wait, and Idle Threads.
-
JVM Threads: This table shows a list of all the threads running in the JVM. Click on a thread to view the thread details. To view all the available columns, from the View menu, select Columns, then select Show All.
Thread details include:
-
Thread Name: Name of the thread. Click on the link to view the JVM Stack.
-
Request: Application request being processed by the thread.
-
OS PID: Operating system and Thread IDs for this thread.
-
Current Call: Lowest user method being executed by the thread.
-
File Name: Name of the file that contains the class and method for the current call.
-
Line: Line number in the method currently being executed.
-
State: The current state of the thread. This can be DB Wait, RMI Wait, or Network Wait. If the thread is the DB Wait state, click on the link to view the database diagnostics details. You can track database issues and determine the application request responsible for the database activity. You can also view the complete call stack including the method and line number information.
Note:
To view the database diagnostics details, ensure that:
-
The JVM Diagnostics Agent is running on the JVM that initiated the request.
-
The monitored database must be registered by the JVM Diagnostics Engine.
-
If a thread is in the DB Wait State, the Waiting On column displays the name of the database the thread is waiting on, and the time the thread has to wait is displayed in the Wait Time column. You can click on the link in the DB Wait column to view the database diagnostics details. This is helpful in tracking database issues and determining the application request responsible for the database activity.
Note:
You can view the database diagnostics details if:
-
The JVM Diagnostics Agent is running on the JVM that initiated the request.
-
The monitored database must be registered by the JVM Diagnostics Engine.
You can perform the following actions:
-
Export: Select a thread and click Export to export the thread details along with thread stacks information to an Excel file.
-
Search/Filter: To minimize the number of reported rows, in the Search field select the column name and then provide a filter. For example, select Thread Name then type the word job. The search reports on threads that include the word job.
-
Show Idle Threads: Select this check box to list all the Idle Threads in the JVM Threads table.
-
Detach: Select a thread and click Detach to view the table in a separate window.
-
Take a Snapshot of a Selected Thread or Active Threads: Select a thread from the list and choose the Take Snapshot of a Selected Thread option from the Action menu. The Thread Snapshot page is displayed where you take a snapshot. If you select the Take Snapshot of Active Threads option, you can take a snapshot of all active threads running on this JVM. You can specify the following parameters for each snapshot:
-
Poll Interval: Interval after which snapshot should be repeated.
-
Poll Duration: Duration for which the snapshot should be taken.
-
Description: Description of the snapshot.
-
Thread Details: You can specify if the thread details need be included in the snapshot.
-
Try Changing Threads: Sometimes the stack associated with the thread may change rapidly which makes taking the snapshot difficult. If you select this parameter, you can suspend the thread and take the snapshot.
-
Include Network Waits: Specify if network wait threads need to be included in the snapshot.
-
All Threads: Specify if all threads (active and idle) must be included in the snapshot.
-
Allow Trace Interrupt: Indicate whether the trace process can be interrupted.
A snapshot file with details of the selected thread or active threads (depending on your selection) is generated. From the Java Virtual Machine Pool menu, select Thread Snapshots to view additional details.
-
-
View Thread History: Select a thread and from the Action menu, select View Thread History. The historical data for the thread for the last 30 minutes is displayed.
-
Mark Idle: Select a thread from the list and from the Action menu, select Mark Idle to mark a thread as idle.
-
Mark Active: If you selected the Show Idle Threads check box, a list of idle threads is displayed. Select a thread and from the Action menu, select Mark Active to mark it as an active thread.
-
Mark System Call: Apart from the threads defined as System Calls in the JVMD Configuration page (see Configuring the JVM Diagnostics Engine), you can mark specific threads as system calls. Select a thread from the JVM Threads table. From the Action menu, select Mark System Call to mark this thread as a System Call. All user calls that are marked in this manner will now be treated as System Calls. If you selected a marked call and click Unmark System Call, the thread will now be treated as a User Call.
-
-
Thread Info: This section shows the detailed information for a selected thread. Details of thread including Current Call, Request, ECID, State, Waiting On, and Wait Request are displayed. If the thread is in the DB Wait State, click on the link to drill down to the Database Home page. See Performing Cross Tier Analysis for more details.
-
Thread Stack: The Thread Stack table shows the details of the selected thread such as:
-
Class Method: The class and method for the stack frame. Click on the link to view the method locals.
-
File: The file where the class is defined.
-
Line: Current execution point in the method. If a method is inlined or native, the line number might not be available.
You can drill down from the method level to a lower level. You can do the following:
-
Browse Local Objects: Select a method from the table and click Browse Local Objects. A popup window is displayed which shows the local variables, objects, their classes, and values.
-
Export: You can export the details of a selected thread to a file by clicking Export. You are prompted to specify the directory in which the file is to be stored. Enter the path and click Save to save the file in .csv format.
-
Mark / Unmark System Call: You can mark a selected method as a system call. Select a method from the Thread Stack table and from the Action menu, select Mark System Call. All methods marked in this manner will be treated as system calls. If you select a marked call and click Unmark System Call, the method will now be treated as a user call.
-
-
Auto Refresh: You can refresh the data that is displayed by specifying the Auto Refresh period.
Performing Cross Tier Analysis
You can trace any JVM activity from the JVM thread to the database. You can view cross tier correlation for live threads and historical monitored data.
Before you establish cross tier correlation, ensure that the database is an Enterprise Manager target and has been registered with JVM Diagnostics. This enables you to drill-down from JVM Diagnostics pages to Database Diagnostics pages.
Note:
If a database is not registered with JVMD, the Database JDBC details, SQL statement, SQL ID, and schema name will be collected by the JVMD agent for threads in DB Wait state.
In the case where the database is not an Enterprise Manager target, you can still register the database with JVMD as a “Custom database" which will track the database activity to this database by its name. The SQL statement and SQL ID would be fetched real-time from the database but you cannot drill-down from JVM Diagnostics pages to Database Diagnostic pages.
To register the database:
-
From the Setup menu, select Middleware Management, then select Setup. Select the JVM Diagnostics Engine row in the RUEI/JVMD Engines table and click Configure.
-
Click the Register Databases tab. The list of registered databases is displayed. The database name, host, Oracle SID for the monitored database, and listener port number is displayed. You will also see a column indicating “JVMD Supported DB". If this column has a value of Yes, you can proceed with the cross tier analysis. If the column has a value of Unavailable, you cannot perform cross tier analysis because the JDBC connection to the database cannot be established.
Note:
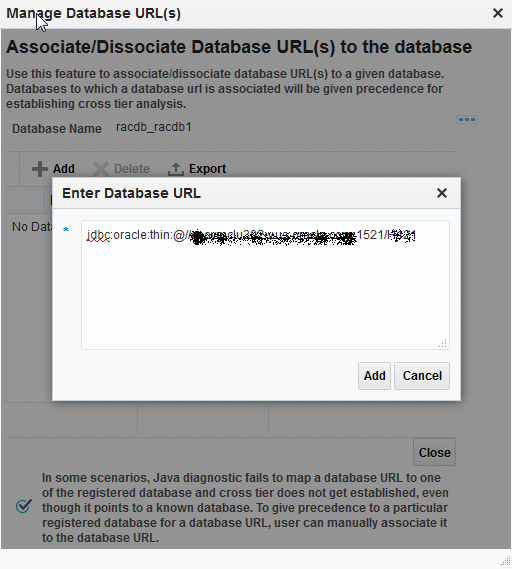
If cross tier correlation is not established even after registering the database with JVMD, select a database and click Manage DB URL. In the Associate / Disassociate a Registered Database field, select a Database URL and click Add and specify the URL of the database to be associated. After the URL has been associated with the registered database, the JVM Diagnostics Engine will start monitoring the cross-tier calls between JVM targets and the underlying database.
To view the cross tier correlation for live threads, follow these steps:
-
From the Targets menu, select Middleware, then click on a Java Virtual Machine target. Select the Live Thread Analysis option from the Java Virtual Machine menu.
-
In the JVM Threads column, select a thread with a DB Wait State.
-
The thread details are displayed in the Thread Info section. If cross tier correlation has been established, you can see
SID=<value>"SERIALNUM=<value>when you hover over the State field. Click the DB Wait link to navigate to the Database Diagnostics pages.Note:
If cross tier is not established, the Database Details popup is displayed which shows the host, port, SID, user, and JDBC URL for the target database. This can happen when the database is not registered with JVMD or if JVMD is unable to find the registered database corresponding to the JDBC URL of the database. For registering the database, click on the link in To view Register Database page click here and this will take you to the Register Databases tab. In the case where the database is already registered, associate the JDBC URL with a registered Database by clicking the link in To associate a Registered database to the above Database URL click here. This will open a popup that will enable you to associate the JDBC URL for the database with a registered database.
To view the cross tier correlation for historical monitored data, follow these steps:
Establishing Cross-Tier Correlation in Oracle RAC Databases
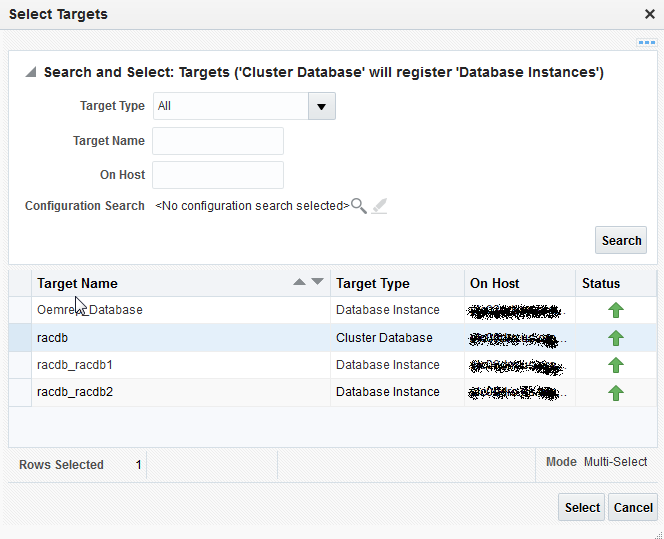
Oracle Real Application Cluster (Oracle RAC) databases have a complex configuration of database instances and listeners. User applications use Oracle RAC services to connect to the database instead of SIDs that are used for single instance databases. User applications can connect to Oracle RAC listeners that are listening on different machines than the actual database instances. For cross tier correlation to be established, all the listener and database instances must be discovered targets in Enterprise Manager. Cross tier correlation can be established by using either of the following options:
Viewing Memory Diagnostics
This page provides you the details regarding current memory pool usages and the garbage collections statistics. It also provides statistics related to the class loading and class compilations, and the means to get and save a live histogram, and view all the histograms.
Follow these steps to do a real-time analysis of the JVM heaps that have been loaded into the repository.
Working with Class Histograms
A class histogram is displayed in the form of a table when the optimization level of the jamagent is 0. The histogram displays the top 300 data rows sorted by the size. You can perform various operations on class histograms. This section describes the following:
Saving a Class Histogram
To save a class histogram, follow these steps:
- From the Targets menu, select Middleware, then click on a Java Virtual Machine target. Select the Memory Diagnostics option from the Java Virtual Machine menu.
- In the Memory Diagnostics page, click the Class Histograms tab. Click Get Live Histogram to get Class Histogram data. Click Save.
- In the Save Class Histogram window, enter a name for the snapshot and a description and click OK.
Viewing Saved Histograms
To view saved histograms, follow these steps:
- From the Targets menu, select Middleware, then click on a Java Virtual Machine target. Select the Memory Diagnostics option from the Java Virtual Machine menu.
- In the Memory Diagnostics page, click the Class Histograms tab. Click View Saved Histograms. The Available Heap Snapshots page appears.
- Scroll down to the Available Class Histograms table to view a list of saved class histograms.
Scheduling a Histogram Job
Scheduling will allow you to insert JVM Class Histogram data into the repository by running the job at the defined time. To schedule a class histogram job, follow these steps:
Comparing Class Histograms
The compare functionality allows you to compare any two class histogram snapshots listed in the table. To compare class histograms, follow these steps:
- From the Targets menu, select Middleware, then click on a Java Virtual Machine target. Select the Memory Diagnostics option from the Java Virtual Machine menu.
- In the Memory Diagnostics page, click the Class Histograms tab. Click View Saved Histograms. The Available Heap Snapshots page appears.
- Scroll down to the Available Class Histograms table to view a list of saved class histograms. Select any two class histograms and click Compare. The Compare Class Histograms page appears. The Class Name, Instance Size (size of each snapshot), and Number of Instances (for each snapshot) are displayed.
Deleting Class Histograms
To delete class histograms, follow these steps:
- From the Targets menu, select Middleware, then click on a Java Virtual Machine target. Select the Memory Diagnostics option from the Java Virtual Machine menu.
- In the Memory Diagnostics page, click the Class Histograms tab. Click View Saved Histograms. The Available Heap Snapshots page appears.
- Scroll down to the Available Class Histograms table to view a list of saved class histograms. Select the class histogram you want to delete and click Remove. A confirmation message is displayed. Click OK to delete the class histogram.
Taking a Heap Snapshot
A heap snapshot is a snapshot of JVM memory. It shows a view of all objects in the JVM along with the references between those objects. It can be used to study memory usage patterns and detect possible memory leaks. To take a heap snapshot, follow these steps:
Taking a Heap Snapshot and Loading Into the Repository
Select this option to take a heap snapshot and automatically load it into the repository.
Prerequisites
-
The Management Agent must be deployed on the host machine on which the JVM target is running.
-
The Heap Loader Host is a standalone machine (with high CPU and Memory) on which the Management Agent has been deployed.
-
DB Client Home which is the location of
ORACLE_HOMEwheresqlldr&sqllplusare present. -
There should be sufficient disk space in the system temp directory.
-
A JVM Diagnostics DB User must have been created using the
create_jvm_diagnostic_db_user script. The script is located inside loadheap.zip. You can find loadheap.zip at:$MW_HOME/plugins/oracle.sysman.emas.oms.plugin_12.X.X.X.X/archives/loadheap.zip
The script is called by loadheap.sh. If you execute the script directly, you will be asked to input the required data. There is a README.txt file inside the loadheap.zip file that provides additional information.
To take a heap snapshot and load it into the repository, follow these steps:
Analyzing Heap Snapshots
The JVM Diagnostics memory analysis feature allows you to not only find the objects responsible for the growth but also track their reachability from the root-set. With this feature, you can find the dangling reference responsible for memory leaks. To find a memory leak, you take snapshots of the JVM heap at different points in time. Between the snapshots, your JVM and Java applications continue running at full speed with zero overhead.
A heap snapshot is a snapshot of JVM memory. Each snapshot stores information about the objects in the heap, their relationships and root-set reachability. You can load the snapshots into the repository, and compare them to see where the memory growth has occurred. Click Heap Snapshots and Class Histograms from the menu in the JVM Pool or JVM Home page. The following page appears:
This page contains the following regions:
-
Available Heap Snapshots: You can specify the Target Name and Target Type to filter the heap snapshots that are displayed. You can also specify the Heap ID in the Snap Name field to search for specific heap snapshots and display them. The following details is displayed:
-
Heap ID: The identification number for the heap snapshot.
-
Date: The date on which the heap snapshot was taken.
-
JVM Name: The server on which the JVM is running.
-
Vendor: The name of the JVM Vendor.
-
Size: The total size of the Java heap. An adequate heap size helps improve the performance of the application.
-
Used: The amount of heap that has already been used.
Note:
If the heap snapshot was taken in HPROF format, the value in the Size and Used fields will be 0.
-
Used(%): The percentage of heap used.
You can do the following:
-
Click Create to take a heap snapshot. See Taking a Heap Snapshot.
-
Select a heap snapshot and click the Detail link to drill down to the Roots page. See Viewing Heap Usage by Roots.
-
Select a heap snapshot and click Load to load the heap snapshot to the repository. See Uploading Heap Snapshots.
-
Select a heap snapshot and click Reports to download heap reports to the local host. These reports must have been generated and loaded to the repository for the selected heap snapshot. You can download the Memory Leak Report and the Antipattern Report.
-
-
Available Class Histograms: The list of saved histograms with details such as date on which the snapshot was taken, Snap ID, Timestamp, JVM Name and Version, Description are displayed. See Working with Class Histograms.
Viewing Heap Usage by Roots
To view the heap usage by each class of root, follow these steps:
Top 40 Objects
This page shows the top 40 objects reachable from a root. The objects are sorted in descending order by the adjustable memory reachable from the object (or the difference of the adjusted memory reachable when comparing two heaps). This view provides a lot of rich detailed information like the amount of memory used by an object, amount of memory reachable by an object (total memory used by all the children), and number of objects reachable from a given object.
- From the Targets menu, select Middleware, then click on a JVM or JVM Pool target.
- On the JVM or JVM Pool Home page, select Heap Snapshots and Class Histograms from the Java Virtual Machine/Java Virtual Machine Pool menu.
- The list of available heap snapshots is displayed. Select a heap snapshot and click Detail to view the number of objects and memory reachable from each root. Click the Roots tab to view the objects directly reachable from the root.
- Click a root to view the top 40 objects.
The following details are displayed:
-
Signature: The signature of the object. Click on the link to drill down to the Heap Object Information page.
-
Root: This is the internal root identifier.
-
Type: The type of the object which can be Klass, Instance, Method, and so on.
-
Field:
-
Space: The heap space in which the object is present.
-
Bytes: The amount of space used by the object.
-
Len: If the object is an array, the length of the array is displayed here.
-
Children: The number of descendants reachable from the object.
-
Adj (bytes): Adjusted memory reachable from this object.
-
Retained Memory: The total size of all objects that would be removed when garbage collection is performed on this node.
-
Depth: Indicates how far this object is from the root.
Heap Object Information
This page shows information about a specific object in the heap snapshot. The following details are displayed:
-
Heap Object Information
-
Gar: Indicates whether this object is garbage or reachable from the root.
-
Space: The heap space in which the object is present.
-
Type: The type of the object which can be Klass, Instance, Method, and so on.
-
Signature: The signature of the object.
-
Bytes: The amount of space used by the object.
-
Len: If the object is an array, the length of the array is displayed here.
-
Children: The number of descendants reachable from the object.
-
Adj: Adjusted memory reachable from this object.
-
Retained Memory: The total size of all objects that would be removed when garbage collection is performed on this node.
-
Depth: Indicates how far this object is from the root.
-
-
Roots
-
Type: The type of root which can be Klass, Instance, Method, and so on.
-
Field: If the root is a local thread, this field contains information about the thread and method.
-
-
Object Children
-
Gar: Indicates whether this child is garbage or reachable from the root.
-
Space: The heap space in which the child is present.
-
Type: The type of the child which can be Klass, Instance, Method, and so on.
-
Signature: The signature of the child. Click on the link to drill down to the Details page.
-
Bytes: The amount of space used by the child.
-
Len: If the child is an array, the length of the array is displayed here.
-
Children: The number of descendants reachable from the child.
-
Adj: Adjusted memory reachable from this child.
-
Retained Memory: The total size of all objects that would be removed when garbage collection is performed on this node.
-
Depth: Indicates how far this child is from the root.
-
-
Object Parents
-
Gar: Indicates whether this parent is garbage or reachable from the root.
-
Space: The heap space in which the parent is present.
-
Type: The type of the parent which can be Klass, Instance, Method, and so on.
-
Signature: The signature of the parent. Click on the link to drill down to the Details page.
-
Bytes: The amount of space used by the parent.
-
Len: If the parent is an array, the length of the array is displayed here.
-
Children: The number of descendants reachable from the parent.
-
Adj: Adjusted memory reachable from this parent.
-
Retained Memory: The total size of all objects that would be removed when garbage collection is performed on this node.
-
Depth: How far this parent is from the root.
-
Comparing Heap Snapshots
To find a memory leak, you can take snapshots of the JVM Heap at different points in time. Each snapshot stores information about the objects in the heap, their relationships and root-set reachability. You can compare two heap snapshots to see where the memory growth has occurred.
Viewing Heap Usage by Objects
Click the Usage tab to view the heap usage by objects. The following details are displayed:
-
Object Type: The type of object, Instance, Array, Klass, and so on.
-
Garbage: Indicates if this is garbage or reachable from root.
-
Objects: The total number of objects.
-
Total Memory: The total amount of memory reachable by root.
-
System: System details.
Click Compare with to compare the heap snapshot with another one. See Comparing Heap Snapshots.
Memory Leak Report
Click the Memory Leak Report tab to view the memory leak report.
The memory leak report shows the potential memory leak sources by finding frequent patterns in the heap graph. This tab shows a list of memory leak candidates which contain the most frequent patterns in a heap and could represent potential memory leak sources. Click Download Report to download the memory leak report in .txt format.
Anti-Pattern Report
Click the Anti-Pattern Report tab. The Anti-Pattern report is divided into different sections. Each section either shows the summary or one kind of anti-pattern issue. For example, the first section contains a summary of the most acute problems detected by JOverflow. The second section contains the total number of Java classes and Java objects. It also contains a histogram for top memory usage objects grouped by the Class. The third section shows the reference chains for high memory consumers. Each anti-pattern section calculates the overhead that shows the amount of memory that could be saved if the problem is eliminated.
Managing JFR Snapshots
Java Flight Recorder (JFR) provides a wealth of information on the inner workings of the JVM as well as on the Java program running in the JVM. You can use this information for profiling and for root cause analysis of problems. Furthermore, JFR can be enabled at all times, without causing performance overhead—even in heavily loaded, live production environments.
You can create JFR snapshots that include thread samples, which show where the program spends its time, as well as lock profiles and garbage collection details.
To create a JFR snapshot, follow these steps:
Settings
To start, stop, and remove a JFR recording, highlight a JFR in the table, and click Settings.
The JFR Administration page provides the statistics of the recording: Status, Data End Time, Data Start Time, Destination Compressed, Destination File, Continuous Recording, Duration (sec), Maximum Size (KB), Maximum Age (sec), and Start Time.
View Reports
Click View Reports to view GC and Latency reports. Latency and GC reports are available when the data is detected.
Downloading a JFR Snapshot
Use JMC (Java Mission Control) to download and analyze the JFR snapshot. Select the JFR snapshot and click Download. You are prompted for the host credentials. Enter the credentials and click Download and specify the location on which the snapshot is to be saved.
Configuring a JVM
From the Targets menu, select Middleware, and then click on a Java Virtual Machine target. Select the Configure JVM Target option from the Java Virtual Machine menu. The Edit JVM Information page is displayed. You can change the JVM Pool, location of the Heap Dump Directory, and the Log Level. You can also modify the Bytecode Instrumentation (BCI). Click Save to save the changes.
Removing a JVM
You will see a warning message if you select the Remove Target option from the JVM menu. The message displays the name of the target being deleted. Click Yes to delete the JVM or No to return to the JVM Home page.
Managing Thread Snapshots
If a particular request is slow or hanging or if the entire application is slow, you can run the real-time transaction trace to view current Java application activity. You can look at the offending threads and their execution stack and analyze how much time a thread spent in waiting for DB wait or wait on a lock. Complex problems such as activity in one thread (or request) affecting the activity in the other thread or rest of the JVM can be found very quickly.
You can trace all active threads and generate a trace file that contains details such as resource usage, thread states, call stack information, and so on. During tracing, the state and stack of the target thread is sampled at set intervals for the desired duration. Follow these steps to trace active threads:
Analyzing Trace Diagnostic Images
A trace diagnostic image contains details such as resource usage, thread states, call stack information etc. The trace diagnostic image captures thread data at short intervals. If an application is hanging or is slow, you can analyze these threads and find out the application tier that causing the delay.
On the Diagnostic Image Analysis page, you can:
-
Click Description to view details of the thread snapshot being analyzed. The following Server State charts are displayed:
-
Active Threads by State: This chart shows the status of all threads in the JVM. The threads can be in different states like RMI, IO, NET, DB, CPU, and LOCK.
-
CPU Utilization by JVM: This chart shows the CPU utilization in the JVM.
-
Heap Utilization by JVM: This chart shows the heap utilization in the JVM.
-
-
You can filter the data that is displayed by specifying various criteria such as Method Name, JVM Name, Thread State, DBState, and so on. Check the Ignore Filters check box if you want to ignore the specified filters. The Active Threads by State, Top Requests, Top Methods, Top SQLs, Top DBWait Events, and Top Databases charts are displayed.
-
Click on the Threads tab to view the Thread State Transition, Metric By Active States, and Method data.
Viewing Heap Snapshots and Class Histograms
The JVM Diagnostics memory analysis feature allows you to not only find the objects responsible for the growth but also track their reachability from the root-set. With this feature, you can find the dangling reference responsible for memory leaks.To find a memory leak, you take snapshots of the JVM heap at different points in time. Between the snapshots, your JVM and Java applications continue running at full speed with zero overhead.
To view and analyze the heap usage, select Heap Snapshots and Class Histograms from the Java Virtual Machine Pool or Java Virtual Machine menu. The following regions are displayed:
-
Available Heap Snapshots: You can specify the Target Name and Target Type to filter the heap snapshots that are displayed. You can also specify the Heap ID in the Snap Name field to search for specific heap snapshots and display them. The following details is displayed:
-
Heap ID: The identification number for the heap snapshot.
-
Date: The date on which the heap snapshot was taken.
-
JVM Name: The server on which the JVM is running.
-
Size: The total size of the Java heap. An adequate heap size helps improve the performance of the application.
-
Used: The amount of heap that has already been used.
-
Used(%): The percentage of heap used.
You can do the following:
-
Select a heap snapshot and click the Detail link to drill down to the Roots page. See Viewing Heap Usage by Roots.
-
Select a heap snapshot and click Load to load the heap snapshot to the repository.
-
Select a heap snapshot and click Reports to download heap reports to the local host. These reports must have been generated and loaded to the repository for the selected heap snapshot. You can download the Memory Leak Report and the Antipattern Report.
-
-
Available Class Histograms: The list of saved histograms with details such as date on which the snapshot was taken, Snap ID, Timestamp, JVM Name and Version, Description are displayed. The following options are available:
-
Details: Click this option to drill down to a detailed view of the heap.
-
Compare: Select two rows and click Compare. The Class Name, Instance Size (size of each snapshot), and Number of Instances (for each snapshot) are displayed.
-
JVM Offline Diagnostics
Diagnostic data for one or more JVM targets can be collected for a specific period and analyzed in an offline mode. This section describes the various options that are available to collect live JVM data and analyze it in offline mode. It contains the following sections:
Creating a Diagnostic Snapshot
You can create diagnostic snapshots for one or more JVM targets for a specified period. To create a diagnostic snapshot, specify the following:
Using the Diagnostic Snapshots Page
You can collect diagnostic data for one or more JVM targets and analyze them in an offline mode. This page shows the list of diagnostic snapshots that have been created. You can specify search criteria to retrieve a specific snapshot. You can do the following:
-
Create: Click Create to create diagnostic snapshots for one or more JVMs. The Create Diagnostic Snapshot page is displayed.
-
Export: Select a file and click Export to export the diagnostic data to a file. Enter the location in which the file is to be stored. You can review and analyze the saved file in an offline mode on the same or a different host machine.
-
Import: Click Import to import an exported file with diagnostic data for a particular collection object. Specify the name of the file and upload the file from your system. You can analyze the exported file and view a summary of the diagnostic snapshot.
-
Analyze: Select a file and click Analyze. The Analyze Diagnostic Snapshot page is displayed.
-
Delete: Select a diagnostic snapshot from the list and click Delete. A confirmation message is displayed. Click OK to delete the diagnostic snapshot.
-
View: Select a file and click View. The View Diagnostic Snapshot page is displayed.
Analyzing a Diagnostic Snapshot
This page displays the summary details of the diagnostic snapshot and a summary of all the diagnostic types of the diagnostic snapshot. You can view the thread stack, thread states, CPU Utilization, Heap Utilization, Active Threads Graphs, and Garbage Collections.
To analyze a diagnostic snapshot, follow these steps:
- From the Targets menu, select Middleware.
- Select the Manage Diagnostic Snapshots option from the Middleware Features menu.
- In the Diagnostic Snapshots page, select a snapshot from the list and click Analyze.
- You can analyze details for each JVM for the specified time interval. Click More Details to view detailed diagnostics information for the JVM. The Diagnostic Image Analysis page is displayed.
Viewing a Diagnostic Snapshot
This page displays the summary of the targets, target types and the diagnostic information collected.
- From the Targets menu, select Middleware.
- Select the Manage Diagnostic Snapshots option from the Middleware Features menu.
- In the Diagnostic Snapshots page, select a snapshot from the list and click View.
- The summary details for the selected JVM target, target types, and the diagnostic information collected for the JVM is displayed.
Viewing JVM Diagnostics Threshold Violations
An event is a discrete occurrence detected by Enterprise Manager related to one or more managed entities at a particular point in time which may indicate normal or problematic behavior. Examples of events include: a database target going down, performance threshold violation, change in application configuration files, successful completion of job, or job failure.
JVM Diagnostics threshold violations are now integrated with the Enterprise Manager Event subsystem. When a threshold violation occurs, an Enterprise Manager event is generated. To view the event, follow these steps:
Viewing the Request Instance Diagnostics
The Request Instance Diagnostics page provides a detailed view of the JVMs, Requests, and Request Thread Instances that have participated in the execution of the selected Execution Context ID (ECID). It also provides an overview of system metrics for the JVMs and aggregated metrics for the requests.
To view the Request Instance Diagnostics page, follow these steps:
Select a JVM target. The aggregate JVM Metrics and Application Metrics charts for the target are displayed in the bottom region.
Using emctl to Manage the JVM Diagnostics Engine
You can use $emctl status omscommand to get the status of JVMD Engine.
Note:
To run the emctl commands, you must navigate to the ORACLE_HOME/bin directory of the OMS.
Using emctl to Manage the JVMD Agent Deployment
You can use emctl commands for JVMD Agent deployment as follows:
emcli deploy_jvmd
-domain_name="Domain Target Name"
[-engine="JVMD Engine URL"]
[-clusters="Clusters Name"]
[-servers="Servers Name"]
[-host_cred="Oracle Home Owner Credentials"]
[-deploy_mode="Deploy Mode"]
[-java_args="Client java arguments"]
[-schedule=
start_time:yyyy/MM/dd HH:mm;
[tz:{java timezone ID}];
[grace_period:xxx];
]
[-workDir="Working Directory Location"]
[ ] indicates that the parameter is optional.
Table 20-1 Deploy JVMD agent in a WebLogic Domain
| Options | Descriptions |
|---|---|
|
domain_name |
Name of the WebLogic Domain Target where the agent will be deployed. |
|
engine |
JVMD Engine URL the agent will communicate to. |
|
slusters |
Name of the cluster(s) the JVMD agent will be targeted. |
|
servers |
Name of the server(s) the JVMD agent will be targeted. |
|
Named credentials |
Named credential used to access the reference host. This is an optional parameter. To pass the credential parameter, enter a name:value pair in the following format:
Where,
Note that all the operations will be performed on the Administration Server host. If no named credential is provided, the preferred host credentials for the Oracle home target will be used. |
|
wls_cred |
Named credential used to access the Administration Server. This is an optional parameter. To pass the credential parameter, enter a name:value pair in the following format:
Where,
If no named credential is provided, the preferred administrator credentials for the domain target will be used. |
|
deploy_mode |
Deployment mode of the JVMD agent. This is an optional parameter. The valid modes are deploy, redeploy and undeploy. If no mode is provided, the 'deploy' mode will be used by default. |
|
java_args |
Client java arguments that will be used to connect to the Administration Server. This is an optional parameter. |
|
schedule |
Specify when to run the deployment procedure. If no value is entered, by default, the procedure runs immediately. To schedule a procedure, provide:
|
|
workDir |
Specify the working directory to be used. This is an optional parameter. |
emcli deploy_jvmd
-engine="protocol://myhost.mycompany.com:port"
-clusters="Cluster1,Cluster2"
-schedule="start_time:2016/6/21 21:23;tz:America/New_York;grace_period:60"
-workDir="/u01/mytemp"
Using Java Workload Explorer
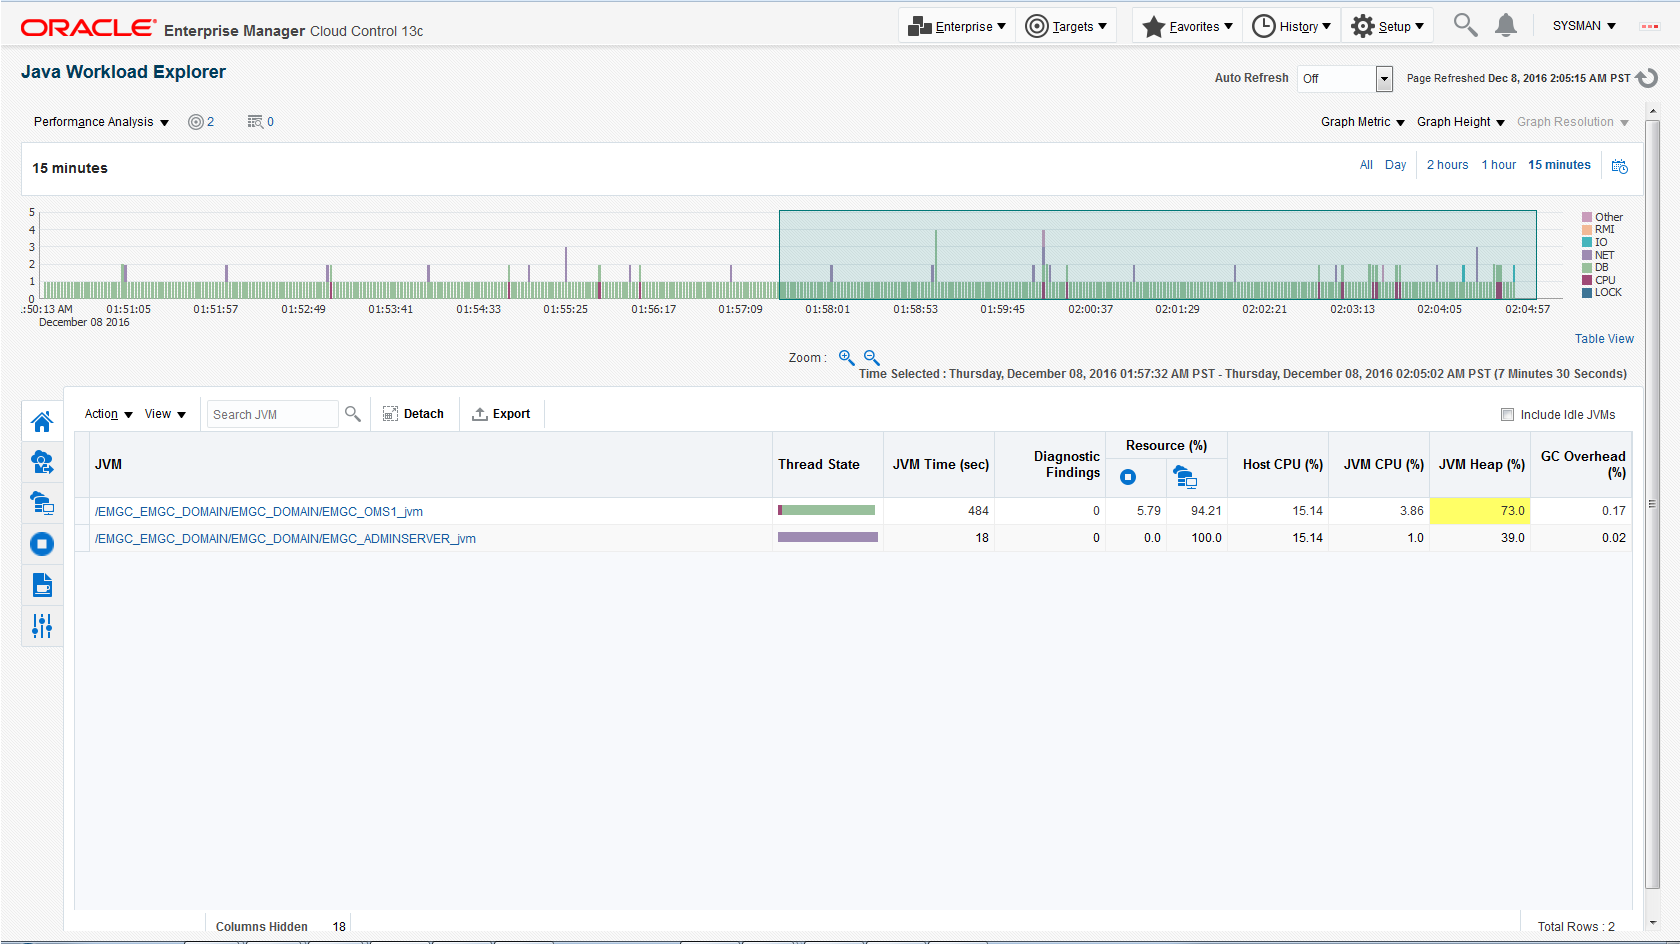
Java Workload Explorer provides a detailed view of all performance statistics associated with the JVM and JVM Pool targets.
Accessing Java Workload Explorer
To use Java Workload Explorer:
-
From the Targets menu, select Middleware, then select either a Java Virtual Machine target or a Java Virtual Machine Pool target.
You can also access this page by selecting Middleware from the Targets menu and then selecting the Middleware Features menu. Select Java Workload Explorer.
-
On the resulting page, click the Java Workload Explorer link at the top of the page.
Performance Analysis and Search Criteria
The Performance Analysis menu provides the following features:
Figure 20-4 Performance Analysis
-
Compare
Compare available snapshots against current data or sets including data from multiple JVMs across domains. This enables you to compare current activity to a saved baseline snapshot. Use this to proactively spot deviations after new application deployments, upgrades, or configuration changes in the target JVM.
-
Targets
Select the targets you want to analyze. Remove targets that no longer apply.
-
Sets
Use this option to create, open, save, and manage sets against which to compare current data sets.
-
Java Workload Report
Provides insight into the performance of the JVM in a selected time window. The report is available for a maximum of 10 targets with a duration of no more than one hour duration. Creating the report enables you to analyze the data with data reported at different points in time.
The following tables are displayed in the Java Workload Report:
Summary tables for each target include:
-
JVM Summary
-
Diagnostic Findings
-
Threshold Violations
-
JVM Statistics
-
OS Statistics
-
GC Statistics
Multiple tables aggregated by all targets in the context and sorted by important metrics include:
-
Requests Statistics
-
Request Instances Statistics
-
Session Statistics
-
User Statistics
-
Application Statistics
-
Thread Statistics
-
Method Statistics
-
Class Statistics
-
Packages Statistics
-
Databases Statistics
-
SQLs Statistics
-
Database Events Statistics
-
Database Schema Statistics
-
Database Modules Statistics
-
Database Actions Statistics
-
Other External Resources Statistics
-
Locks Statistics
-
Files Statistics
-
Supplemental Information
Contains JVM startup parameters, full SQLs, and Stacks
-
Search Criteria
The Search Criteria provided throughout the page enables you to fine tune your search and minimize the reported data.
Figure 20-5 Search Criteria
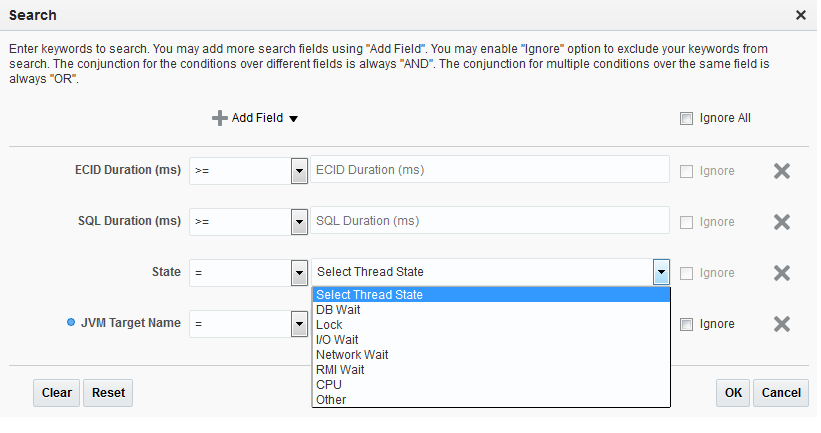
By default, the following keywords are used: ECID Duration (ms), SQL Duration (ms), and State. Using State enables you to select the Thread State in which you have interest. During any search, you can elect to ignore the field.
Using the Add Field menu, you can select fields for any of the following: request, user session, database, internal resource, code, and threads.
Graph Highlights
The graph at the top of the page provides a visual representation of the workload. Use this graph to quickly narrow down the time selection to the interval of interest. By default, the graph provides statistics on the active threads: RMI Wait, I/O Wait, Network Wait, DB Wait, CPU, and Lock. The data in the graph is available in table format.
Using the Graph Metric menu, you can narrow the graph to report on Memory Utilization, CPU Utilization, GC (garbage collection) Overhead, and Response and Load.
The Graph Height menu enables you to adjust the graph to display more details on the statistic.
The Graph Resolution menu enables you to see more spikes in the chart by increasing the number of data-points on the time axis (x-axis).
Diagnostics
The statistical data associated with the JVM or JVM Pool is available in the form of tabs. A diagnostic tab corresponds to a user intention based on a region or a set of related regions. A tab can have associated subtabs.
The majority of the tabs have an Action menu and a View menu. The options on the Action menu often replicate the options available on other parts of the screen, most notably Add to Search and Add to Set. Additional menu options are:
-
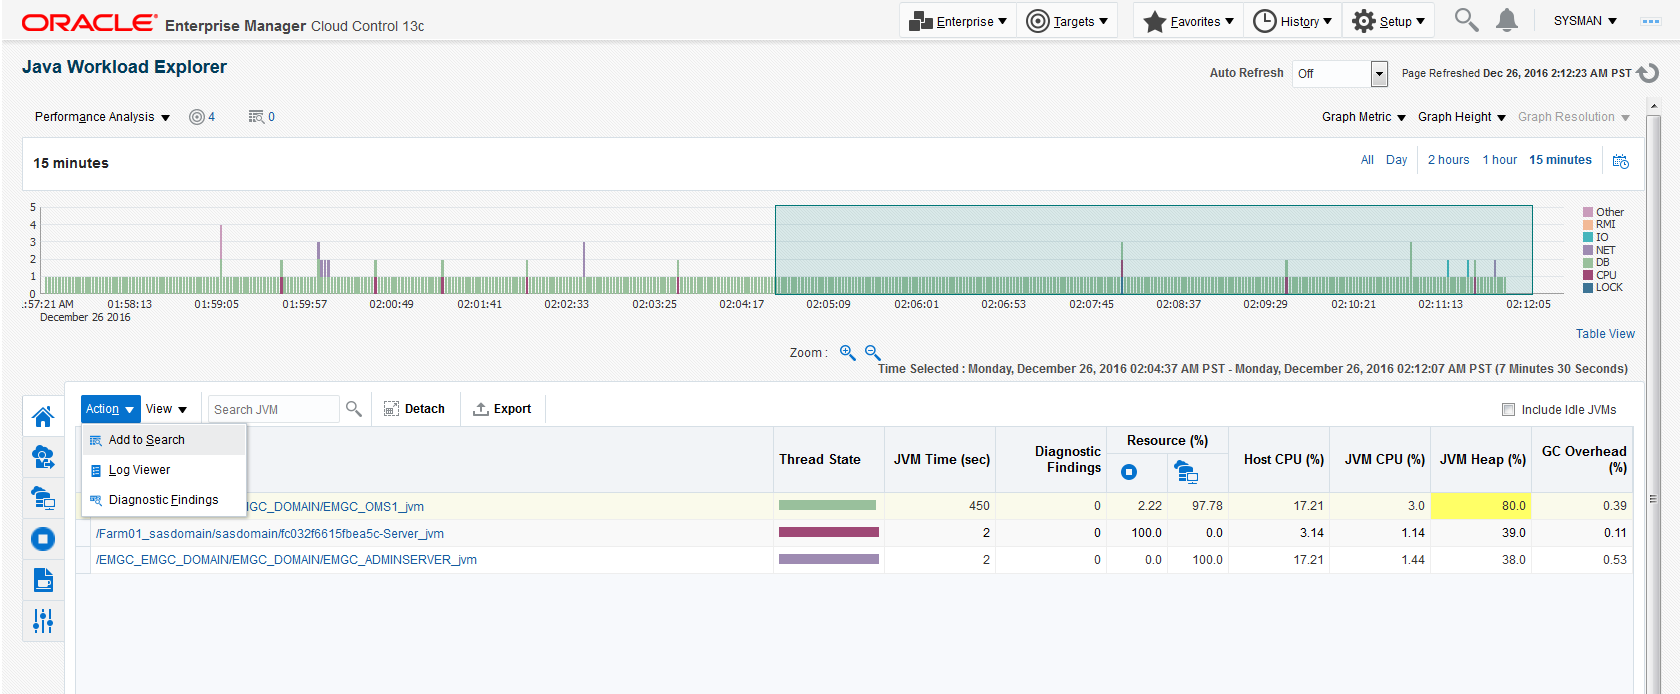
Add to Search: It adds the element to the Search Criteria.
Figure 20-6 Add to Search
-
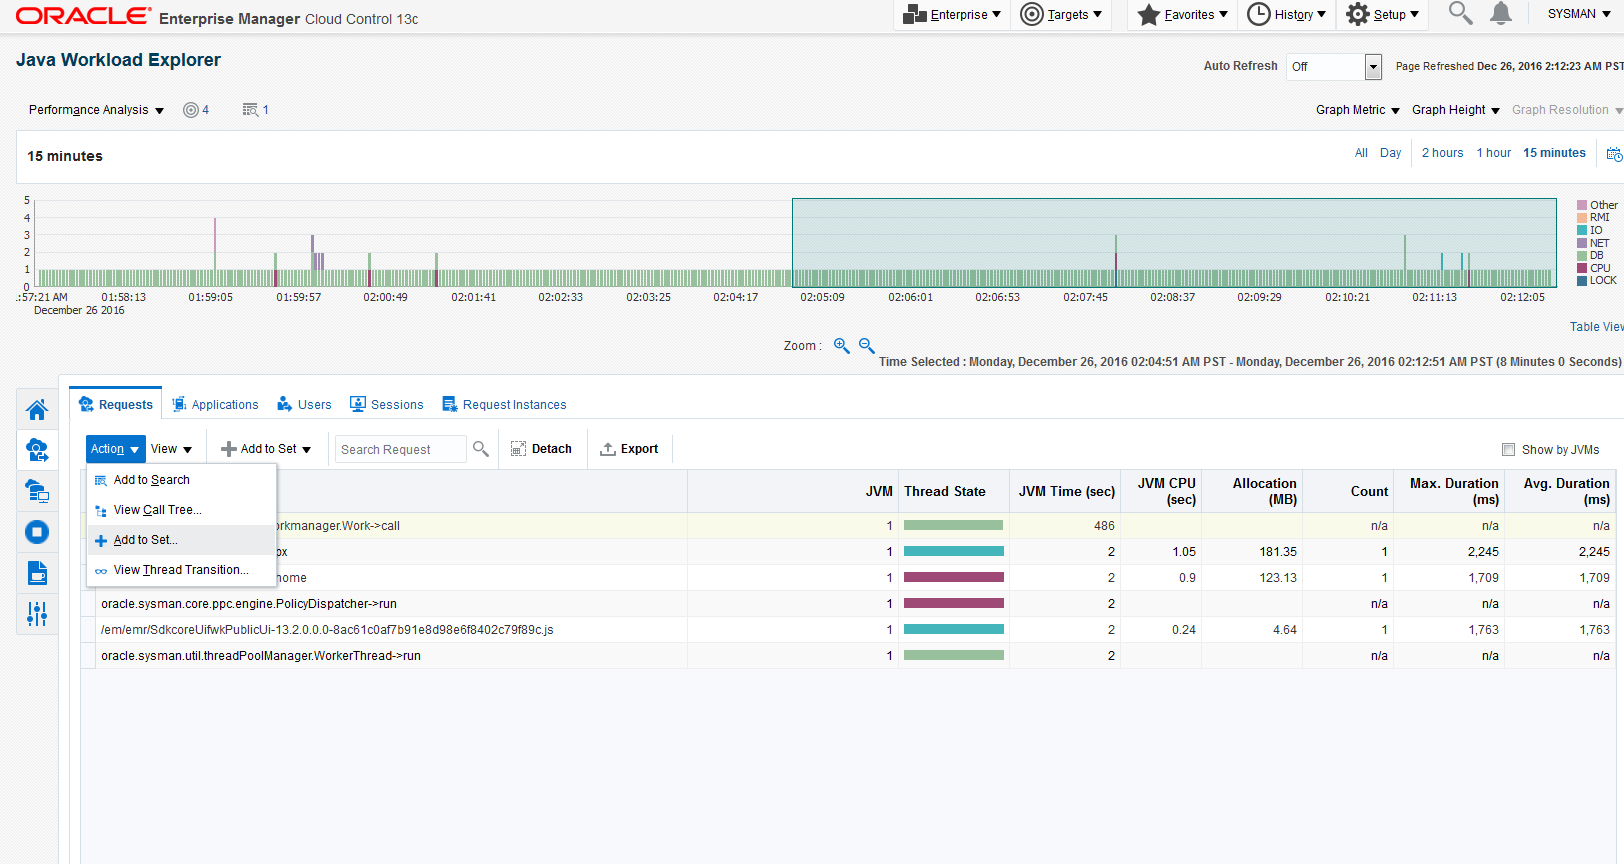
Add to Set: It adds the element to the Set Criteria.
Figure 20-7 Add to set
-
Log Viewer (Displays Log Messages.)
-
Diagnostic Findings (Displays Middleware Diagnostics Advisor).
-
View Call Tree (Displays the methods and the percentage of time for the call to execute to method.)
-
View Thread Transition (Displays the graphical view of how threads change over time.)
-
Session Diagnostics (This is a RUEI (Real User Experience Insight) based analysis and will be enabled only if the JVM target has been enabled on a RUEI system.)
The tabs are:
-
Overview:
Figure 20-8 Overview Tab
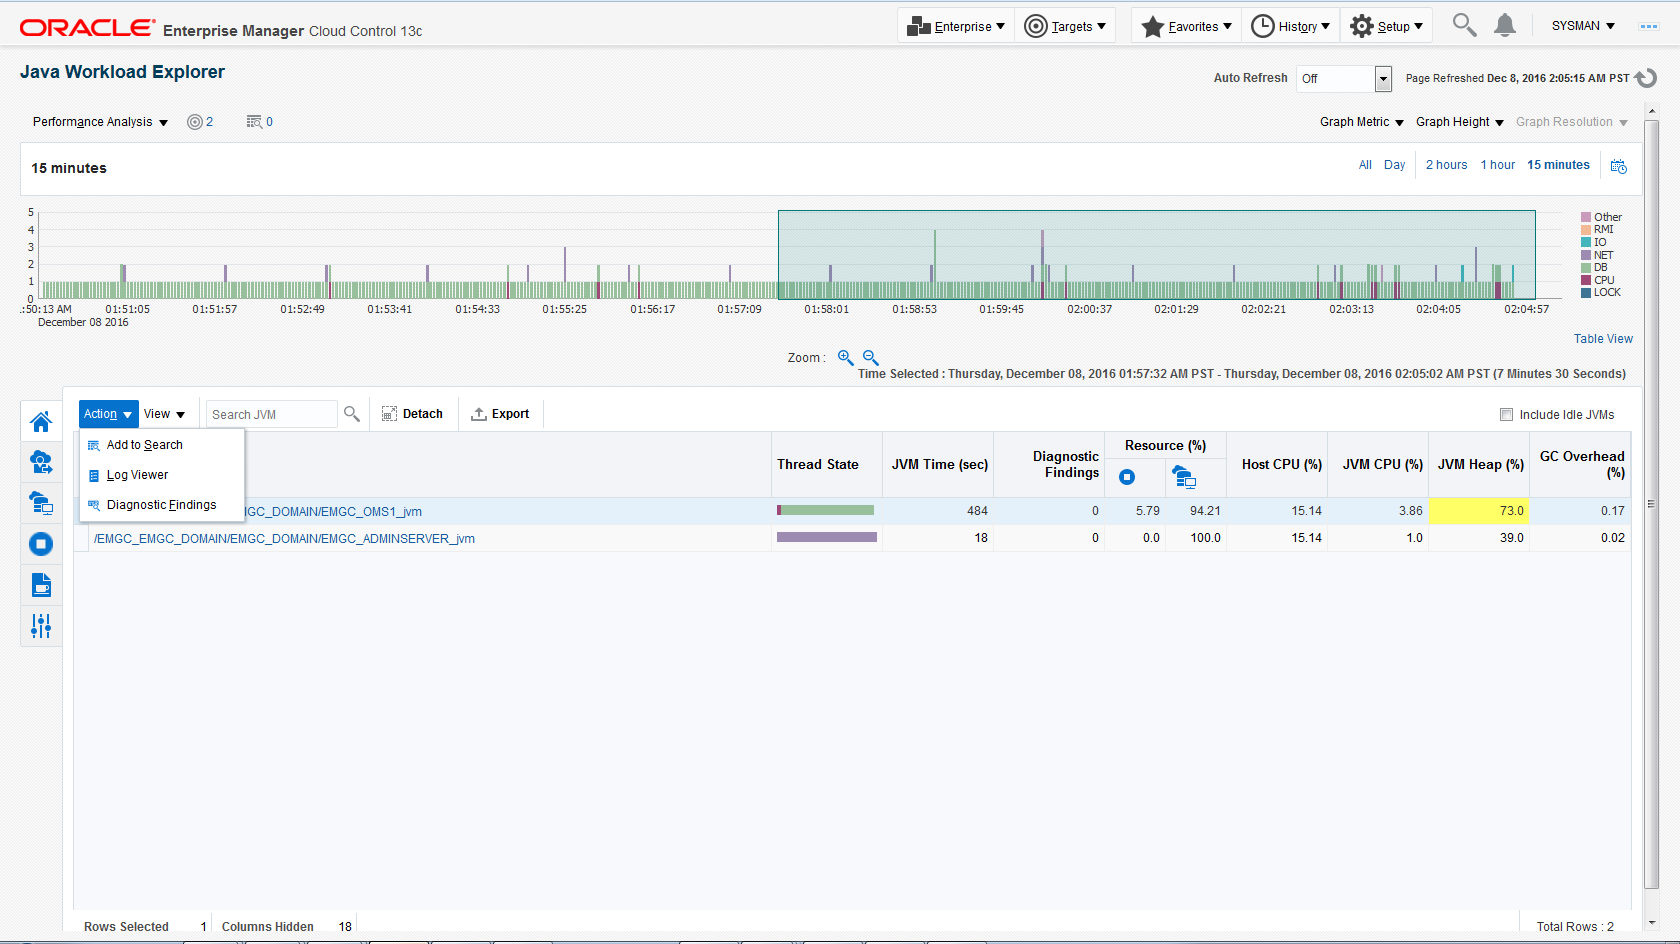
Statistics include: OSR, Context Switch (per sec), Host Memory (%), Swap Space (%), Open File Descriptors (%), Max Heap Size (MB), Min Heap Size (MB), Container Type, Container Name, Version
Actions available are: Add to Search, Log Viewer, and Diagnostic Findings
-
Requests, ECIDs, Sessions, and Users
-
Requests
Figure 20-9 Request Tab
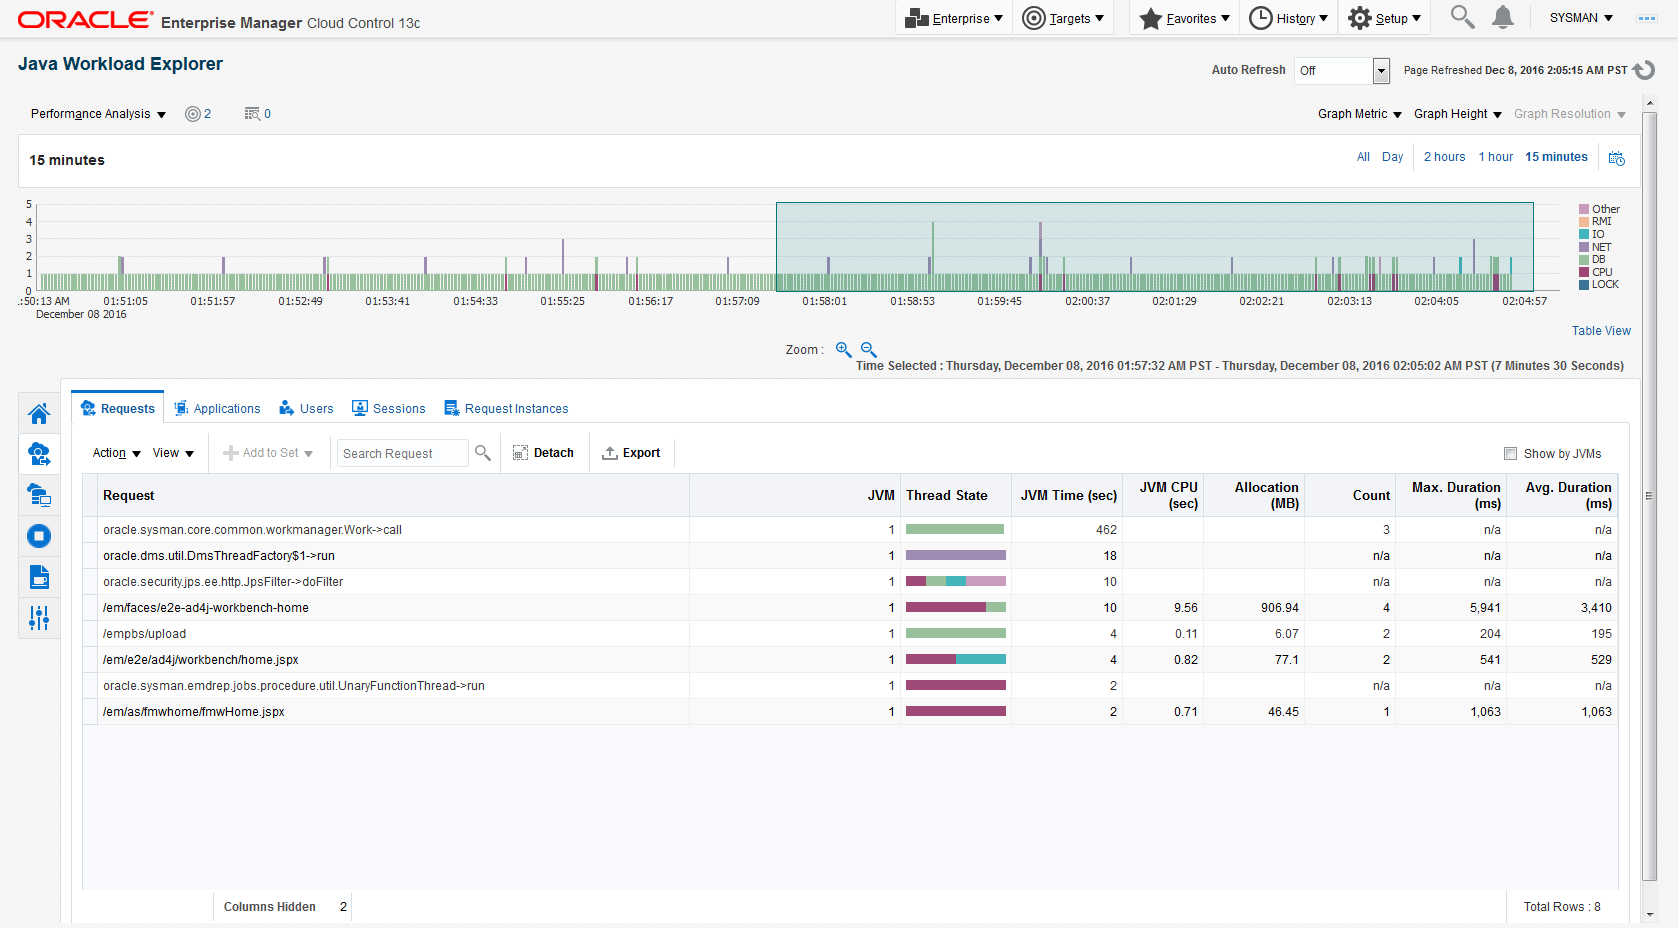
Statistics include: Avg. Duration (ms), Max. Duration (ms), Min. Duration (ms), Throughput (per min), Count, Allocation (MB), JVM CPU (sec), JVM Time (sec), Thread State, JVM
Actions available are: Add to Search, View Call Tree, Add to Set, View Thread Transition
-
Applications
Statistics include: JVM Time (sec), Thread State, Application Name
Actions available are: Add to Search, Add to Set
-
Users
Statistics include JVM Time (sec), Thread State, User
Actions available are: Add to Search, Add to Set, Log Viewer,
-
Sessions
Statistics include: Minor GC Time (ms), Minor GC Count, Major GC Time (ms), Major GC Count, JVM Time (sec), Thread State, Number of Requests, User, Session ID
Actions available are: Add to Search, View Call Tree, Add to Set, View Thread Transition
-
Request Instances
Statistics include: Minor GC Time (ms), Minor GC Count, Major GC Time (ms), Major GC Count, GC Overhead (ms), Allocation (MB), JVM CPU (sec), Duration (ms), JVM Time (sec), Thread State
Actions available are: Add to Search, View Cal Tree, Add to Set, Log Viewer, View Thread Transition, Session Diagnostics
-
-
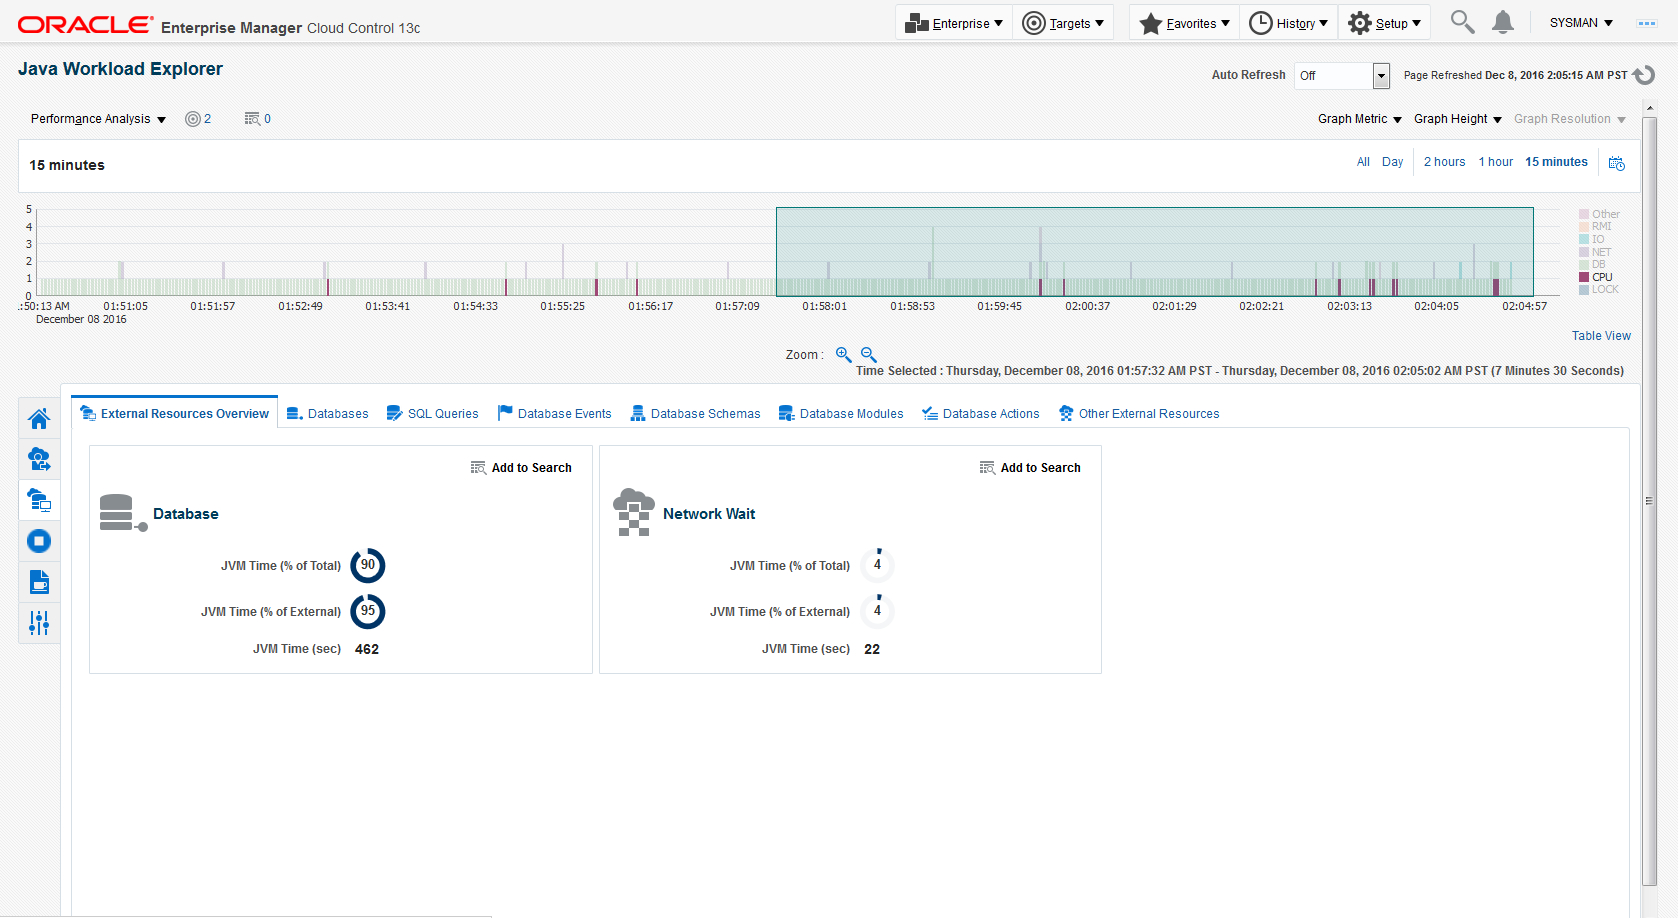
External Resources
Figure 20-10 External Resources Tab
-
External Resources Overview
Network Wait and Database (JVM Time (% of Total), JVM Time (% of Internal), and JVM Time (sec))
-
Databases
Statistics include: Max Duration (ms), Avg. Duration (ms), Count, JVM Time (sec), More Information, Database
Actions available are: Add to Search, View Call Tree, Add to Set, Database Drill Down
-
SQL Queries
Statistics include: Max Duration (ms), Avg. Duration (ms), JVM Time (sec), Database, SQL ID, SQL Statement
Actions available are: Add to Search, View Call Tree, Add to Set, SQL Details
-
Database Events
Statistics include: Max Duration (ms), Avg. Duration (ms), Count, JVM Time (sec), Database, Database Event
Actions available are: Add to Search, View Call Tree, Add to Set
-
Database Schemas
Statistics include: Max Duration (ms), Avg. Duration (ms), Count, JVM Time (sec), Database Schemas
Actions available are: Add to Search, View Call Tree, Add to Set
-
Database Modules
Statistics include: Max Duration (ms), Avg. Duration (ms), Count, JVM Time (sec), Database Module
Actions available are: Add to Search, View Call Tree, Add to Set
-
Database Actions
Statistics include: Max Duration (ms), Avg. Duration (ms), Count, JVM Time (sec), Database Action
Actions available are: Add to Search, View Call Tree, Add to Set
-
Other External Resources
Statistics include: JVM Time (sec), Protocol, Request
Actions available are: Add to Search, Add to Set
-
-
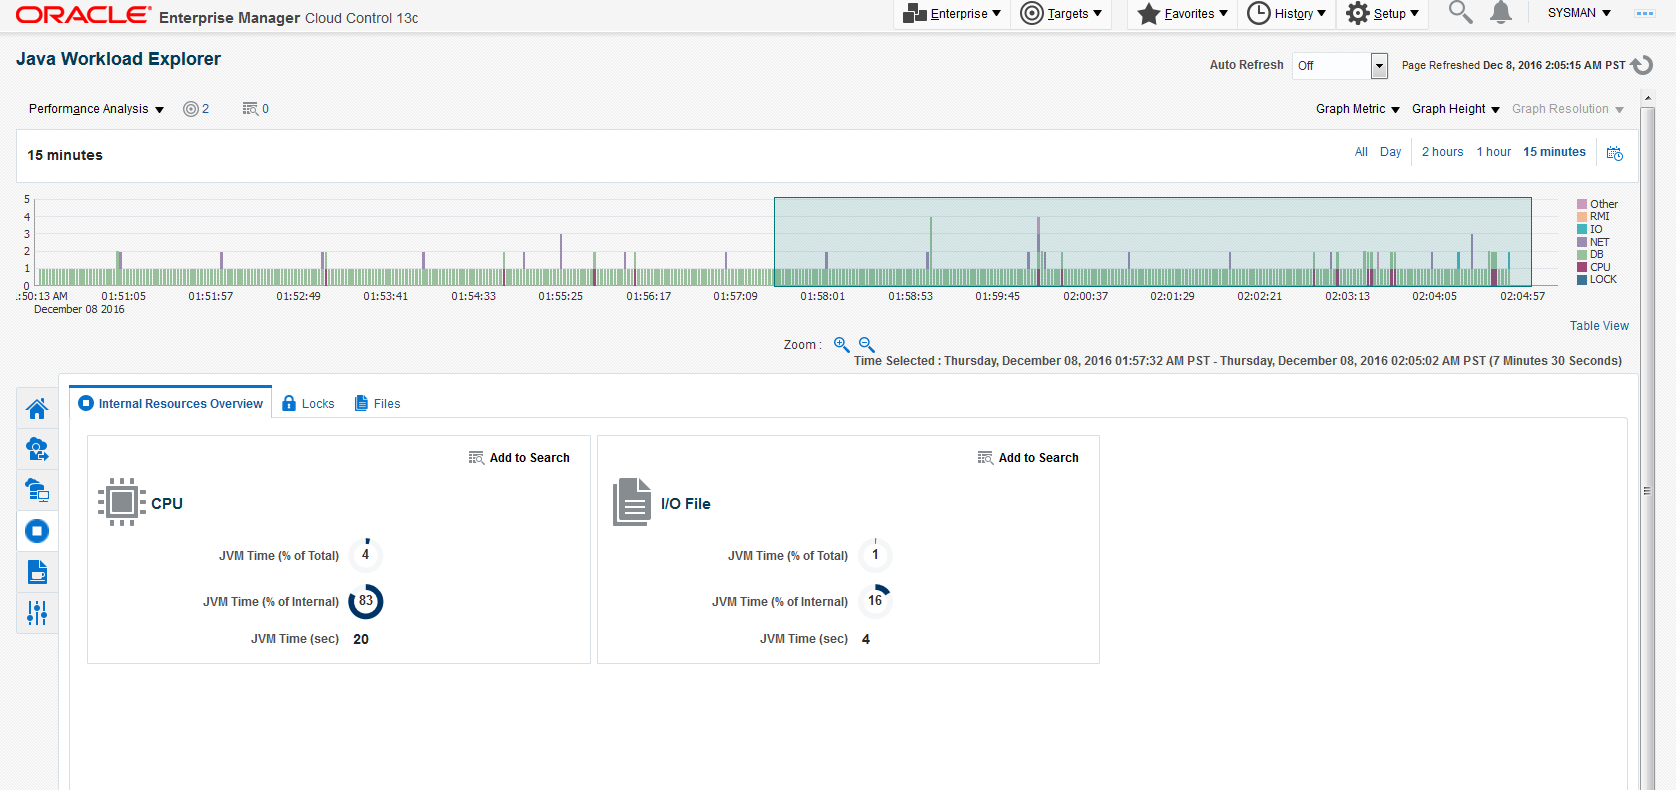
Internal Resources
Figure 20-11 Internal Resources Tab
-
Internal Resources Overview
-
CPU - JVM Time (% of Total), JVM Time (% of Internal), and JVM Time (sec)
-
Lock - JVM Time (% of Total, JVM Time (% of Internal), JVM Time (sec)
-
I/O File - JVM Time (% of Total), JVM Time (% of Internal), and JVM Time (sec)
-
-
Locks
Statistics include: Held Locks (JVM Time (sec), Avg. Duration (ms), Max Duration (ms) and Waiting Locks (Thread Trend, JVM Time (sec), Avg. Duration (ms), and Max Duration (ms)
Actions available are: Add to Search, View Details, Add to Set
-
Files
Statistics include: I/O file and JVM Time (sec)
Actions available are: Add to Search, Add to Set
-
-
Code
Figure 20-12 Code Tab
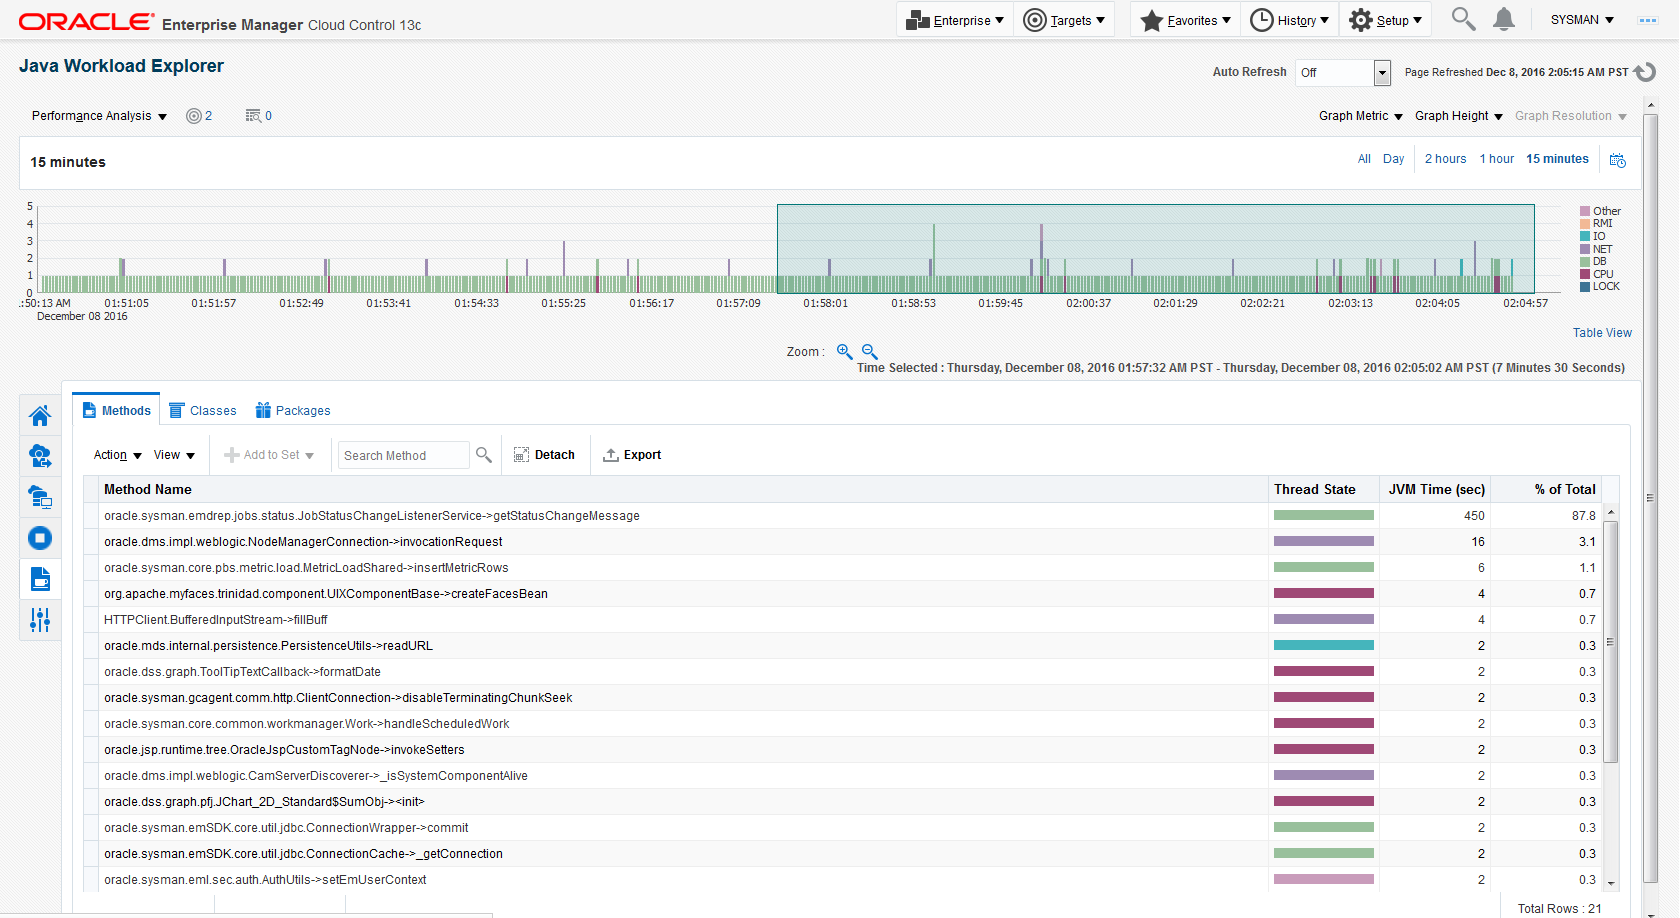
Statistics include: % of Total, JVM Time (sec), and Package
-
Methods
Actions available are: Add to Search, View Call Tree, Add to Set
-
Classes
Actions available are: Add to Search, Add to Set
-
Packages
Actions available are: Add to Search, Add to Set
-
-
Threads
Figure 20-13 Threads Tab
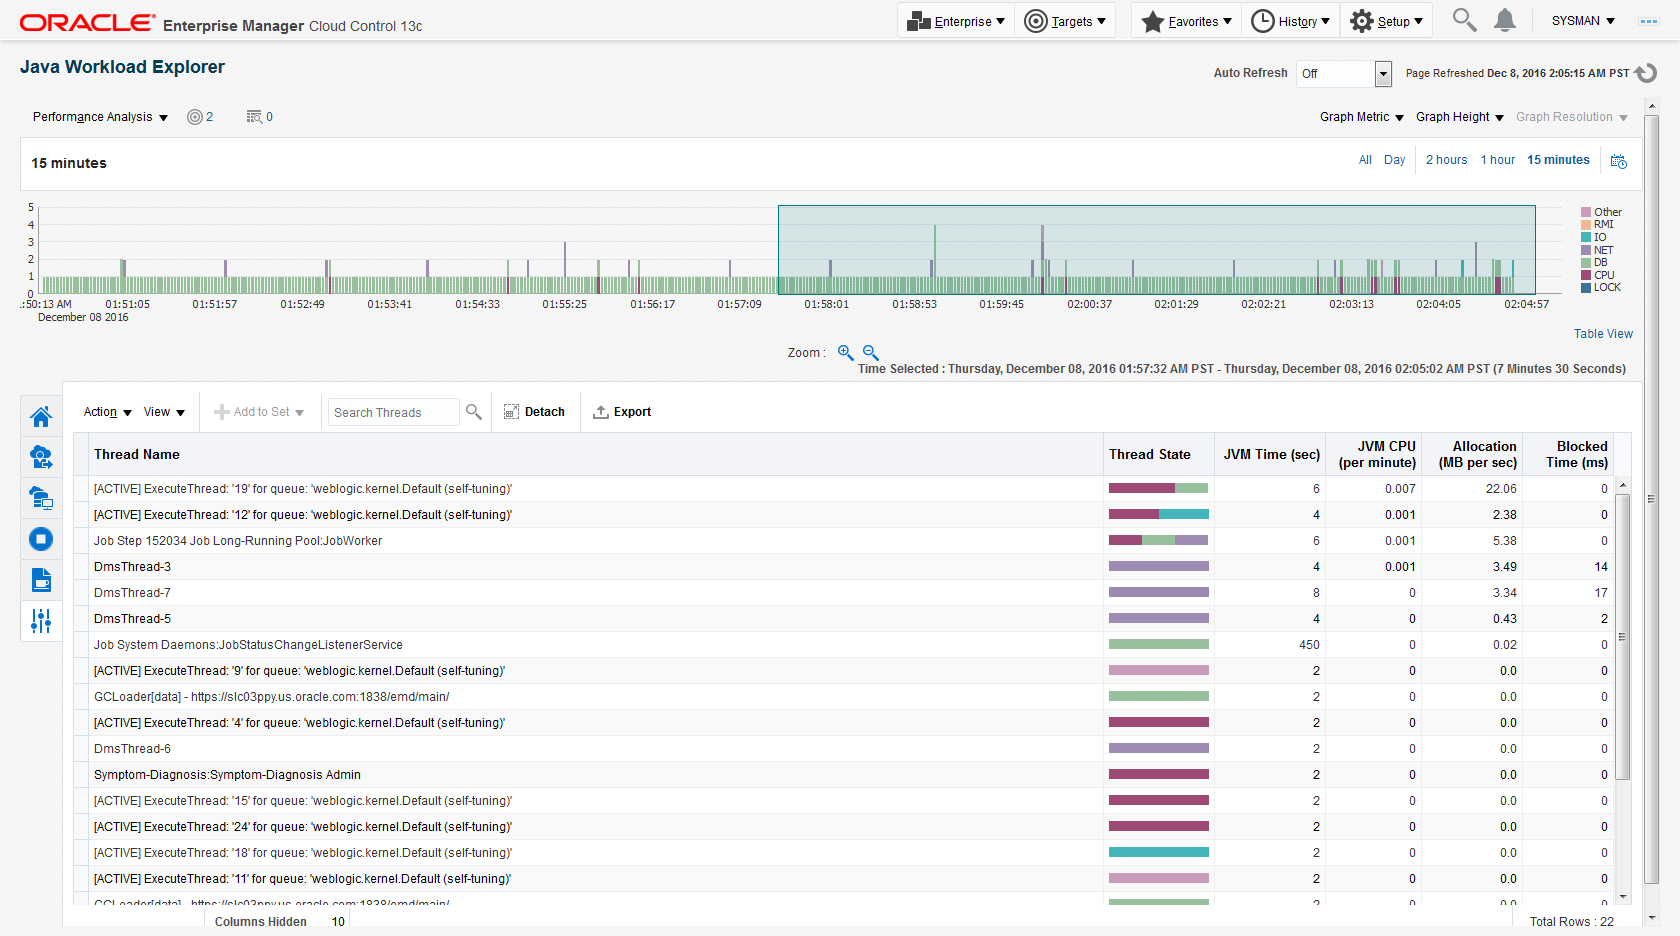
Statistics include: Write Characters, Read Characters, Wait Count, Waited Time (sec), Blocked Count, Blocked Time (ms), Hogger (%), Stuck (%), Allocation (MB per sec), JVM CPU (per minute)
Actions available are: Add to Search, View Call Tree, Add to Set, Log Viewer, View Thread Transition, Sample Analysis
Managing and Troubleshooting JVMD (Globally)
If you find that a particular JVM Diagnostics Engine is exhibiting problems, the Manage and Troubleshoot JVMD functionality provides the statistics and diagnostic aids to help resolve the issue.
To access the Manage and Troubleshoot JVMD page:
Managing and Troubleshooting JVMD (Specific Agent)
Should you find that a particular JVM or JVM Pool is sluggish or is posing problems, the Manage and Troubleshoot JVMD functionality provides the statistics and diagnostic aids to help resolve the issue.
To access the Manage and Troubleshoot JVMD page:
