22 Using Middleware Diagnostics Advisor
The Middleware Diagnostics Advisor analyzes the entire stack and provides diagnostic findings by identifying the root cause of a problem. It correlates and analyzes the input and offers advice on how to resolve the problem. For example, it can help you identify a JDBC connection pool that is causing a performance bottleneck.
You can view the diagnostic findings for one or more servers in a WebLogic Domain if the Middleware Diagnostics Advisor has been enabled for the server(s).
This section covers the following:
-
Diagnosing Performance Issues Using Middleware Diagnostics Advisor
-
Prerequisites for Configuring Middleware Diagnostics Advisor
-
Using Middleware Diagnostics Advisor to View and Diagnose Performance Issues
-
Running an Unscheduled Middleware Diagnostics Advisor Analysis on a Target
-
Troubleshooting Issues Related to Middleware Diagnostics Advisor
Diagnosing Performance Issues with Oracle WebLogic Server
Oracle WebLogic Server (WLS) is an application server that provides high performance and scalability. WebLogic Server also simplifies deployment and management, and accelerates time to market with a modern, lightweight development platform.
In order to keep up the performance, and scalability of WLS, it is best to detect violations and provide insight to the cause of the violation, thus enabling faster remedial action. Performance related issues are detected based on the configuration and load of the server. The most common performance issues include slow response times, and application crashes. Using Middleware Diagnostics Advisor (MDA) adds value to the WebLogic Management Pack. To find out more about using MDA for WebLogic Servers, see Diagnosing Performance Issues Using Middleware Diagnostics Advisor.
Diagnosing Performance Issues Using Middleware Diagnostics Advisor
Middleware Diagnostics Advisor or MDA is a diagnostic module integrated within Enterprise Manager (EM) Cloud Control for diagnosing performance issues with middleware targets monitored by Enterprise Manager Cloud Control. Currently, MDA is supported for Oracle WebLogic Server 10g Release 3 (10.3) and higher. MDA monitors JDBC DataSources, and JMS Queues.
MDA enables you to easily identify the underlying states in the application server environment that are the causes for degradation in performance. These underlying states can manifest themselves as degradation in performance such as slow response for request, hung server, slow server, high memory utilization and high Disk I/O, and so on.
MDA analyses the performance of aspects like JMS message consumption time, etc. in a runtime environment. When the performance of the aspect degrades beyond a certain limit, MDA diagnoses the issue to find the underlying cause, and the problems detected by MDA are projected as Diagnostic Findings. However, individual one off issues, which do not affect the overall performance, are not isolated by MDA.
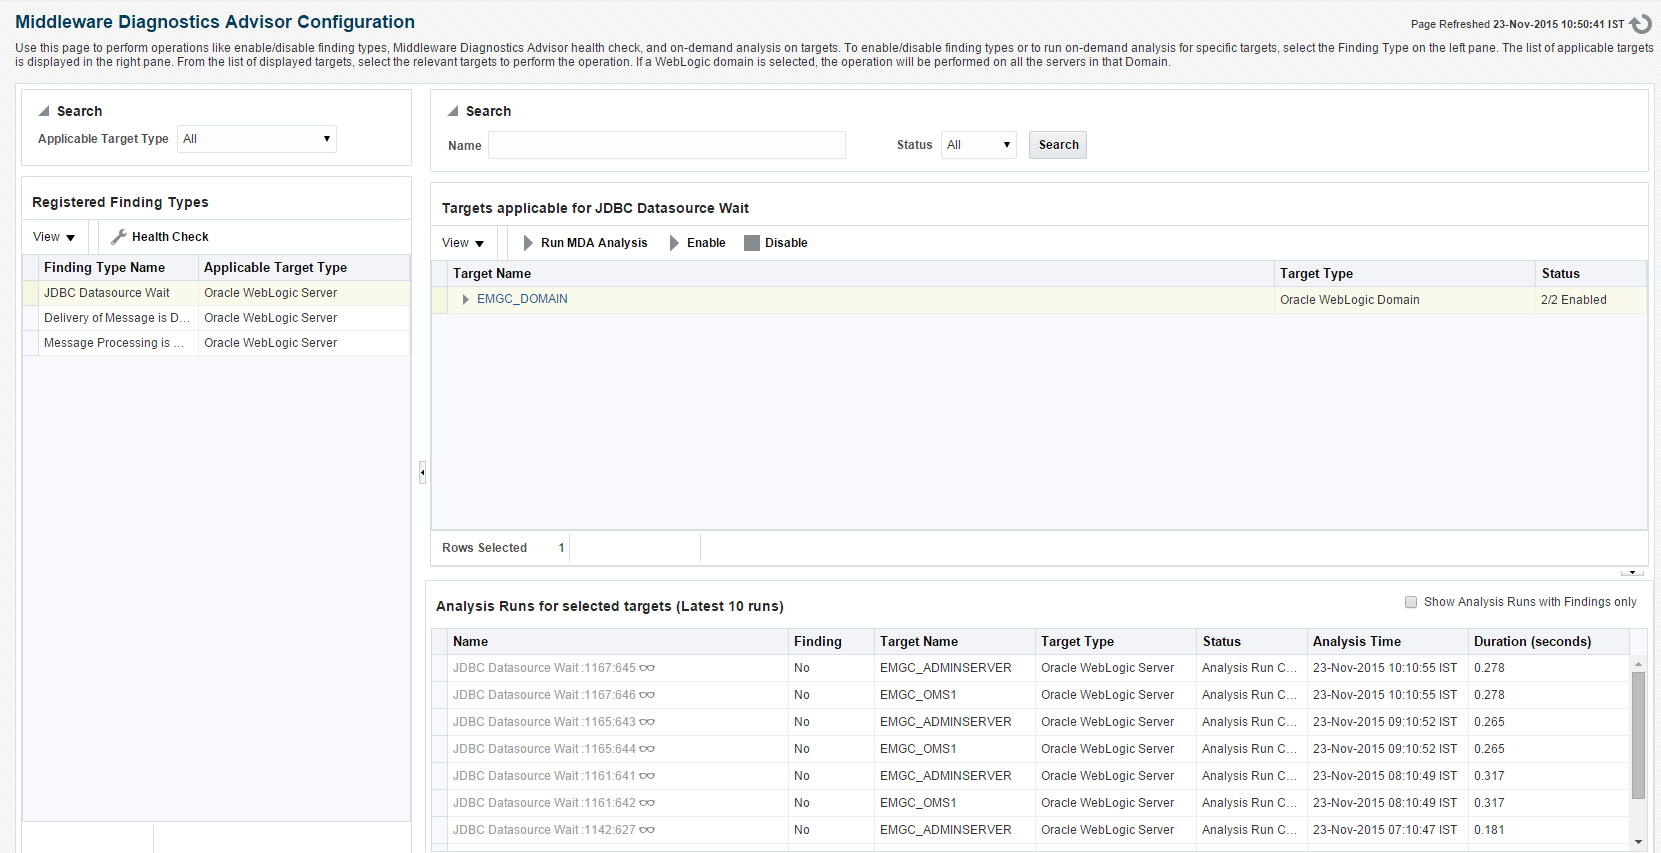
MDA diagnoses performances issues in the following areas and each of these areas is listed as a Finding Type in the Middleware Diagnostics Advisor Configuration page (see Figure 22-1):
-
JDBC Datasource Wait (JVMD mandatory)
Investigates excessive wait for JDBC Datasource connection.
-
Delivery of Message is Delayed (JVMD mandatory)
Investigates if the time taken to pick up a message for processing is higher than the specified time. If this is not checked it may lead to messages spending more time in the queue than expected.
-
Message Processing is slow (JVMD mandatory)
Investigates if the queue processing is slow because of which messages are being processed much slower than they are being received. If this is not checked it may cause the queue to grow and eventually lead to out-of-memory errors.
Functioning of Middleware Diagnostics Advisor
Middleware Diagnostics Advisor functions in the following way:
Prerequisites for Configuring Middleware Diagnostics Advisor
Before you begin using Middleware Diagnostics Advisor (MDA) for diagnosing performance issues, ensure the following prerequisites are met:
-
The WebLogic Server is discovered as a target in Enterprise Manager.
-
JVMD Manager is configured, and the JVMD Agent is deployed on the target server.
-
It is recommended to force the configuration collection for the target.
To force the configuration collection for the target, perform the following steps:
-
From the target menu, select Configuration and then select Last Collected.
-
Click Refresh.
-
Configuring Middleware Diagnostics Advisor
Middleware Diagnostic Advisor (MDA) has an auto-enable job that runs every hour to check for new targets. However, these jobs will not be enabled for MDA analysis by default unless you have run the command emcli update_mda_properties -props="MDA_AUTO_ENABLE:1". After the command has been executed successfully, and if the prerequisites (see Prerequisites for Configuring Middleware Diagnostics Advisor) are met, the target is automatically enabled for MDA analysis in the next run of the job. However, to immediately enable a newly discovered middleware target for MDA analysis follow the steps below:
Enabling Middleware Diagnostics Advisor for a Target
After the MDA_AUTO_ENABLE property has been set to "1" (enable) using the EM CLI verb emcli update_mda_properties -props="MDA_AUTO_ENABLE:1", any new WLS targets discovered in EM are enabled by default. However, if you do not want to enable every WLS server managed by the EM instance, you can set MDA_AUTO_ENABLE to "0" (disable), and individually enable specific targets either from UI (by following the steps below) or from EM CLI with the command emcli enable_mda_finding_types_for_targets -finding_types="finding_type_name"-targets="target_name:target_type".
To manually enable or disable MDA, follow these steps:
Figure 22-1 Middleware Diagnostics Advisor Configuration Page

Setting Up Middleware Diagnostics Advisor (MDA)
MDA can be set according to your preference. To set up MDA, follow these steps:
Figure 22-2 shows the Middleware Diagnostics Advisor Setup page.
Figure 22-2 Middleware Diagnostics Advisor Setup Page

Note:
Additionally, you can also use EM CLI commands to configure MDA. For details, see Enterprise Manager Command Line Interface Guide.
Limiting the Scope of Middleware Diagnostics Advisor
You can limit the scope of Middleware Diagnostic Advisor (MDA) by disabling MDA on some or all of the targets. If disabled, no analysis runs will be scheduled for the disabled targets. The targets can also be enabled when required.
To disable a target for MDA analysis follow the steps below:
- On the Enterprise Manager home page, from the Targets menu, select Middleware.
- From the Middleware Features menu select Middleware Diagnostics Advisor Configuration.
- On the Middleware Diagnostics Advisor Configuration page, from the Registered Finding Types section select any one of the Finding Type.
- In the Targets section, select the target that you want to disable MDA for, and click Disable.
To enable a target again for MDA analysis, see Enabling Middleware Diagnostics Advisor for a Target.
For more information on limiting the scope of MDA, see the Oracle Enterprise Manager Command Line Interface guide.
Using Middleware Diagnostics Advisor to View and Diagnose Performance Issues
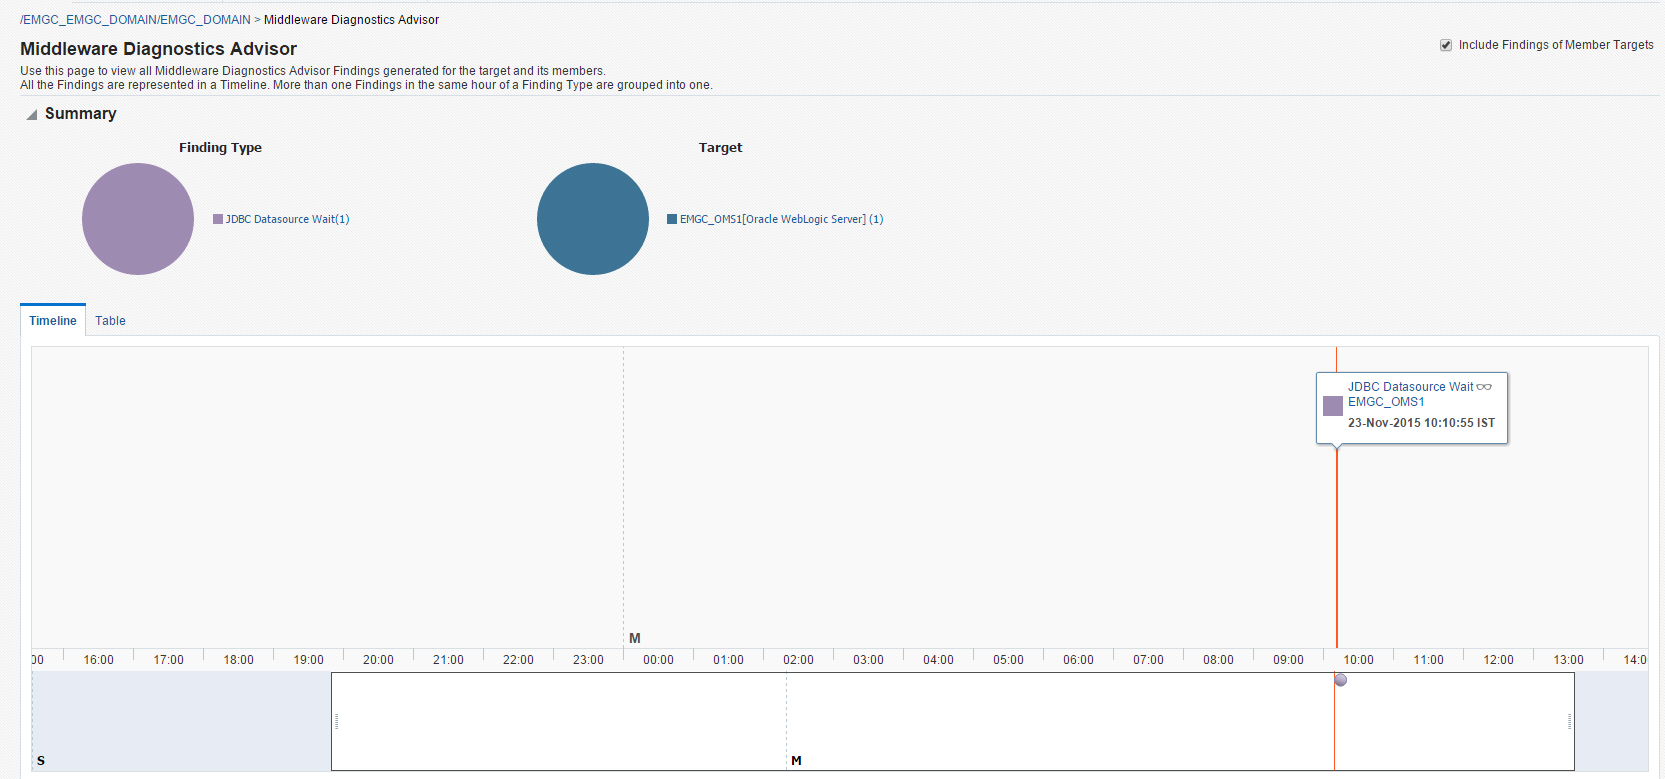
To use MDA to view and diagnose performance issues, follow these steps:
Running an Unscheduled Middleware Diagnostics Advisor Analysis on a Target
The MDA engine runs analysis for each finding type as scheduled on all the applicable targets. You can also run an unscheduled on-demand MDA analysis on a target. Follow the steps below to do so:
Troubleshooting Issues Related to Middleware Diagnostics Advisor
To troubleshoot issues related to MDA, follow the steps mentioned in the following table.
Table 22-1 Troubleshooting Tips for Middleware Diagnostics Advisor
| Tip | How to |
|---|---|
|
Ensure that MDA is enabled for the specified finding type on the target. |
If the status is disabled, enable MDA for the specified finding type for the target. Refer the Enterprise Manager Command Line Interface Guide for more options. |
|
Ensure that MDA auto-enable job is running properly |
View all the jobs displayed in the table. If there are no skipped or failed jobs, it indicates that the auto-enable job is running as expected. |
|
Ensure that MDA analysis jobs are running properly. |
View all the jobs displayed in the table. If there are no skipped or failed jobs, it indicates that the analysis job is running as expected. |
|
Ensure that the MDA engine is running normally. |
Refer the Enterprise Manager Command Line Interface Guide for the command to check the status of MDA engine. |
