| Oracle® Retail Predictive Application Server Cloud Edition User Guide Release 19.0 F24877-28 |
|

 Previous |
 Next |
| Oracle® Retail Predictive Application Server Cloud Edition User Guide Release 19.0 F24877-28 |
|
Previous |
Next |
When you use an RPASCE solution, you can export data in the current slice of a view or across all slices of a view. Data from current slice of a view can be exported to Microsoft Excel or to a text file. You can also print it. You can also export the chart views as pivot table to Microsoft Excel or to a text file. Data from all slices of the current view can be exported to a.csv file.
As part of this functionality, you can adjust the page setup options before exporting the data. These default settings are set in the RPASCE for the selected view.
Export Current Slice
If you want to export the data of the view you are currently working on, use the current slice option. This allows you to export the data from the current slice into an Excel or a Text file. You can export attributes displayed on the pivot table along with the data. You can also include images and choose the required format types.
For Example: If you are working on a view called Determine # of Options for Subclass A and Cluster A/Humid/Conservative, the export option for current slice here allows you to export all the visible positions on the view for the chosen Subclass and Cluster.
Export All Slices
If you want to export the data of the view of all the positions you are currently working on, use the All slices option. This allows you to export the data from all the slices of the view you are currently working on to a csv file format. You can export attributes displayed on the pivot table along with the data. You can also include image URLs and choose the required format types. This export runs in the background and you are notified on completion.
For Example: If you are working on a view called Determine # of Options for Subclass A and Cluster A/Humid/Conservative and if there are 15 more clusters hidden in the XZ-Axis, the export option for All slices here allows you to export all the data for all 15 clusters for subclass A.
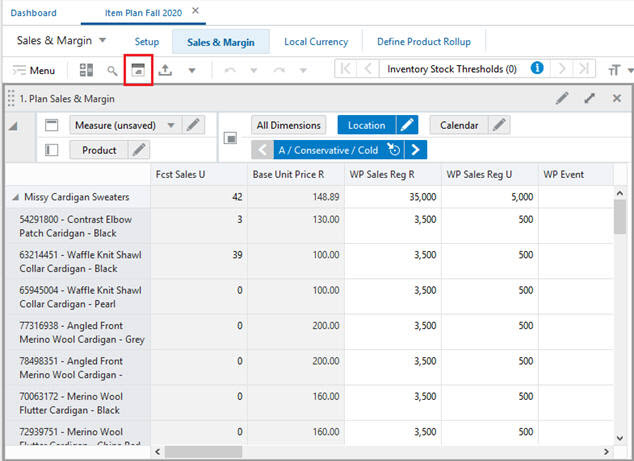
The Export option is located in the Quick Access Tool Bar menu, as shown in Figure 11-1.
Click Export to display the Export window.
The export window provides access to the following three tabs:
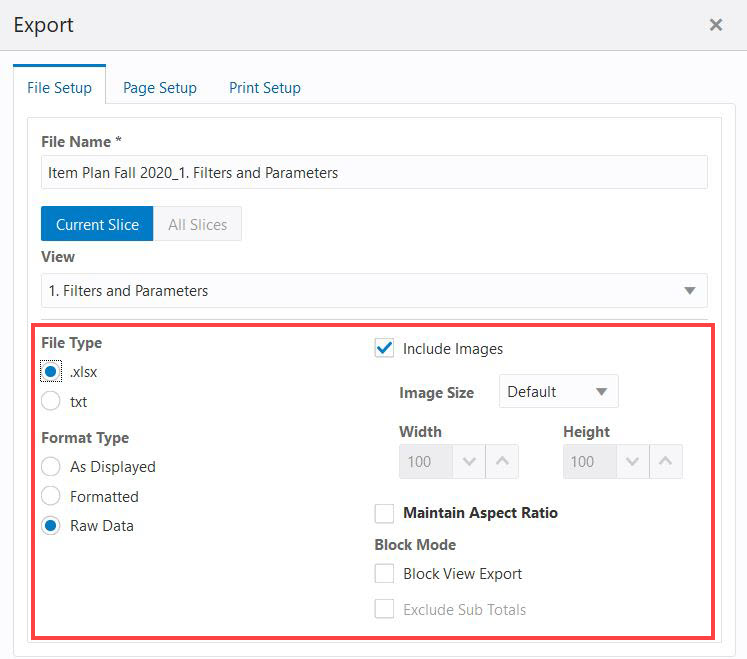
You can use the File Setup tab to select either the Current or All Slice export option. You can specify the file name, the view that you want to export, file type, format type, and whether or not to include images. These options are described in the following sections.
Perform the following steps to set options for the Current Slice.
Enter the file name. The exported file has this file name. Enter the file name. The exported file will have the file name you entered.
Select the view that you would like to export for the current slice.
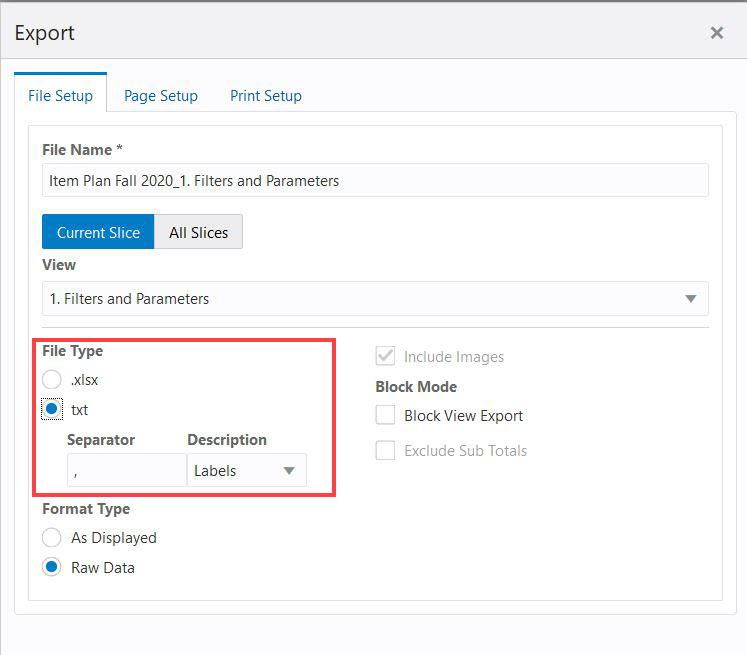
Choose the file type for the exported file. File types are either Text or Microsoft Excel.
When you select Text, you see the options to select the Separator and the Description. Description has two options:
Labels: display the labels for measures
Names: display the names for measures
|
Note: When exporting the Microsoft Excel file, the set custom height and width is exported to the Excel file. |
When you select Microsoft Excel, you have access to the options Image Size, Maintain Aspect Ratio, and Format Type.
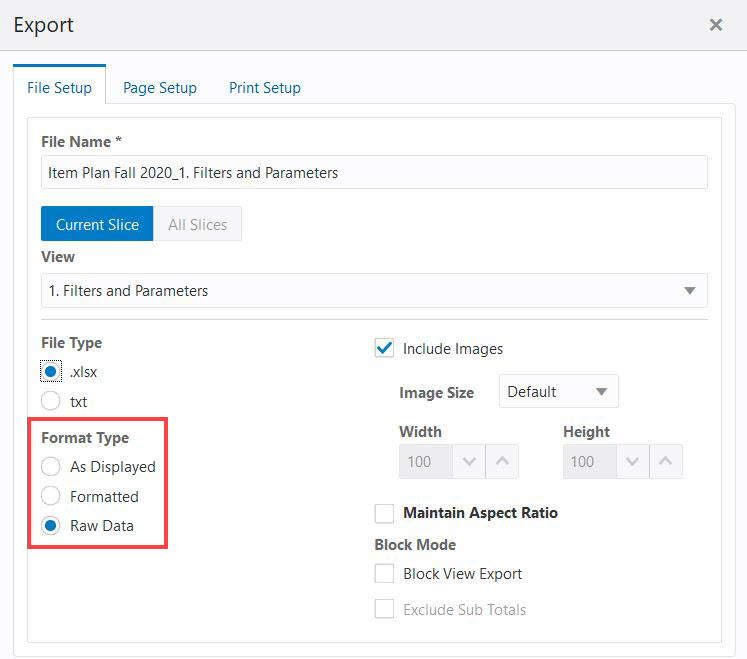
Use Format Type to specify the way that you want the data to be exported using the following three options:
As Displayed: the data is exported as it appears in the Content area.
Formatted: the data is exported in raw format (that is, the RPASCE formatting has been removed) and the Excel-based formatting is automatically applied within Excel.
Only the formatting specified in RPASCE is applied in Excel. After the data is exported, you can apply more formatting within Excel.
This option is for the Text file type option.
Raw Data: the exported data in the text file appears without number formatting.
For example, if you have entered 12588.687 and the number formatting is configured to have a scale of 1, a precision of 2, the separator turned on, and a prefix of $, the number appears as $12,588.69 in the pivot table. This number appears in the text file in the following ways, depending on the exported format type:
As Seen: $12588.69
Formatted: $12,588.69 (the raw number, 12588.687, is formatted in Excel to display as $12588.69)
Raw: 12588.687
|
Note: Data types other than integer and float are not supported. If a view contains columns with data types other than integer and float, the data is exported as it appears in RPASCE. If a workspace view contains a mix of columns with integer or float data types with other data types, the exported file contains the appropriate formatting for the supported data types based on the options selected during the export. Data in the columns of the unsupported data types appears as it is seen in RPASCE.Date or any type of picklists are exported as a string. Boolean data types are exported with formatting compatible with Excel. When you use the formatted option and use a scale factor of anything besides 1000, the value in Excel is displayed as the raw formatted value, not the scaled formatted value. For percentages, a scale factor of .01 displays as a percent in Excel. |
|
Note: The Separator and Descriptions options do not apply to Microsoft Excel exports. |
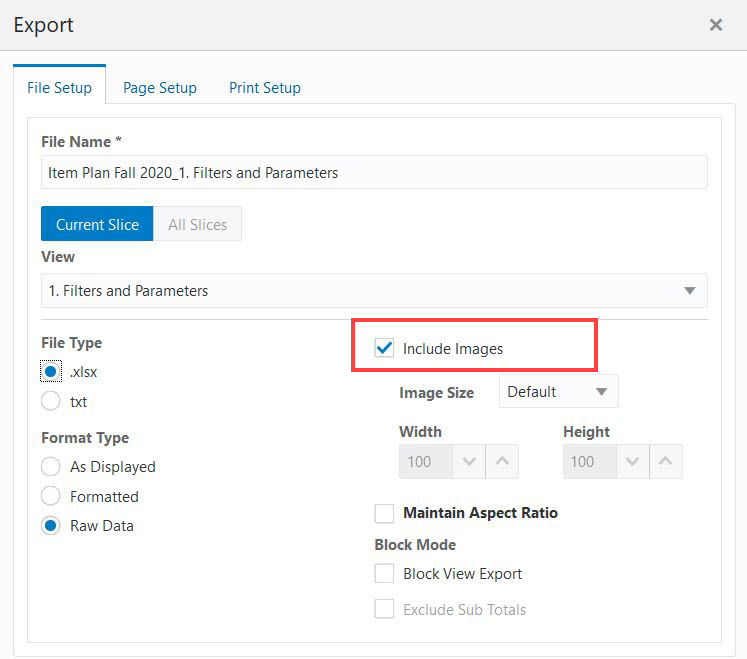
The Include Images check box is selected by default. This allows you to export the images present on the view such as product images, attribute images, measure images, along with other data.
When you clear the Include Images check box, RPASCE does not export the image.
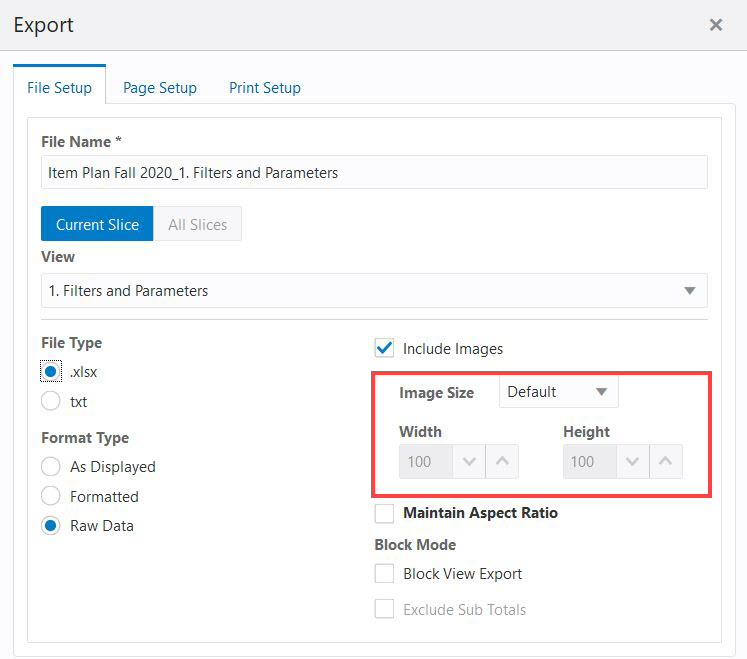
Select the image size of the exported images from the menu. This option is available only for Microsoft Excel. The three available values are Default, Large, and Custom.
The image size associated with the Default option and the large option can be changed by the administrator. The default values are set for both the cell width and the cell height.
Default Option, the width and height specified as 100 x 100.
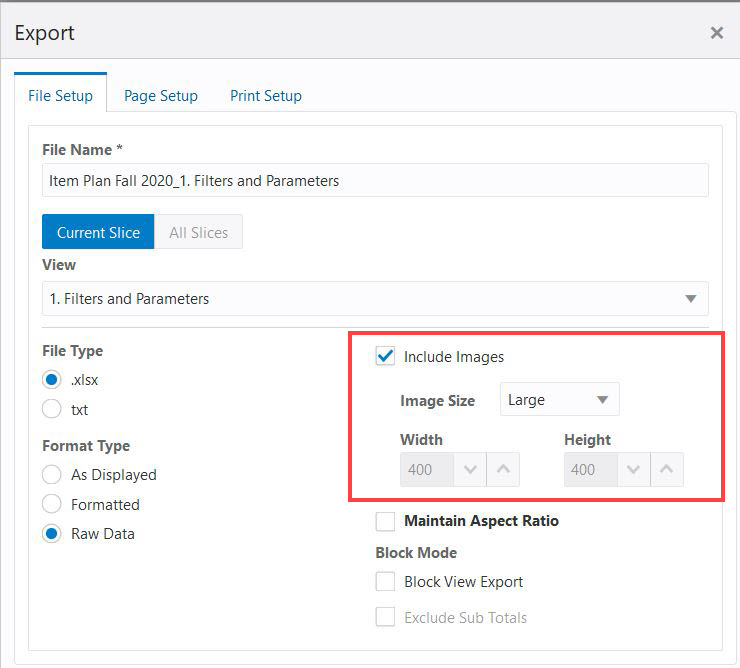
Large option, the width and height specified as 400 x 400.
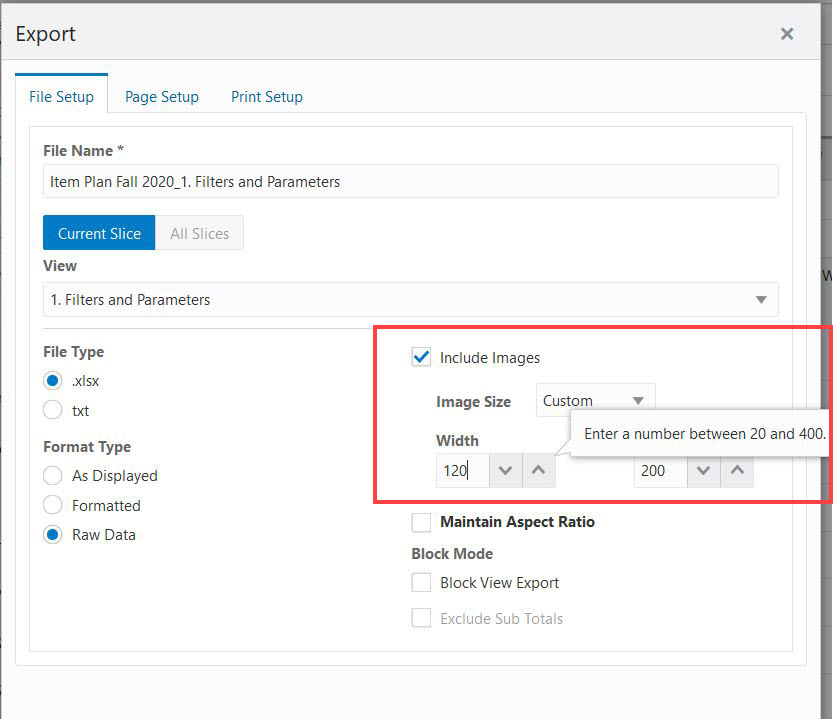
Custom option specifies a custom size within the bounds set by the administrator for the image cells in Excel. You can specify the width and height for the images.
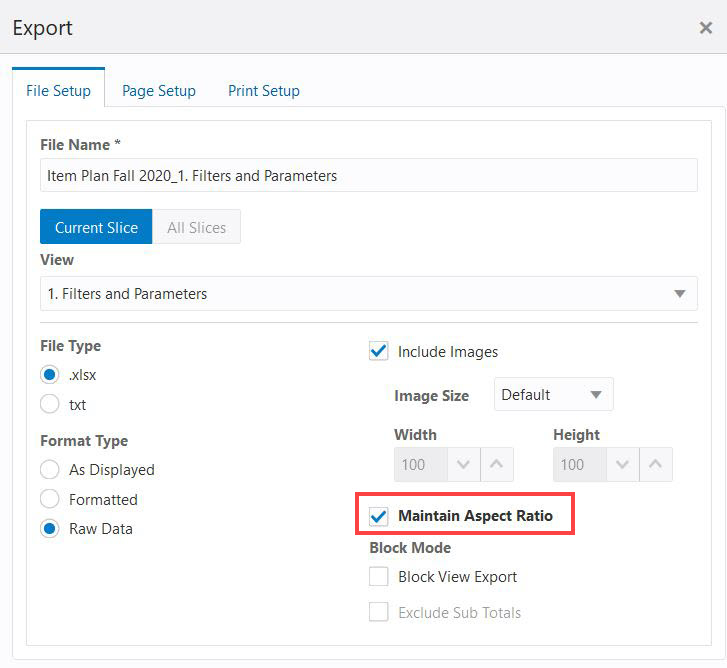
Use the Maintain Aspect Ratio in order to maintain the actual image aspect ratio. If not selected, the image aspect ratio can be stretched to the specified size.
Figure 11-10 Image Size Maintain Aspect Ratio
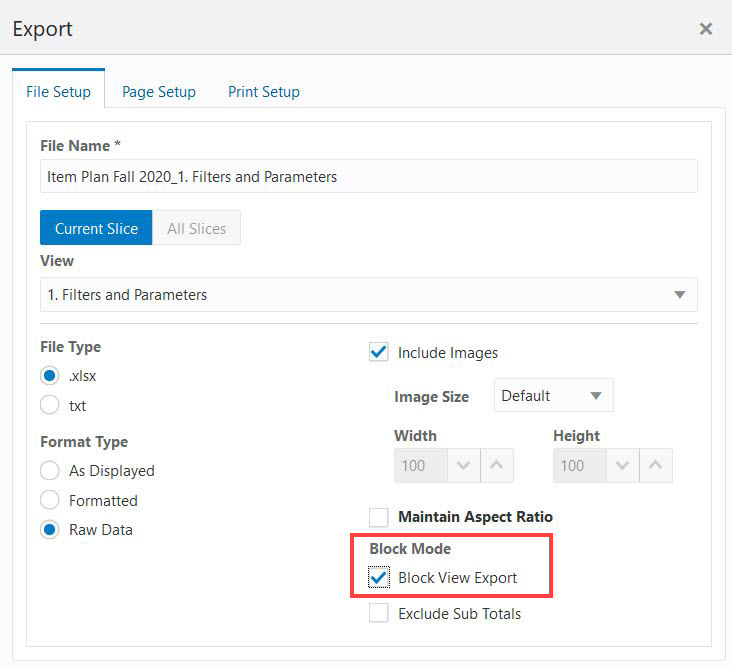
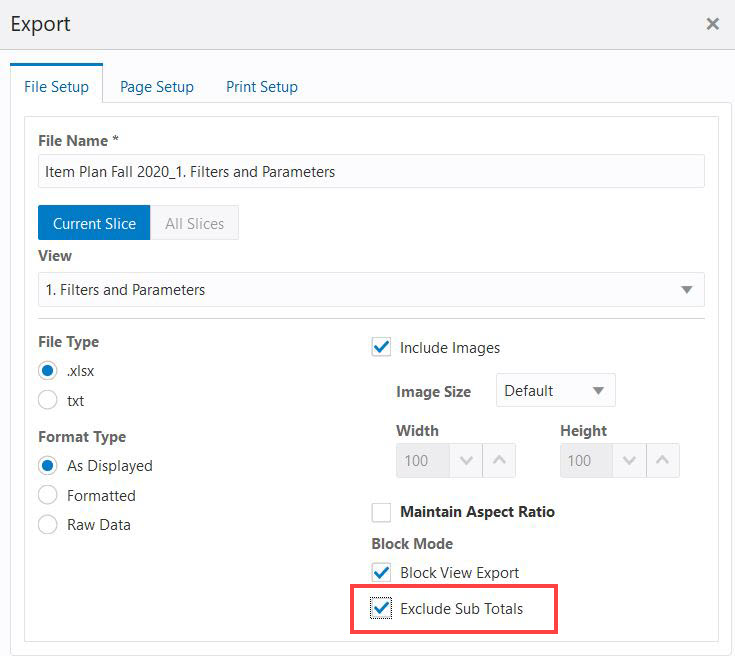
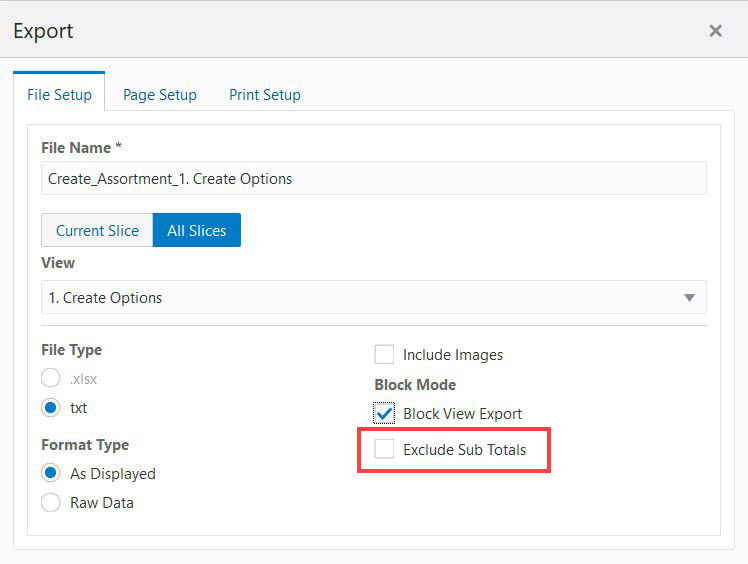
Use the Block View Export option to export all of the hierarchy levels in a single export file the separate column in excel file. It helps the user to filter the data conveniently in excel. Users can export the file as .xlsx or .txt.
Select the Exclude Sub Totals option to remove the rows with sub-total values of the parent level hierarchy in the export file. This option is enabled only when Block View Export is checked. You can export the file with block view and excluding sub-total in both .xlsx or .txt. formats.
Figure 11-12 Export Block View Exclude Sub-totals
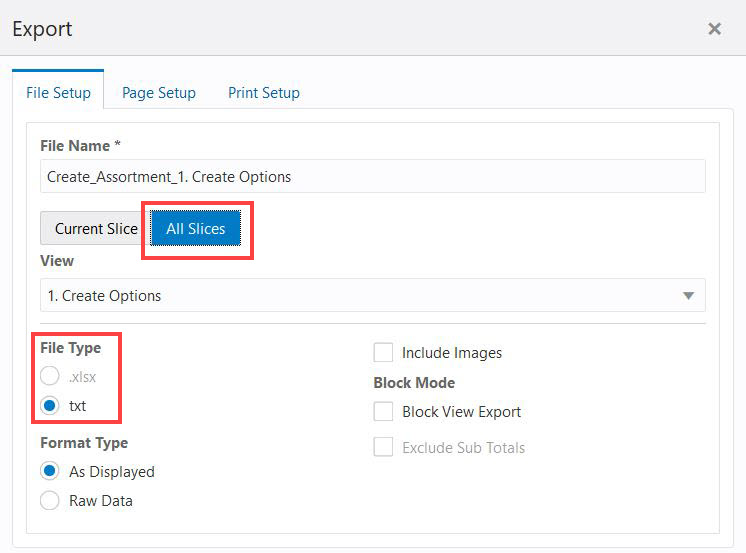
Perform the following steps to set options for All Slices.
Select the File Type as txt. The All Slice option is enabled only when txt is selected.
Enter the file name. The exported file will have the file name you entered.
Select the view that you would like to export for All Slices.
Figure 11-13 Export File Setup for All Slices
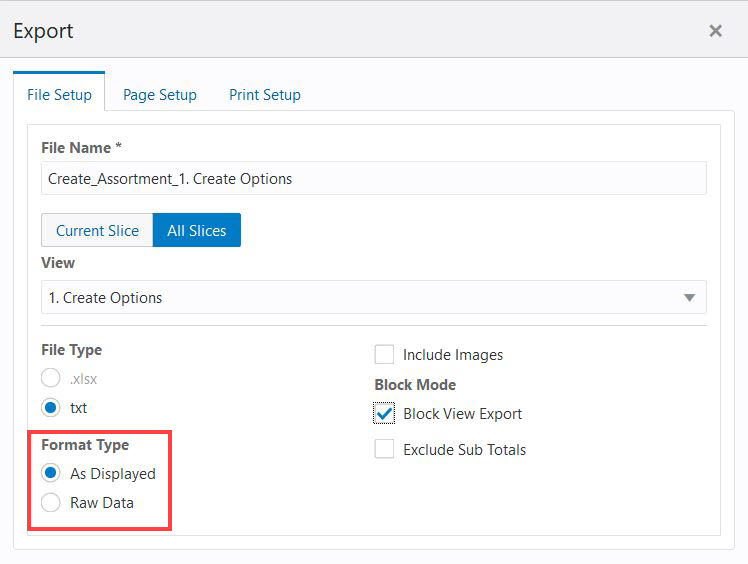
Use Format Type to specify the way that you want the data to be exported using the following options:
As Displayed: the data is exported as it appears in the Content area.
Raw Data: the exported data in the text file appears without number formatting.
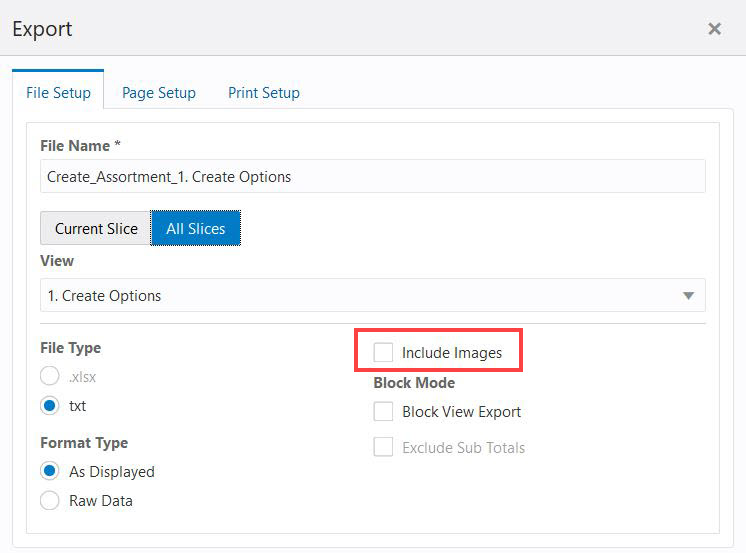
Selecting the Include Images check box allows you to export the images present on the view such as product images, attribute images, measure images, along with other data. The images are exported as URLs in a .csv file format for the All slice export.
When you clear the Include Images check box, RPASCE does not export the image.
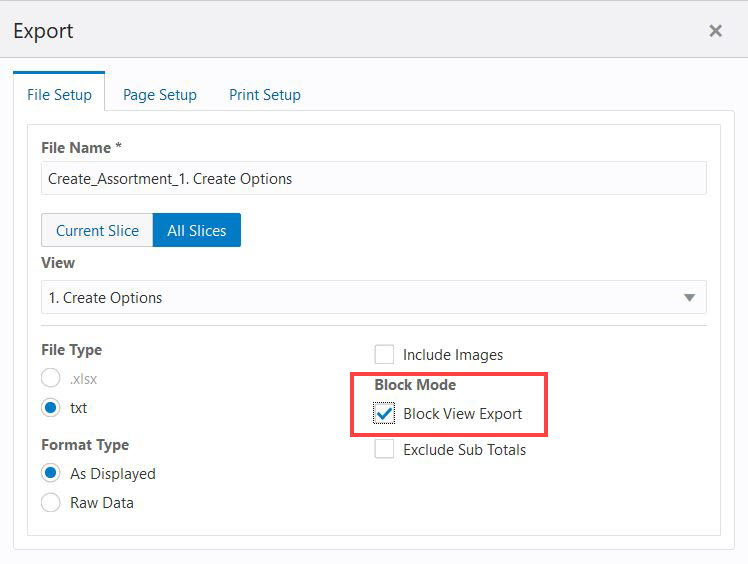
Use the Block View Export option to export all of the hierarchy levels in a single export file the separate column in an excel file. It helps you to conveniently filter the data.
Select the Exclude Sub Totals option to remove the rows with sub-total values of the parent level hierarchy in the export file. This option is enabled only when Block View Export is selected.
Figure 11-17 Export Block View Exclude Sub-totals
You can use the Page Setup tab to specify the page orientation, page scaling, and the header/footer. These options are described in this section.
Page orientation indicates the way in which a rectangular page is oriented for normal viewing. The two option are portrait and landscape. In Portrait mode, the page is taller than it is wide. In landscape mode, the page is wider than it is tall.
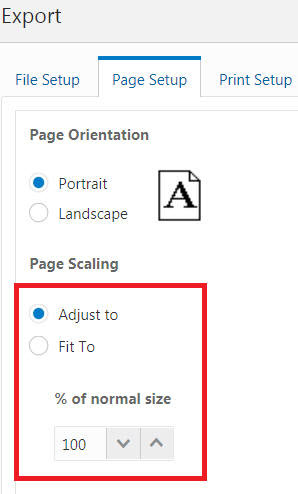
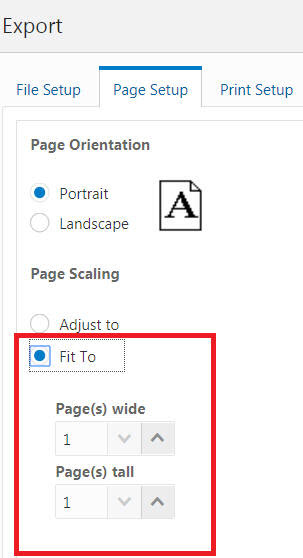
Page scaling has two options:
Adjust to is the % of Zoom to normal size. By default 100% is displayed. You can either adjust the value using the up and down arrow keys or type in the % value to zoom.
Fit To is used to scale the document to fit the pages width and tall. By default, 1 is displayed. You can either use the up and down arrow keys or type in a value to scale the page dimensions.
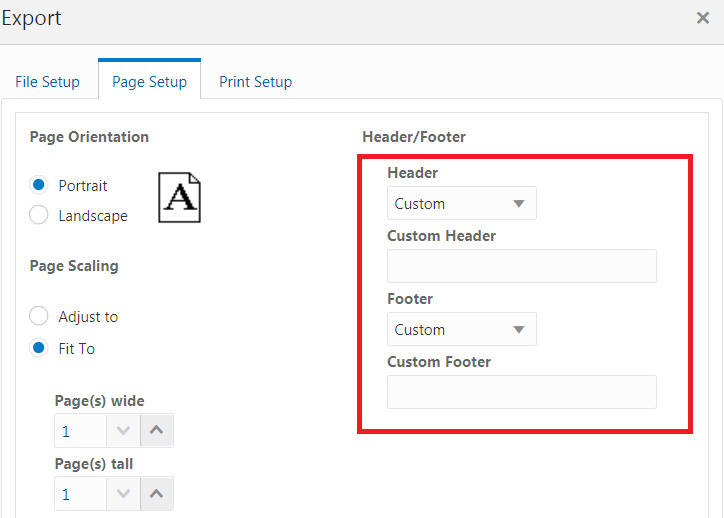
To specify the header and the footer, select Custom and add the header and the footer. By default, the Header and the Footer are specified as none.
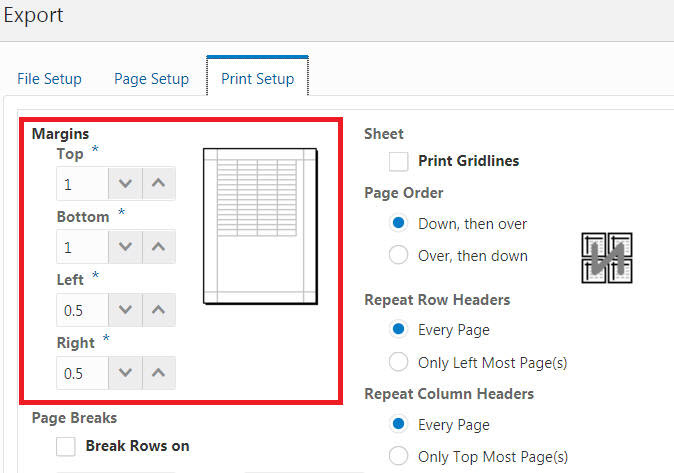
You can use the Print Setup tab to specify the page margins, page breaks, print grid-lines, page order, repeat headers, and repeat column header. These options are described in this section.
Margin is the area between the main content of a page and the page edges. Use the margin to define where a line of text begins and ends. When a page is justified, the text is spread out to be flush with the left and right margins.
You can specify Top, Bottom, Left, and Right margins.
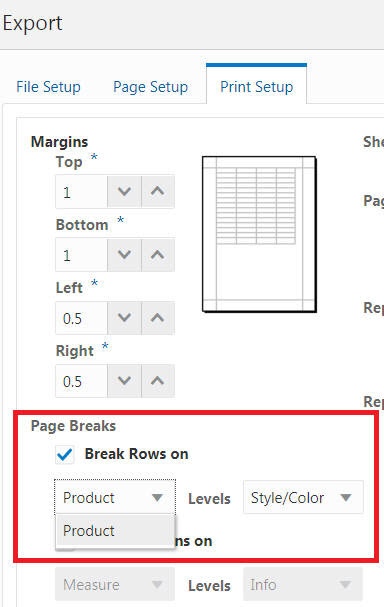
If you want space between the rows, select Break Rows on. This is used to select the x-axis dimensions of the selected view. If more than one, then both values are shown.
Figure 11-22 Print Setup Page Break Rows On
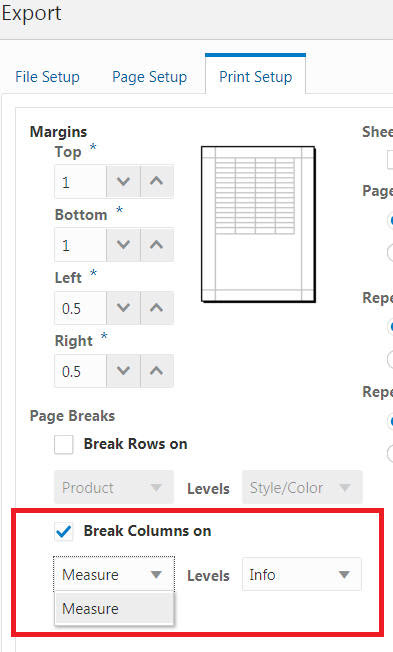
If you want space between columns, select Break Columns on. This is used to select the Z-axis dimensions of the selected view. If more than one, then both values are shown.
Figure 11-23 Print Setup Break Columns On
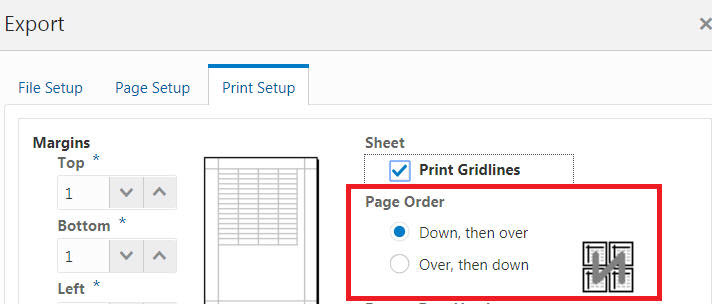
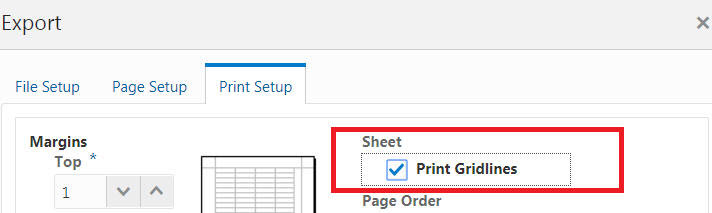
Use the print Gridlines option if you want the gridlines to be printed.
Figure 11-24 Print Setup Print Gridlines
Use Page Order to specify either Down, then over or Over, the down.
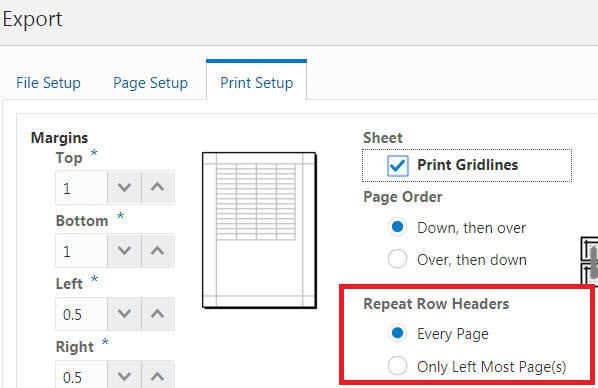
You can either repeat row headers every page or only on the left-most page.
Figure 11-26 Print Setup Repeat Row Headers
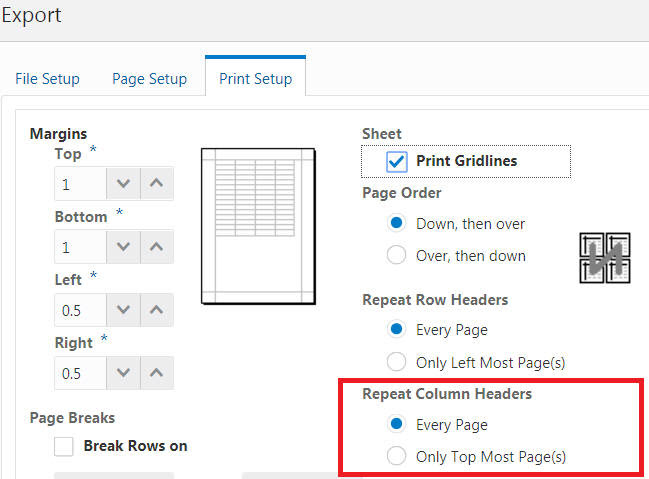
You can either repeat column headers every page or only on the top-most page.
Figure 11-27 Print Setup Repeat Column Headers
After you have completed file setup, page setup, and print setup, you can do the tasks described in this section.
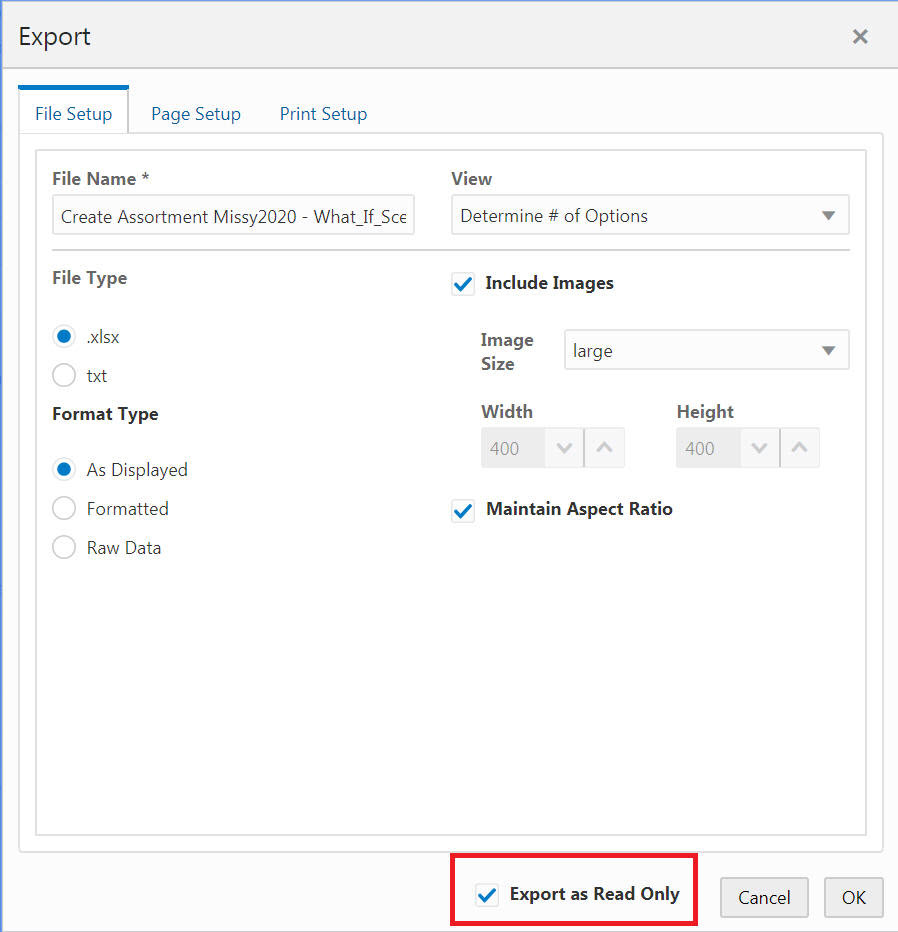
If you want the exported data to be read-only, select Export as Read Only. This prevents the data from being updated when it is opened after the export.
Figure 11-28 File Setup Export as Read Only
Click OK to download the view as specified and close the Export window.
Click Cancel to exit the export window without downloading.
|
Note: Excel supports only 1048576 rows and 16384 columns, if you are exporting more than this limit then you are notified with these failure messages:
This limit is also applicable to current slice |