| Oracle® Retail Predictive Application Server Cloud Edition User Guide Release 19.0 F24877-28 |
|

 Previous |
 Next |
| Oracle® Retail Predictive Application Server Cloud Edition User Guide Release 19.0 F24877-28 |
|
Previous |
Next |
This chapter describes special RPASCE features that you can use.
What-if scenarios are strategic method for scenario planning that a planner can use to make flexible plans while keeping the original scenario intact. These are additional plan versions that are created to simulate outcomes with different inputs. You use What-if scenarios to maintain and re-forecast the primary plan while preparing a stretch plan to quickly react to upward trends or more aggressive business growth targets.
You can perform What-if analysis with different KPIs and strategies from relatively simple, tactical decisions to the complex strategic planning. You can then promote the What-if scenario to be the primary plan.
You can also see all the scenarios of the plan from the Recent Plans section of Dashboard.
As a planner, you make a number of decisions that affect your plans. These decisions can be complex and you may spend a significant amount of time developing a potential plan before you know if it is optimal or not. Since the workspace contains a single version of the plan, you cannot compare different potential approaches in the workspace to decide which is best.
In order to address these difficulties, RPASCE provides What-if functionality. You can work within the segment workspace to create a plan. You can select between alternative approaches and create scenarios to evaluate a potential approach. These scenarios provide a copy of your main plan-in-progress. While you are working on a scenario, the changes you make only affect the data in the scenario and do not impact the main plan.
In order to prevent the mixing of data from multiple scenarios, the master scenario is provided. When a segment is built into a workspace, the initial data set is the only one present and so is the master data set. As you create more scenarios, the master scenario remains privileged as the only version that sends commits back to the domain. After you develop a scenario, you select that scenario as your plan.You use a promotion process to replace the master scenario with the selected scenario. That scenario becomes the new master scenario for all future operations performed within the workspace.
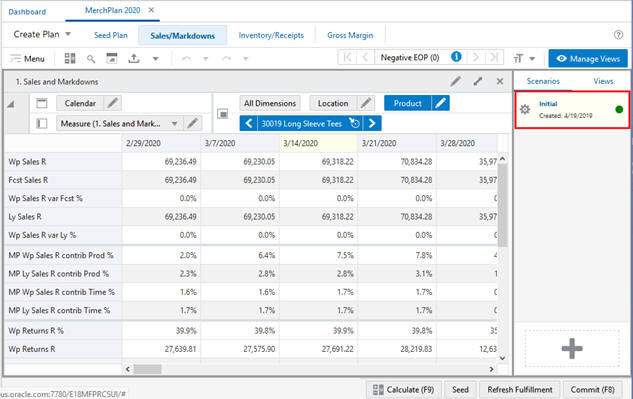
Figure 18-1 illustrates the main scenario and the green icon that identifies it.
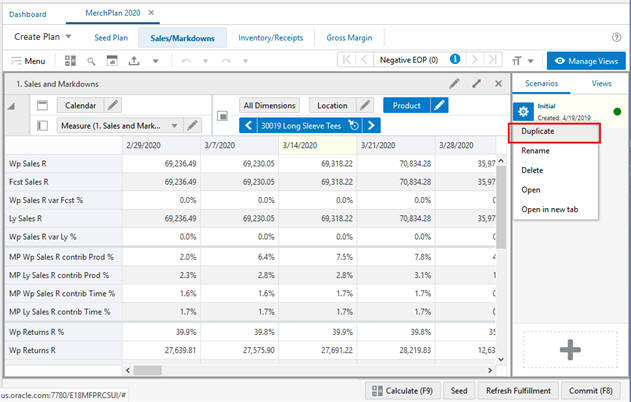
You cannot delete the master scenario. Since it is already open, the Open and Open in new tab options are also disabled. You can either duplicate the scenario to create another scenario or rename the scenario.
Click Duplicate Scenario and enter the appropriate label, and click OK to create a new scenario. You cannot use an existing label from the current workspace.
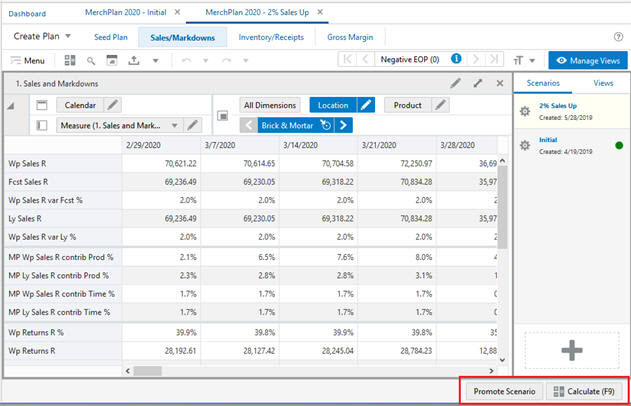
The new scenario is created and you can clearly differentiate the master scenario as follows.
Unlike the master scenario, the What-if scenarios cannot commit the data to the domain, as these scenarios are working copies. No action items are visible, except to promote the scenario to master scenario.
Figure 18-3 Master Scenario Identification
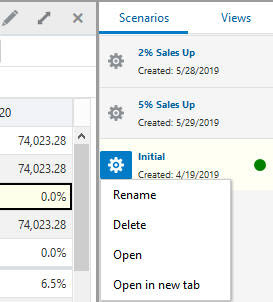
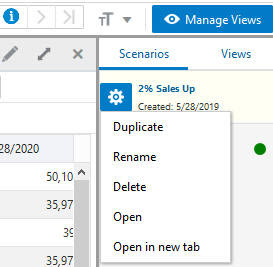
The actions Duplicate (to duplicate the scenario and create new one), Rename (to change the label of the scenario), Delete (to delete the scenario), Open (to open the scenario in the current browser window), and Open in new tab (to open the scenario in new browser tab window) are shown in Figure 18-5.
Figure 18-5 Actions Performed on a Scenario
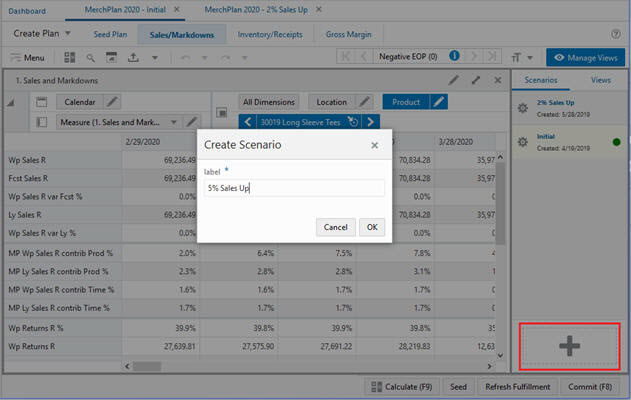
You can also create the scenario by using the + icon in the Scenarios section.
A maximum of three scenarios is allowed, including the master scenario. Once you have created three scenarios and the master scenario, the + icon and the duplicate action are not available and you cannot create more scenarios.
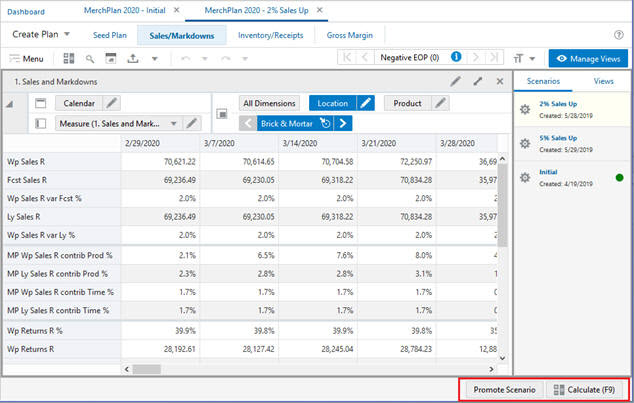
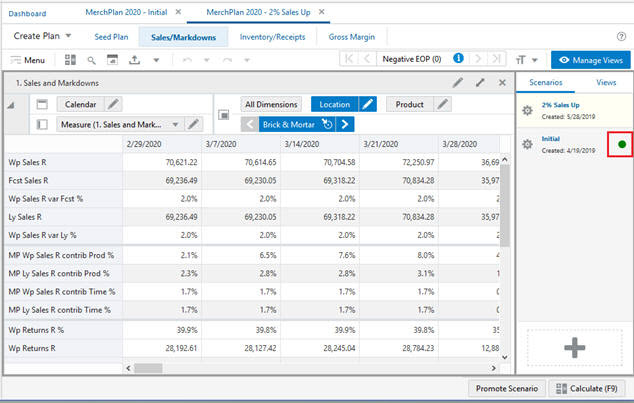
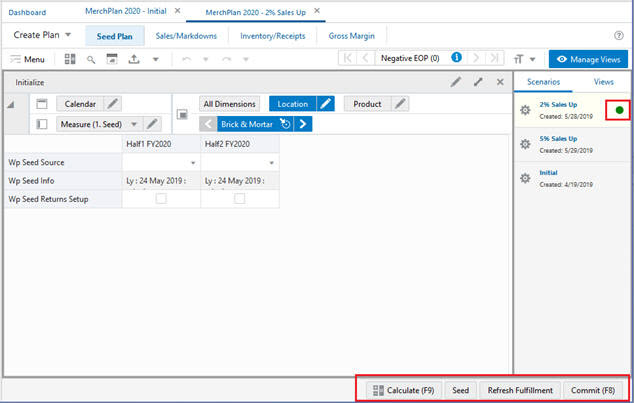
You can delete the scenario in order to create a new scenario. You can promote the scenario to master scenario. In Figure 18-8, the 2% Sales Up scenario is promoted to the master scenario by clicking Promote Scenario.
After you click Promote Scenario, a toast notification is displayed, as shown Figure 18-9. Here you can either dismiss the notification or undo the promote scenario. If you dismiss the notification, the 2% Sales Up scenario is promoted to the master scenario. If you click Undo, the 2% Sales Up scenario is not promoted to the master scenario, and the earlier master scenario continues as master.
Figure 18-9 Toast Notification During Promote Scenario
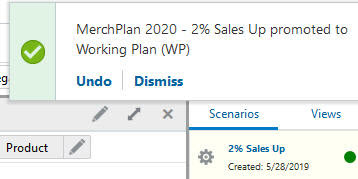
The 2% Sales Up scenario is now the master scenario and you can commit the data.
Figure 18-10 What-If Scenario Promoted to Master Scenario
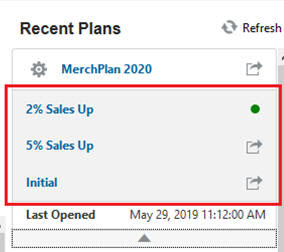
You can view all the scenarios from the recent plans section of the dashboard.
Figure 18-11 View Scenarios using the Dashboard
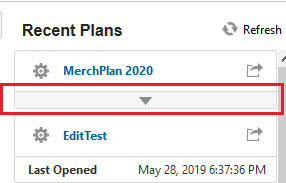
Click the down arrow under the workspace to see all the available scenarios for the workspace. The green icon indicates the master scenario. You can view the last opened date and time for the workspace.
You can either launch the workspace scenarios in the same browser or in a new browser tab for quick comparison.
The ability to view images associated with positions on a dimension is useful in many aspects of the retail world such as assortment planning, item planning, and story boarding.
For example, you can associate an item with an image being displayed on the shelf. You can associate stores with images of the store front or interior. You can use images to storyboard themes by creating a collection of looks and colors for a particular buying period, floor set, or flow. Some retailers associate multiple types of images with multiple levels of the Product dimension. For example, you can associate images for product levels such as Department, Class, Subclass, Style and Style/Color.
With RPASCE, you can associate an image for any dimension with a configured media attribute, including calendar levels. These images can be stored on a website that must be declared under the safe hosts for the application to display the images.
Images can be included in a domain by configuring media dimension attributes, loading them with media bundle values referring to images, and making them visible in worksheets. A number of images may be included in each bundle value; one of those is designated as the primary image that can be seen in the pivot table. All the images, not just the primary, can be seen using View/Manage Images.
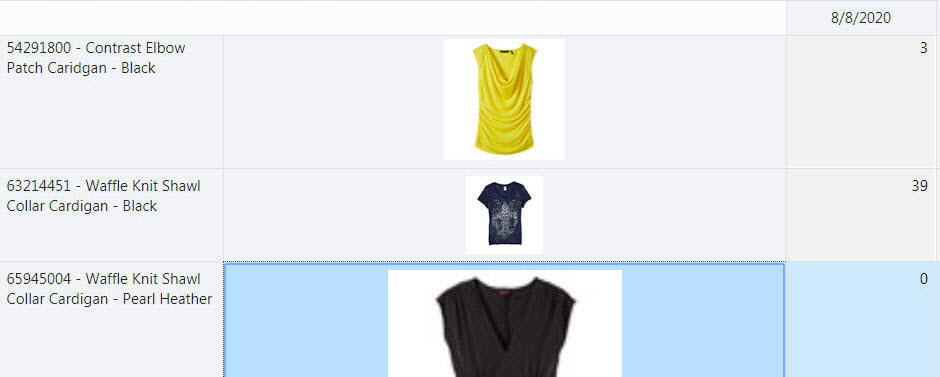
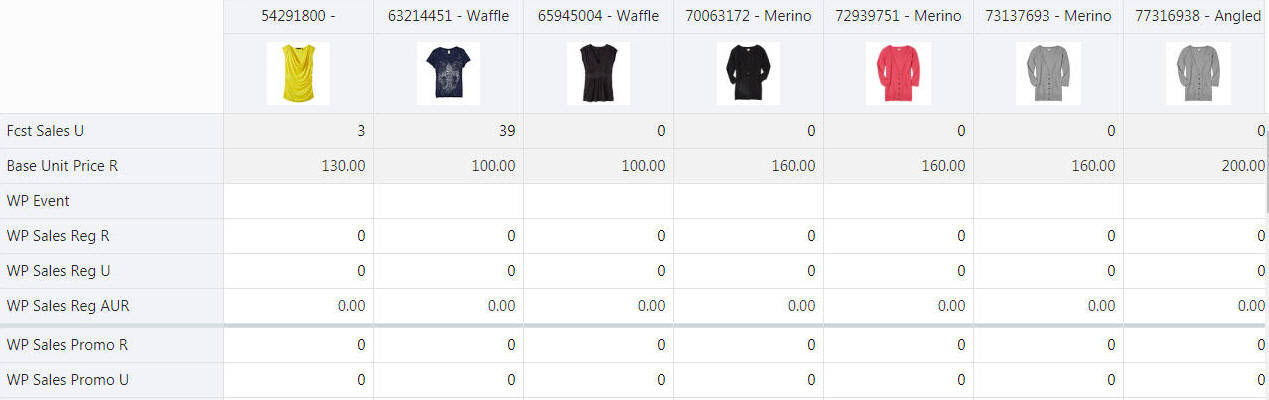
Pivot table headers display images for visible media dimension attributes. If there is more than one visible image attribute, all of their primary images (thumbnail-sized version) will be shown in a carousel control. Only one of the images can be seen at any given time. The user can scroll through all the images by clicking the left and right arrow controls that appear on either side of the image.
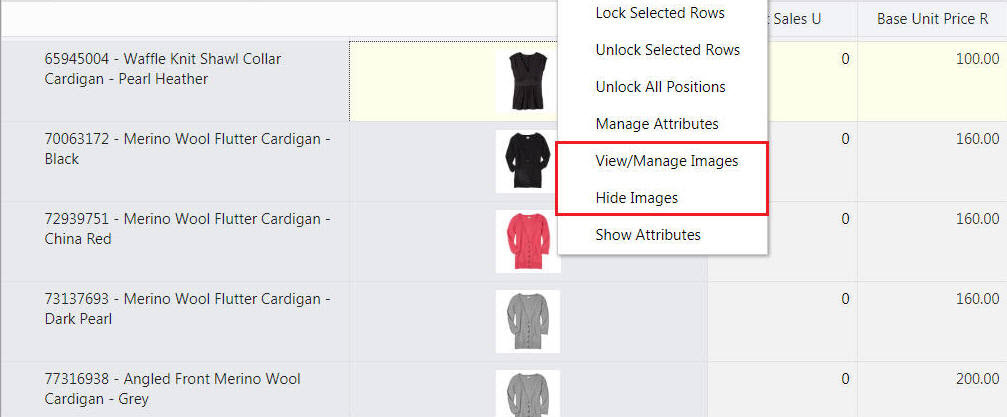
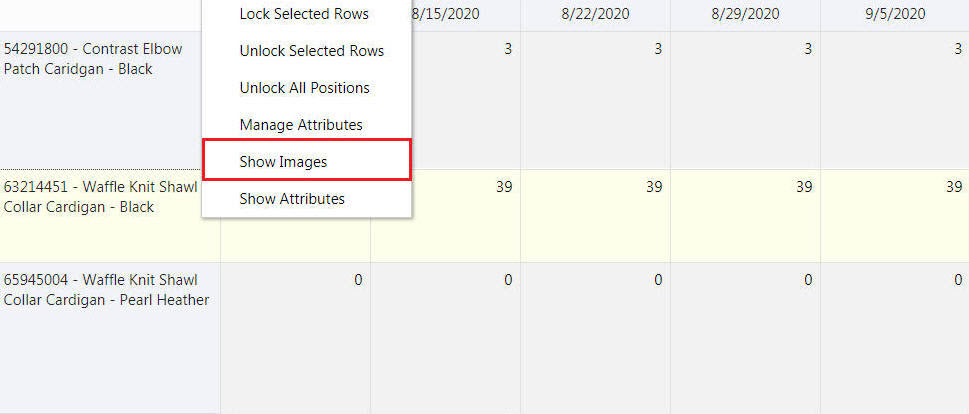
You can right- click the Images and perform the following actions:
Format: Launches the Format window
Lock Row: Locks the whole row where the image exists
Unlock Row: Unlocks the whole row where the image exists
Unlock All: Unlocks all the rows wherever locked earlier
View/Manage Images: Launches the View/Manage Images window
Hide Images: Hides the images.
Show Images Separately: Separates images and attributes into separate cells. Not available if attributes are hidden
Show All Attributes Together: Shows the images and attributes in a single cell.
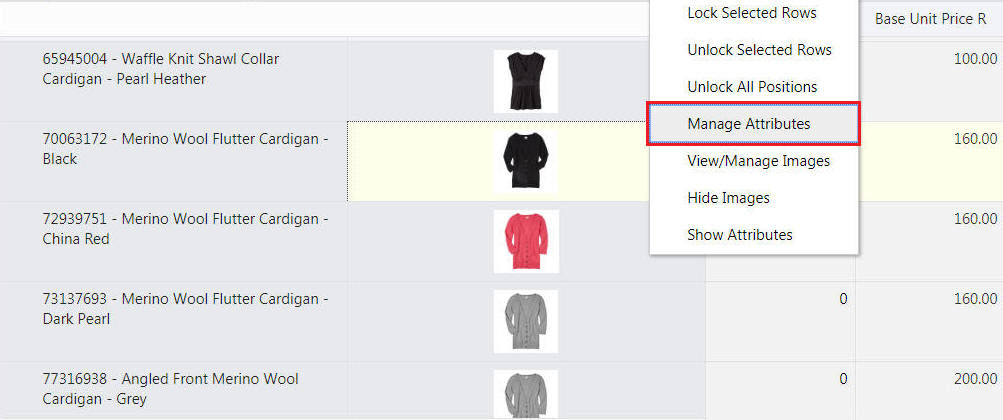
Click Manage Attributes to open the Edit View Details tab with the Attributes tab. You can choose to view and sort attributes in the view. You can also select the attribute images for selection.
To sort or view attributes, complete the following steps:
Select or clear the boxes to the left of the attribute name positions to viewing and sort availability of particular attributes.
Figure 18-16 Select Attributes for Viewing and Sorting Positions
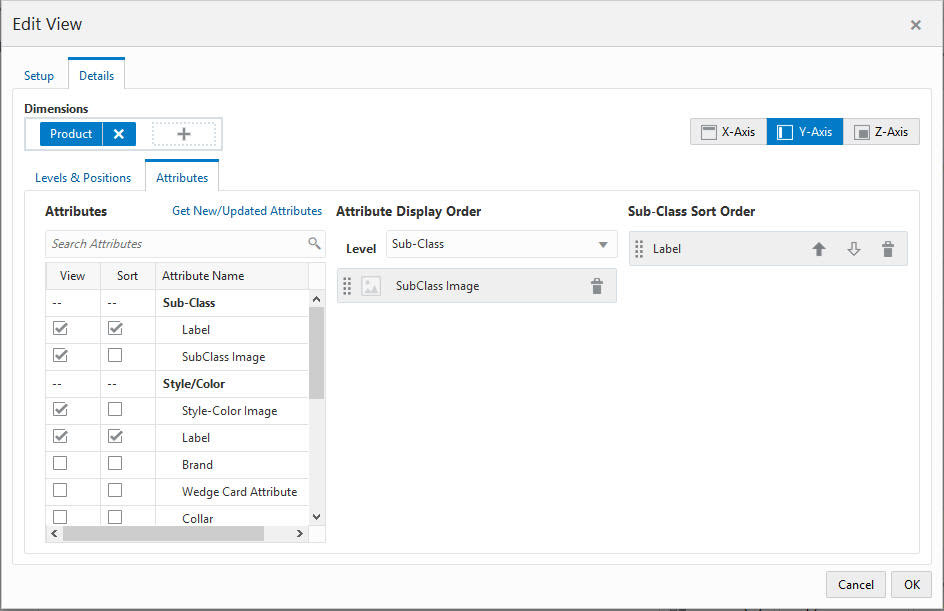
You can change the attribute display order by dragging and dropping the attributes or delete them from display order by clicking on the delete icon. You can also use the level selection to view the attributes at particular hierarchy level.
You can change the selected level sort order by changing the ascending and descending order arrows or delete them from sort order by clicking on the delete icon.
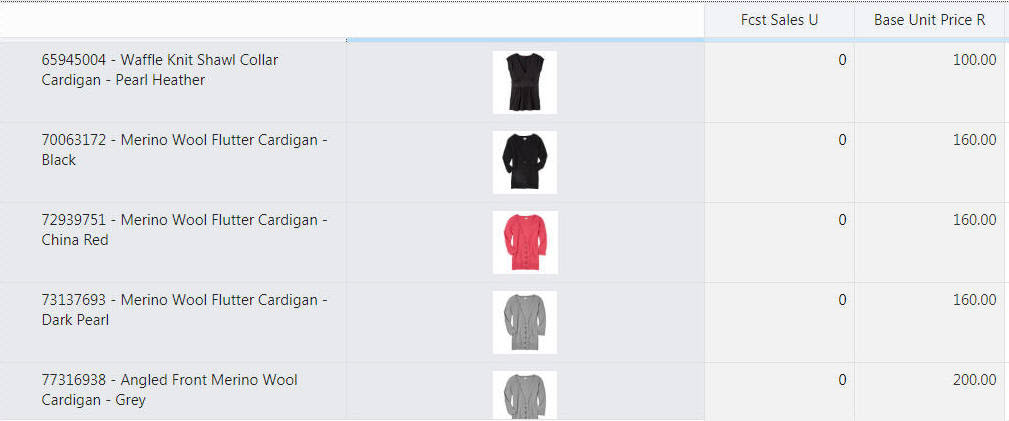
Right click on the images to launch the View and Manage Images Window. You can view the dimension and level of the image displayed. You can search for a particular position by using the search box or scroll bar. You can view the image as full or thumbnail and the main image (default) along with any other existing images for that level.
Figure 18-17 View and Manage Images Window
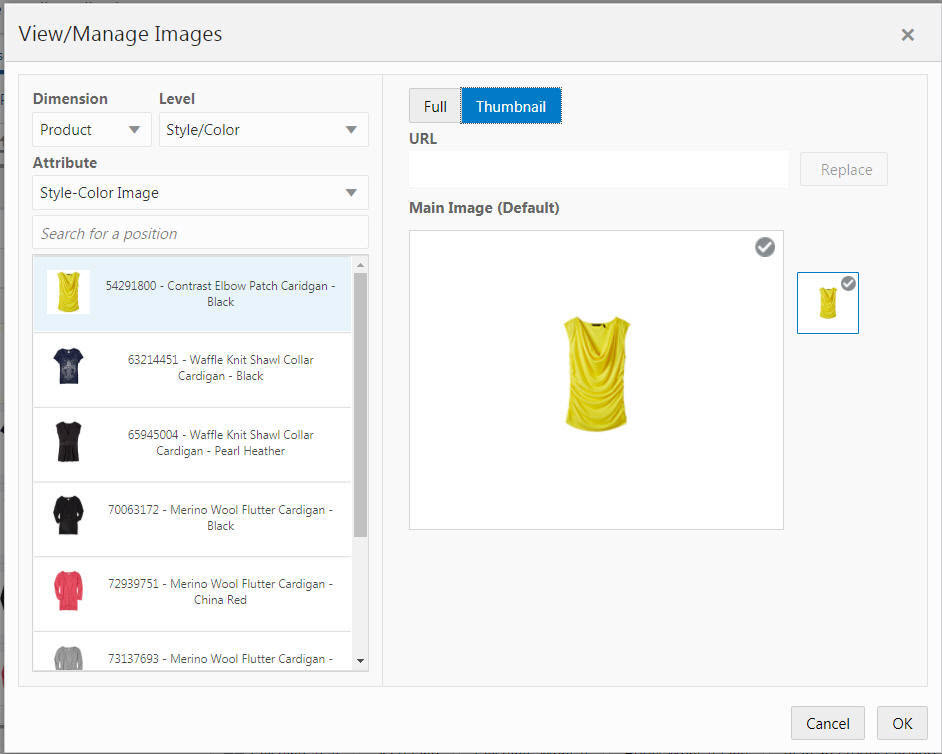
Using the URL Field
The URL text box in the View and Manage Images Window allows you to:
Add new thumb and full sized images for dimension positions that do not have any images.
Replace existing thumb and full sized images associated with dimension positions.
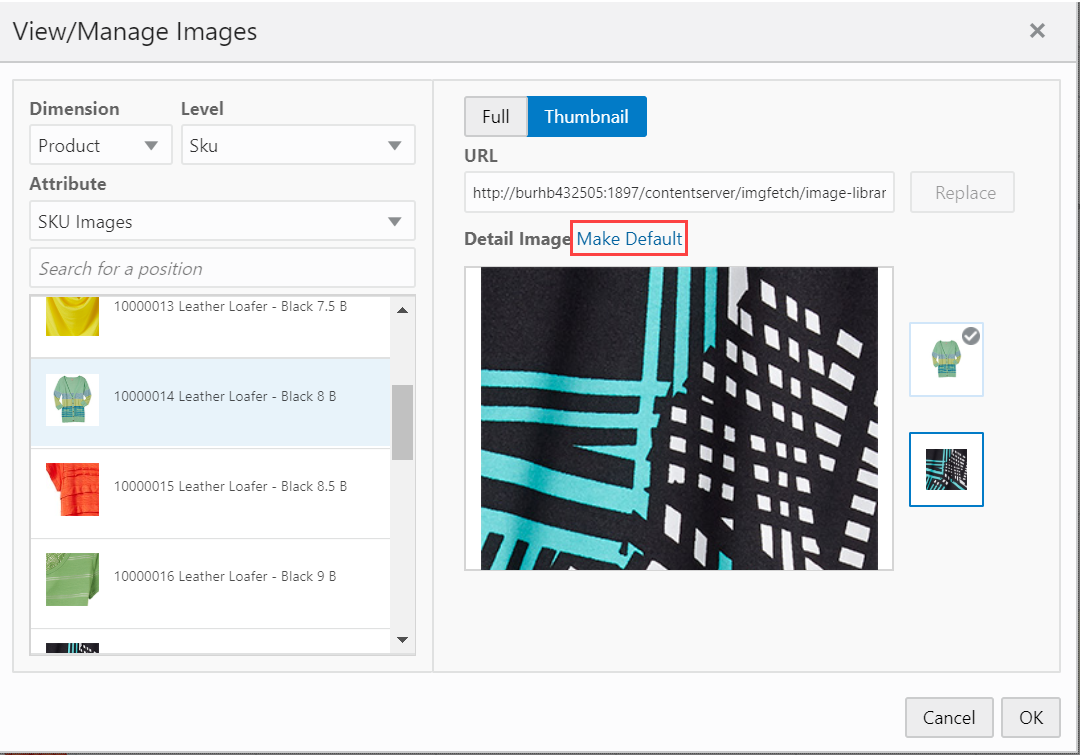
Designate an existing image as the default image for a position by clicking Make Default as shown in Figure 18-18.
Figure 18-18 Make Default Link for an Image
Validate your inputs by only allowing:
URLs that are validated by the hosts
Images of valid file types
To save any updates or changes made, click OK.
To clear any updates or changes made, click Cancel.
|
Note: The width of row header layer and the height of column header layer cannot be resized beyond a particular point. |
You can resize the image rows and columns in pivot table and see them persisted so that you do not have to resize them. Images should auto-scale to fit the header cell, but never increase beyond their native size.
|
Note: The width of row header layer and the height of column header layer cannot be resized beyond a particular point. |
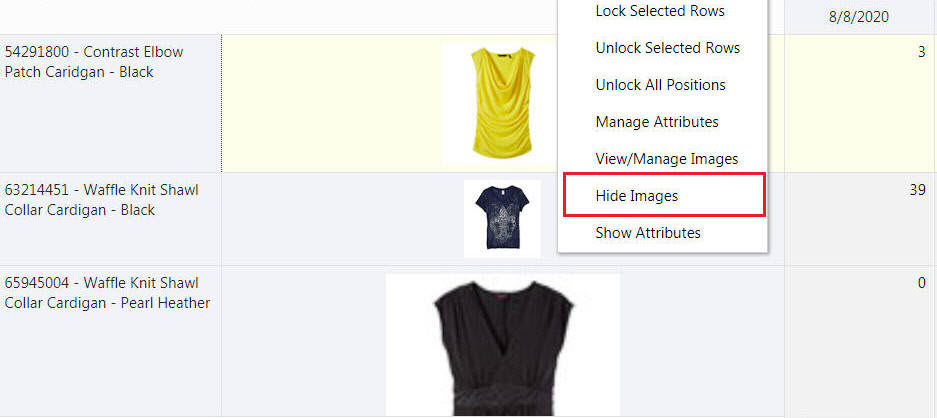
Right click on the Images and click Hide Images to hide the images.
In order to view images, you can click on the dimension position where images are enabled and click Show Images.
You can change the axis of the dimension and the images are rearranged
Figure 18-22 Image Display with Axis Pivot
The default No Image icon is displayed when no image is associated with the dimension position. If an image URL is associated but RPASCE cannot show the image, then the Broken Image is displayed.
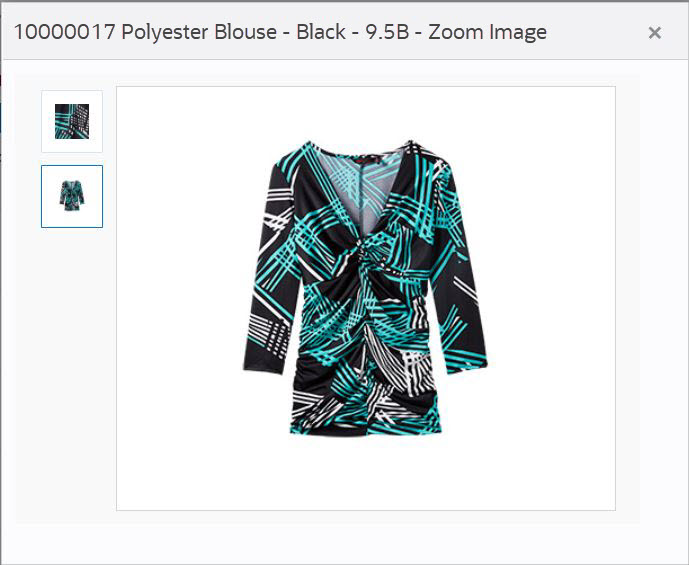
Double-click the image to expand it and get a better look. The enlarged image gives a better understanding of the image. After double-clicking the image, the enlarged image opens in a window that opens in the middle of the screen. On the expanded image window, you can see all facets of image shown on the left side, the position name on top of the dialog box. You can hover over the expanded image to see the zoom-in image.
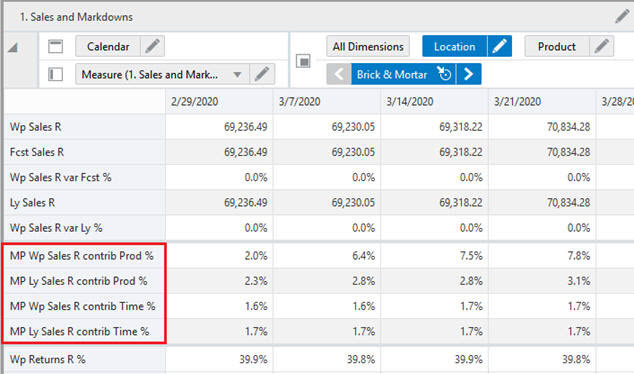
You can use an extended measure to define, view, and edit a measure as a proportion or percentage of another measure for a parent that is up one or more levels. These measure relationships are also referred to as participation measures. These measures are defined in the pre-configured RPASCE in a view using the configuration.
This functionality is commonly used to define measures that are percentage participations of sales measures. Typically, these measures are defined as:
Absolute Percent of Parent: A percentage of a fixed level (such as class) so that the participation of each item to the class can be viewed and manipulated.
Relative Percent of Parent: A percentage to the next level shown in any dimension (such as Product).
Ranking: A value that indicates the relative order of positions in either ascending or descending order.
Cumulative Sum: A sequence of partial sums of a given sequence, based on an ascending or descending rank.
Cumulative Percent: A sequence of partial sums of a given sequence, based on an ascending or descending rank expressed as a percentage to the total.
Note the following:
Extended measures can be defined only on measures that have Total as their default aggregate method.
When the percentage of the extended measure is changed, values of the underlying measure change to reflect the newly set percentage.
Multiple extended measures can be defined for the same underlying measure; however, only one extended measure or the underlying measure can be edited before calculation. All other versions are protected.
Smart editing is not allowed in the extended measure.
The value of an extended measure is a fraction between zero and one. If desired, you must format the measure to be displayed as a percentage.
For extended measures contributions in instances with very small values (such as 0.000001) in the cell, those values are considered to be 0.0 when the extended measures contribution is determined.
For Ranking, Cumulative Sum, and Cumulative Percent, the extended measures are read only.