| Oracle® Retail Predictive Application Server Cloud Edition Administration Guide Release 22.2.401.0 F72005-01 |
|

 Previous |
 Next |
| Oracle® Retail Predictive Application Server Cloud Edition Administration Guide Release 22.2.401.0 F72005-01 |
|
Previous |
Next |
This chapter provides details about additional configuration for RPASCE.
Self-Service System Configuration provides administrators with the capability to update client-side system properties from the application. The administrator can now update various properties relating to administration status tasks, alert, chart, dashboard, export, image, logging, and separators, and format properties from the application. This feature lets you manage and support your team's operational needs.
The admin user can access the self-service feature from the Settings icon available at the bottom of the left sidebar menu.
You can use the system configuration to manage the following:
Config Properties
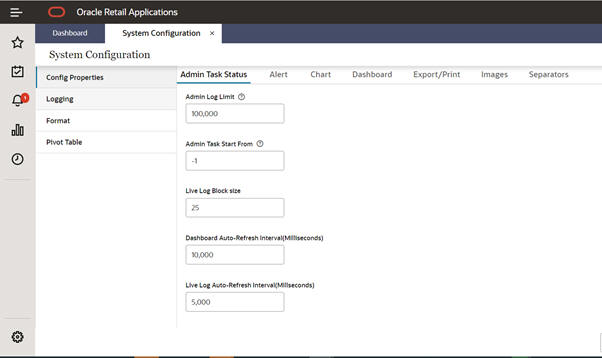
Use this tab, shown in Figure 16-1, to manage the system parameters saved in the config.properties file for various functions such as administration status tasks, alert, chart, dashboard, export, image, logging, and separators. A form-based interface is displayed for updating the properties. Indicators for certain properties give a brief description of property.
All the numeric value property field indicate the allowed range of values for each property. The tab name appears in italics to show where the changes have be made.
Admin Task Status
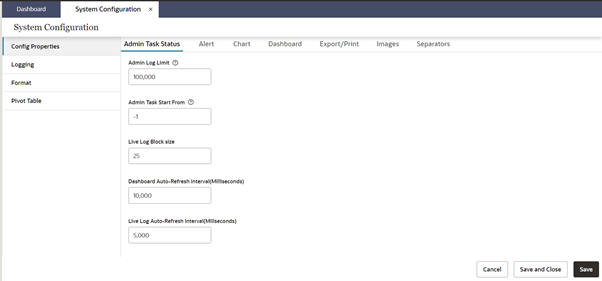
Use this tab, shown in Figure 16-2, to update the properties related to admin task status. The following properties can be updated:
Admin log Limit - Specify the number of lines in the admin logs. The range of permitted values is between 5,000 and 200,000.
Admin Task start from - Define the logging start from start (0) or end (-1) of the file.
Live Log Block Size - Enter the block size of the live log. The range of permitted values is between 20 and 30.
Use short name for entities - Toggle button to indicate whether you require short names for the entities in the status.
Dashboard Auto-Refresh interval - Update the auto-refresh interval time for the admin dashboard in milliseconds. The range of permitted values is between 1,000 and 86,400,000.
Live Log Auto-Refresh interval - Update the auto-refresh interval time for the live log. This is in milliseconds. The range of permitted values is between 1,000 and 86,400,000.
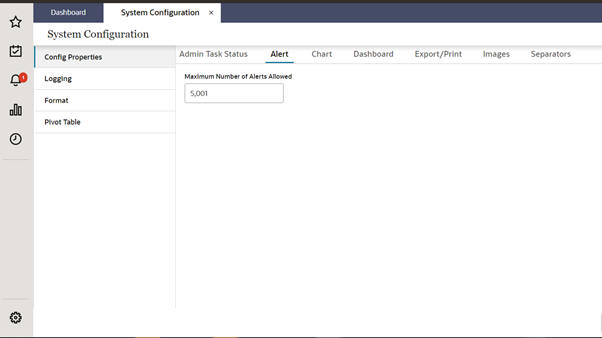
Alert
Use this tab, shown in Figure 16-3, to update the alert properties. You can update the maximum number of alerts allowed. The range of permitted values is between 1,000 and 10,000 alerts.
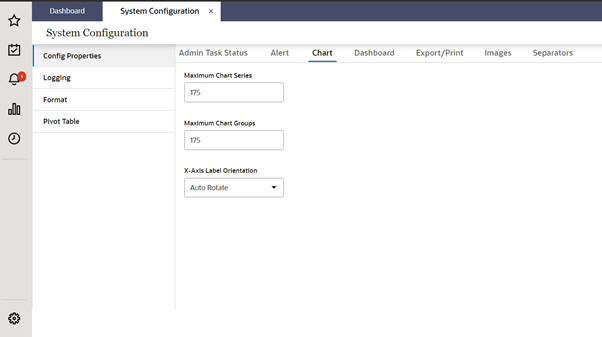
Chart
Use this tab, shown in Figure 16-4, to update the chart properties. The following properties can be updated:
Maximum chart series - The maximum number of series allowed in charts. The range of permitted values is between 100 and 200.
Maximum chart group - The maximum number of groups allowed to plot in charts. The range of permitted values is between 100 and 200.
X-axis Label Orientation - Select x-axis label orientation. The auto-rotate option is used to select the orientation of the x-axis labels, depending on the number of items in charts. The horizontal orientation option is used to display the x-axis label horizontally.
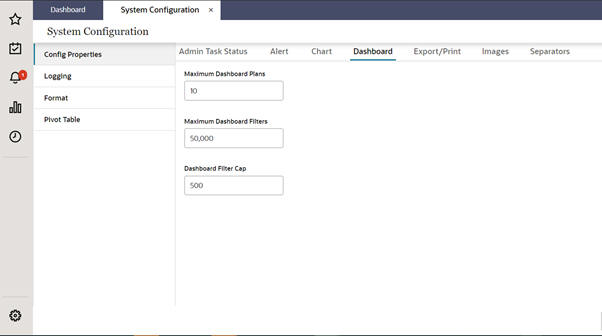
Dashboard
Use this tab, shown in Figure 16-5, to update the properties related to dashboards.
Maximum Dashboard Plans - The maximum number of plans for a dashboard. The range of permitted values is between 0 and 50.
Maximum Dashboard Filter - The maximum number of filters permitted in a dashboard. The range of permitted values is between 0 and 100,000.
Dashboard Filter Cap - The filter cap for a dashboard. The range of permitted values is between 0 and 1,000.
Show Retail Home Tasks - Toggle button used to show/hide retail home tasks.
Export/Print
Use this tab, shown in Figure 16-6, to update the properties related to export and print functionality. The following properties can be updated
Maximum print/Export cells - The number of cells that can be exported from the system. The range of permitted values is between 0 and 5,000,000.
Note that in the Export/Print tab, you can set the property for the maximum print/export cells. If this property is set to 0, all the cells are exported. However, an out-of-memory error may occur on the server, depending on the size of the data being exported. Use this setting with caution. Users can use the export All slice feature for exporting a large amount of data.
Even if the property is set to 0 to export all the cells, the export will comply with the Excel limit. Excel supports only 1048576 rows and 16384 columns. If the data you are exporting exceeds this limit, you will see one of the following failure messages:
-There are too many rows in the view. The file cannot be exported with more than 1,048,576 rows and 16384 columns. Please reduce the amount of rows and try again.
There are too many columns in the view. The file cannot be exported with more than 1,048,576 rows and 16384 columns. Please reduce the amount of columns and try again.
Cell Image height and width - Use this to provide the cell image height and width allowed during export. The range of permitted values is between 50 and 200.
Large Image height and width - Use this to provide the large image height and width allowed during export. The range of permitted values is between 100 and 500.
Image Type - Specify the type of image to be exported in the output file.
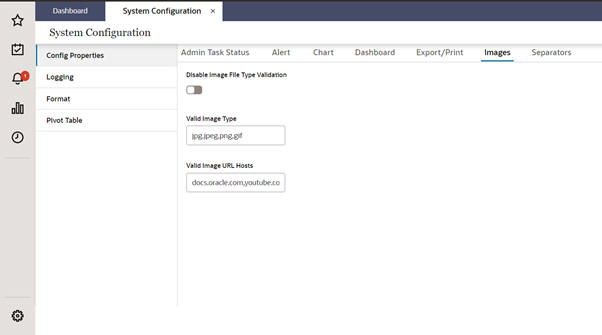
Images
Use this tab, shown in Figure 16-7, to update the following image-related properties.
Disable Image file type Validation - Toggle button to indicate whether or not you require file type validation for the images in your system.
Valid image type - The image file types that are valid for your application.
Valid Image URL hosts - The valid URL hosts for your application.
Logging Properties
Use this tab, shown in Figure 16-8, to specify the logging properties. You can update the following:
Server log levels - Update the log levels as per the requirement (that is, info, debug, error).
Enable Latency logging - Toggle button to enable or disable latency logging.
Latency Logging interval - Set the latency logging interval between the server and browser. The range of permitted values is between 15 and 900 milliseconds.
Enable latency measurement - Toggle button to enable or disable the latency measurement.
Latency Measurement Threshold - Set the value for the maximum tolerable latency in milliseconds. The range of permitted values is between 50 and 400.
Enable transaction logging - Toggle button to enable or disable transaction logging.
Maximum selection size for cut, copy, paste - Set the maximum selection size for cut, copy, paste, fill, or clear operations. The range of permitted values is between 5,000 and 15,000.
Enable Performance Measurement - Toggle button to enable or disable the performance measurement.
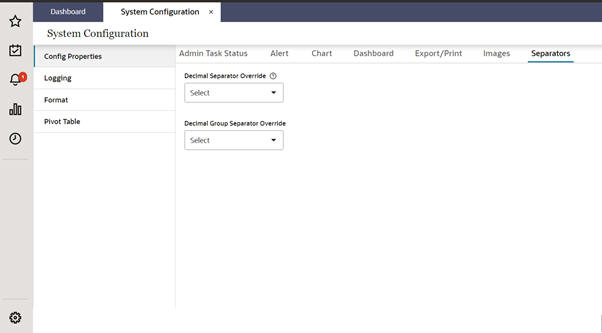
Separators
Use this tab, shown in Figure 16-9, to set the separators.
Decimal separator override
Decimal group separator override
Note the following:
Either both or neither of the separators must be defined.
The value of both the separators must be unique.
If a decimal group separator override must be a space, then you must enter the word "space" instead of the character space.
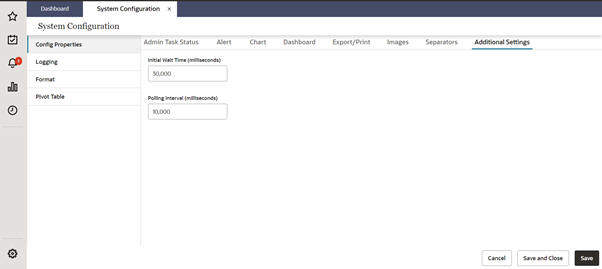
Additional Settings
This tab, shown in Figure 16-12, is hidden by default and can be accessed via Online Admin Tools.
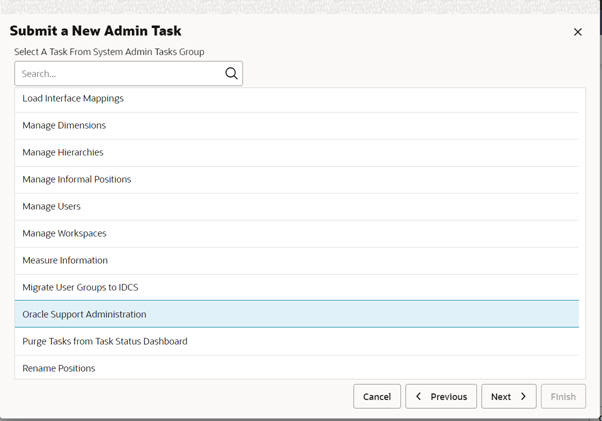
Launch Online Admin Tools and select the System Admin Tasks. Click Next.
Select Oracle Support Administration, as shown in Figure 16-10.
Figure 16-10 Oracle Support Administration
Select the appropriate settings, as shown in Figure 16-11, and submit the task.
Figure 16-11 Oracle Support Administration Settings
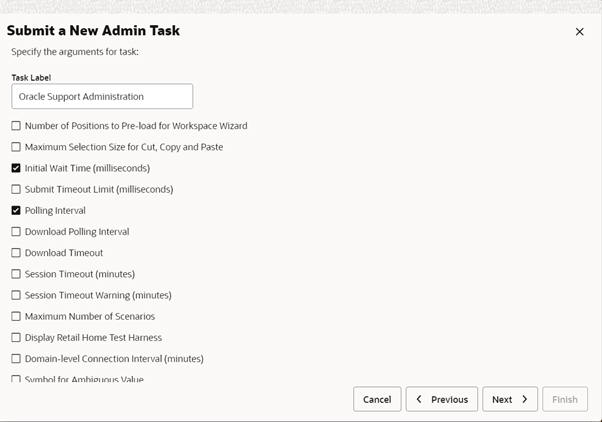
Once the task is complete, the Additional Settings tab, shown in Figure 16-12, becomes visible and the settings/configuration properties selected in the task are available.
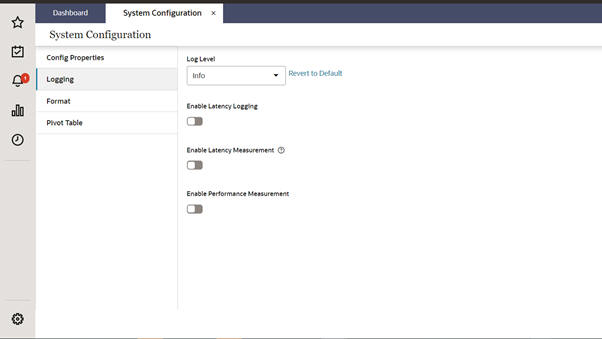
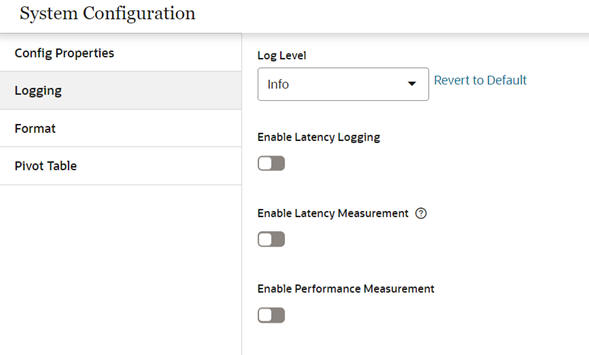
Logging
Use this tab, shown in Figure 16-13, to set the log level and enable/disable latency-logging, latency-measurements, and performance-measurements. You must save and log in again in order for the changes to take effect.
Log Level
Use the log level drop-down list to select appropriate log levels. The RPASCE Client application supports the following log levels.
Table 16-1 Log Levels
| Log Level Name | Log Level Definition |
|---|---|
|
Off |
Used to turn off all logs. |
|
Fatal |
Used to log severe errors that require immediate attention.These situations either impact the normal operation of the entire application or a component within the application. |
|
Error |
Used to log errors. Critical errors and information are logged at this level. |
|
Warn |
Used to log messages regarding potentially harmful situations. These situations do not affect the running of the RPASCE Client application, but may not give the desired result. For this reason, it is preferable to warn the user about such situations. |
|
Audit |
Used to log messages that indicate a change, including workbook builds, save, commit, and so on. Most of these may already be reflected in the UI or are available on Admin Task Status. |
|
Info |
Used to log general information about user actions and main events (for example, if the login was successful or not). This is the default log level. |
|
Profile |
Used to log performance characteristics of user actions. |
|
Debug |
Used for debug logging. At this level, more logging occurs than at the other levels. Debug information that can help in application debugging is provided at this level. This must only be used for debugging purposes, as the number of logs generated may cause performance issues. When a customer wishes to report a defect, customer support can advise the customer to turn on logging at this level, run the problem scenario, capture the logs, and attach them to the trouble report. |
|
Verbose |
Used for very detailed logging. At this level, more logging occurs than at the debug level. Fine-grained information that can help in application debugging is provided at this level.This must be used only for debugging purposes, as the number of logs generated may cause performance issues. When a customer wishes to report a defect, customer support can advise the customer to turn on logging at this level, run the problem scenario, capture the logs, and attach them to the trouble report. |
|
All |
Used to turn on all the logging. |
Enable Latency Logging
Use the toggle button to enable or disable latency logging. Once enabled, the network latency from the user browser to the application is measured and logged at defined intervals. This can help the customer administrator to work with Oracle support on any network latency-related performance issues.
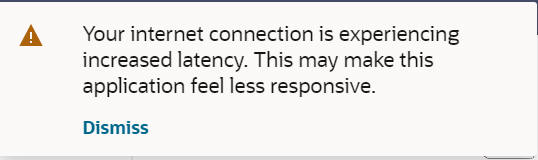
Enable Latency Measurement
Use the toggle button to enable or disable latency measurement. Latency measurements depends on Latency Logging and so that must also be enabled, along with latency measurements.
Once this is enabled, users will see the following warning when their network latency exceeds certain thresholds.
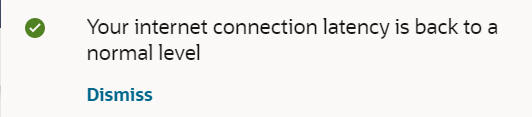
They will see the following information once their network latency returns to normal.
Enable Performance Measurement
Use the toggle button to enable or disable performance measurement. Once this is enabled, the performance timing icon appears on the left task menu (after the user logs in again). The performance values for the current user can be exported or displayed using appropriate sub-menu links.
Logging Level
You can edit the log4jconfig.xml file. This file is mainly used to change the logging level of the application as needed.
|
Note: It is advised to only change the logging level attributes in the loggers tag and not change any other parameters. |
You can update the following:
Format
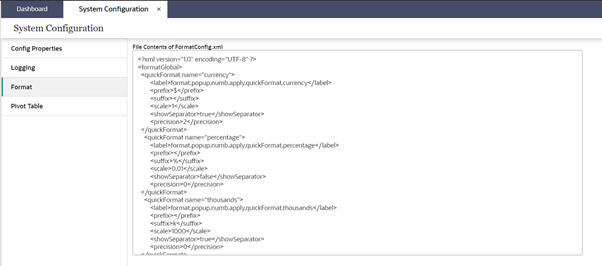
Use this tab, shown in Figure 16-16, to change the FormatConfig.xml file, which controls the formatting properties for the application (that is, currency, percentage, and millions separator).
To save your changes, click Save or Save & Close.
|
Note: To apply the saved changes, you must re-log into the application. |
Figure 16-16 File Contents of FormatConfig.xml
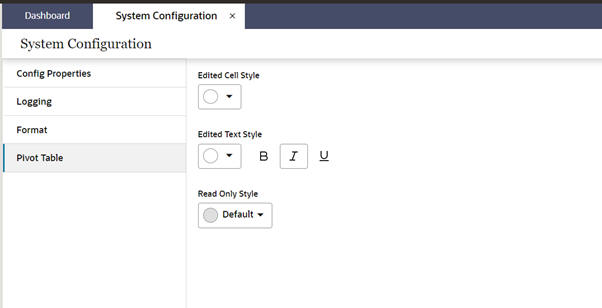
Pivot Table
Use this tab, shown in Figure 16-17, to change the format style of edited uncalculated cells. You can update the color of the edited cell background, edited cell text color, and style.
Note the following:
The system configuration can be edited only by one admin user at a time. If a second admin user tries to edit the configuration, the following message is displayed: "Configuration is currently being edited by <username>".
You cannot navigate to another tab if an error occurs on the current tab.
You cannot submit the page if errors occur until those errors are resolved.
The property not exposed through the Self-Service system will go through the regular service request process.
For more details about property files, refer to the sections of this chapter.