| Oracle® Retail Predictive Application Server Cloud Edition Administration Guide Release 22.2.401.0 F72005-01 |
|

 Previous |
 Next |
| Oracle® Retail Predictive Application Server Cloud Edition Administration Guide Release 22.2.401.0 F72005-01 |
|
Previous |
Next |
This chapter describes the RPASCE Performance Diagnostic Tool. It contains the following sections:
The Performance Diagnostic Tool is a set of administrative reports that an application administrator or system integrator can use to monitor, identify, and review any RPASCE performance issues. In this way, the system administrator or system integrator has access to the information necessary to take action. The Performance Diagnostic Tool Template is accessed in the System Administration Tasks tab and is available to administration users. It provides details about potential performance trouble areas, focusing on common workbook and batch operations, including workbook open, commit, and calculations. The data can be viewed at aggregate levels or down at the user level, if an administrator must work with a specific end user who has expressed concerns regarding RPASCE system performance. Based on the information provided in the Performance Diagnostic Tool, the administration user has a clearer understanding of where the issue is, which can help the user address the issue.
The Performance Diagnostic Tool monitors and analyzes operational performance data.
Operational performance data includes elapsed time for various workbook operations. Workbook operations include Workbook Build, Open, Refresh, Commit, Custom Menu, and Calc. For Workbook Build, Refresh, Commit, and Custom Menu, elapsed time is also collected for each expression.
RPASCE collects operational performance data in real time with minimal impact. The collection of operational performance data is built into the RPASCE core and does not need to be turned on or off. Data collection is available.
Since these performance files are text files without outside dependency, to preserve disk space, it is recommended that batch jobs be set up on the server to remove files older than a pre-defined number of days, such as 15 days. The system only retains the performance data for the last 15 days to preserve disk space. However, if any performance issues are observed for a particular period of time, it is recommended that the relevant performance data be preserved for analysis.
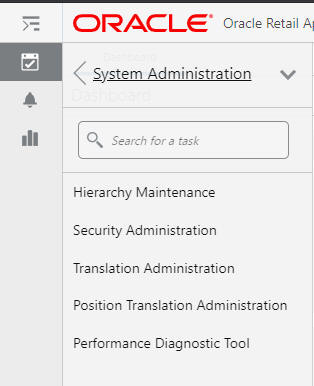
The Performance Diagnostic Tool is available to administration users as a workbook template, located in the template group System Administration, available from the task flow menu under Administration. To access the template, the user must log in as an administration user, go to the System Administration Task Flow, and select the Performance Diagnostic Tool, shown in Figure 15-1.
Figure 15-1 Select Performance Diagnostic Tool
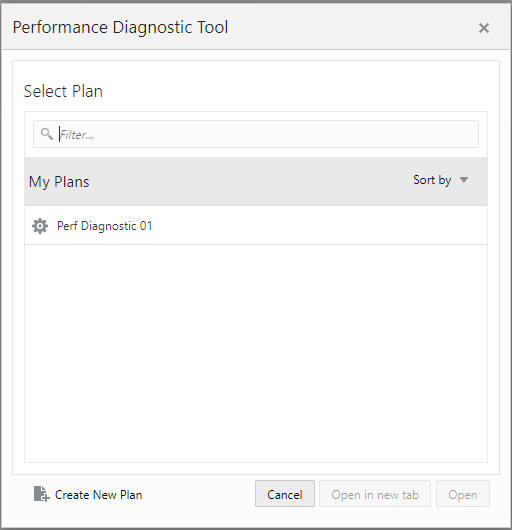
The Segment dialog box, which shows all previously defined segments, is displayed, as shown in Figure 15-2. This is used to select a predefined segment in order to modify it or copy it.
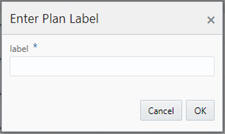
To define a new segment, select Create New Plan.The Enter Plan Label dialog box is displayed. Enter a label and click OK.
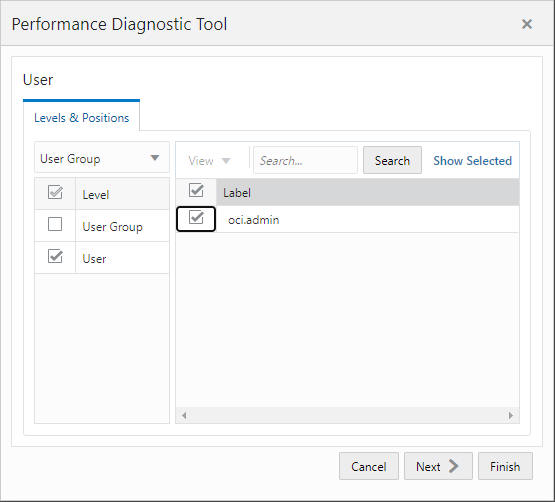
Then, select users from the list of users in the Levels and Positions tab shown in Figure 15-4. The contents of this list depend on whether or not performance data exists for this user. The administration user must pick at least one user to examine the performance data.
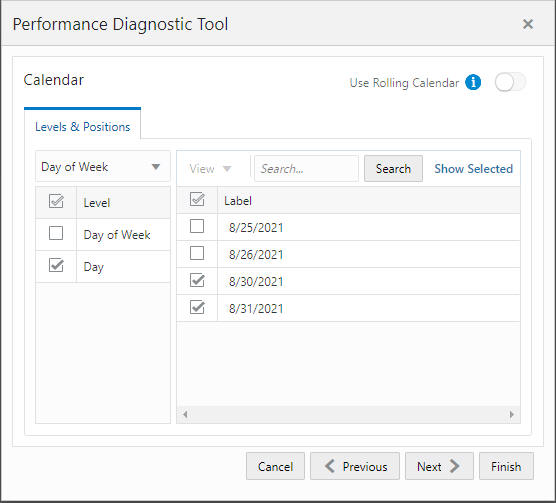
Select the calendar range, as shown in Figure 15-5. The calendar range is defined at the lowest calendar level in the PDS, usually the day level. The days are arranged by the availability of performance data for the previously selected user.
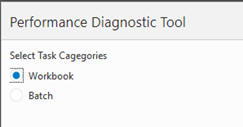
Select either Workbook or Batch, as shown in Figure 15-6.
The segment, once fully specified, is submitted to the RPASCE Task Daemon to build the workbook. The status of the workbook build can be tracked using the Task Status Dashboard or the Notification tab. When the workbook is being built, the performance data is loaded using a set of RPASCE rules that create the customized hierarchies for examining the performance data and the actual performance measure that holds the performance data. Once the workbook is successfully built, it can be opened via the Notification tab or from the segment window. Once the workbook is open, the user can see All Operations, as shown in Figure 15-7.
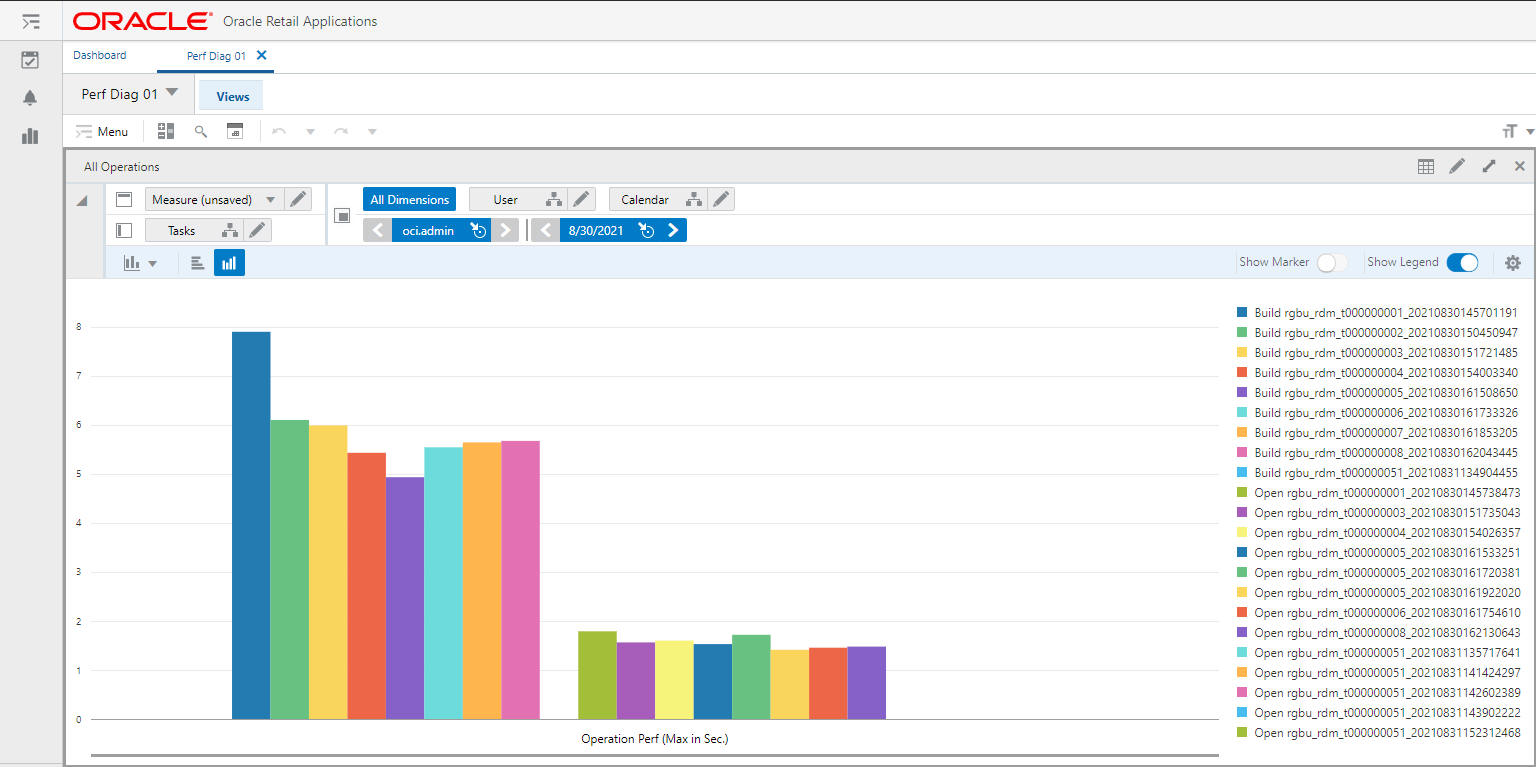
Figure 15-7 All Operations High Level View
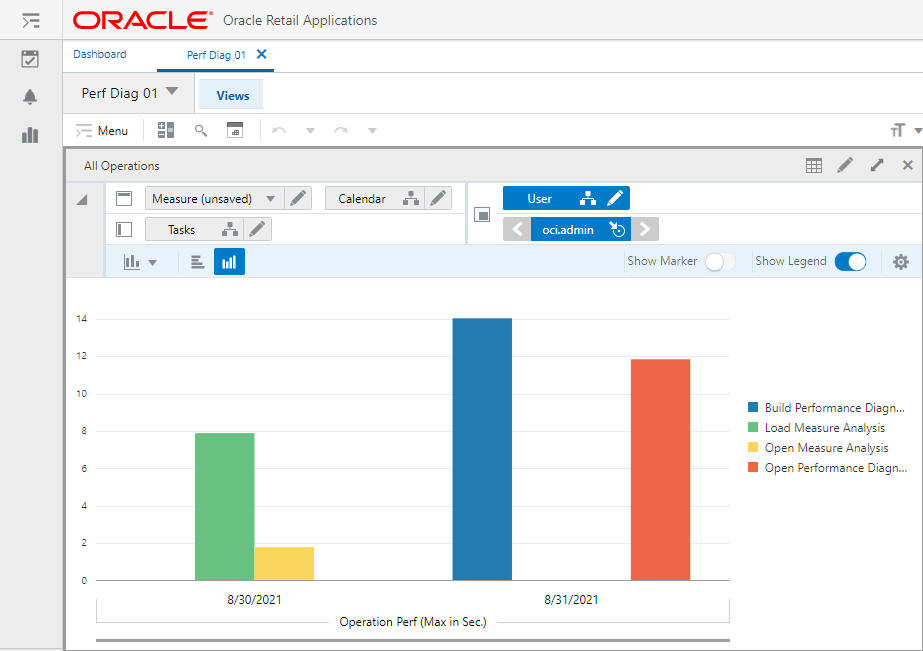
This view displays the Maximum Running Time, in seconds, for different types of Workspace operations such as Build, Open, Refresh, and Commit, along with the calendar dimension. This window is best presented if viewed in a bar chart. The maximum running time is shown at the aggregated level. For example, the maximum build time for a particular day is the maximum build time for all the workbooks that the specific user built on that day. Using this view, administration users can identify the type of workbook operations that require the longest time and how that time changes from day to day.
Since the data is presented at a high level in this view, the administration user can use this as a starting point for an investigation to identify which workbook build is actually taking the most time. For more detailed information, the administration user can drill down to a specific day/user combination, as shown in Figure 15-8.
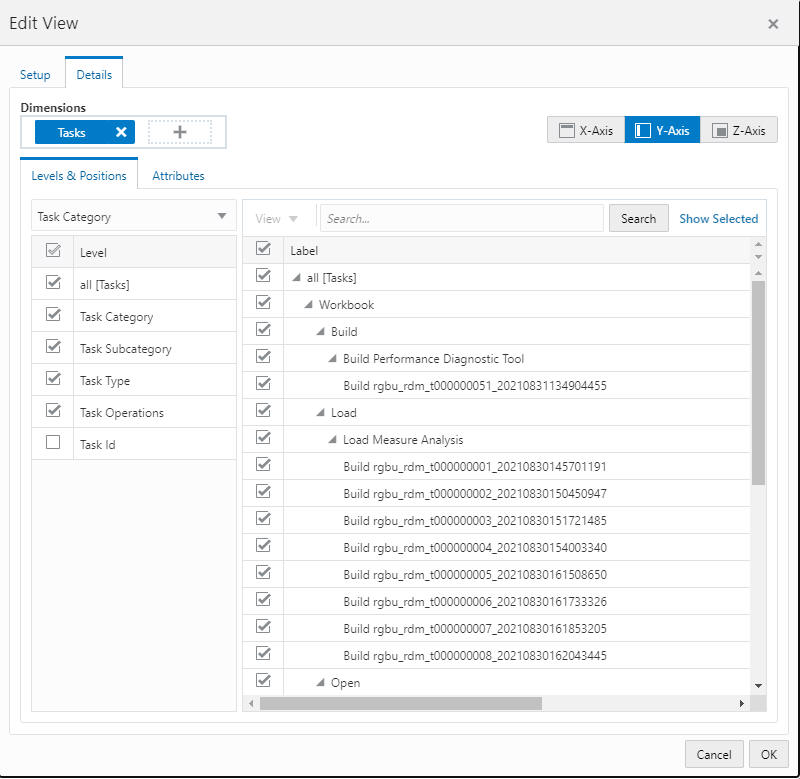
The Tasks hierarchy is built on demand when the workbook is created, using the data in the performance log files. The user can arrange the Tasks hierarchy to drill down to operations belonging to a specific workbook template or to a specific workbook. The user can arrange and manipulate the Tasks hierarchy using the Tasks tab, via the Tasks Hierarchy dialog box shown in Figure 15-9.
The Task hierarchy is made up of five levels.
The lowest level is Task ID, which is used by the Expression level view. Each Task ID represents an individual expression evaluation. Currently, expression runs in PDS are not logged. Task ID aggregates to the Task Operation level, which maps to each specific workbook operation, such as Build Operation for workbook pcgd_t00003.
The Task Operations level is the level shown in the All Operations view. Task Operations aggregates to the Task Type level, which maps to a specific workbook operation type/template name combination (for example, Build Operation for Measure Analysis template).
The Task Type level aggregates to the Task Subcategory level, which is the level shown in the All Operations - High Level view.
The Task subcategory maps to each of the workbook operations, such as Build, Calc, Custom Menu, Commit, and Refresh.
The top level of the Task Hierarchy is the Task Category, which has only two positions: Workbook and Batch. Currently, only Workbook can be used for the Performance Diagnostic workbook. The level names in the Task Hierarchy are generic, such as Categories, IDs, or Types, because the hierarchy definition is shared between the Workbook and Batch operations.