| Oracle® Retail Size Profile Optimization User Guide for the RPAS Fusion Client Release 14.1 E56467-01 |
|

 Previous |
 Next |
| Oracle® Retail Size Profile Optimization User Guide for the RPAS Fusion Client Release 14.1 E56467-01 |
|
Previous |
Next |
The Administration workbook is used to set parameter values, define alert thresholds, define the escalation path, and manage the Generation ID.
The Administration task contains the following steps:
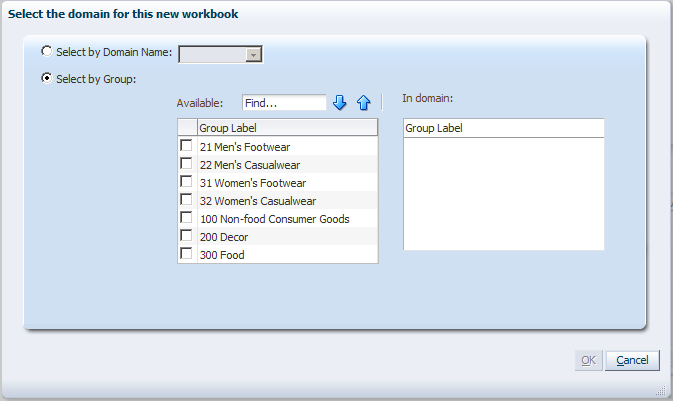
When creating a new workbook, you may be prompted to select the domain:
Based on the configuration of the workbook template, you can select positions for the workbook. The workbook is created in the master or local domain depending on what you select in the menu.
When you select a position, all the other positions in the same domain are shown on the right. Since choosing the domain is the goal, that may be enough. If you select a position that crosses domains, it will select the master if that is permitted by the task and template.
To select the master domain or a specific domain, select Select by Domain Name. Select the master domain or a local domain from the menu. See Figure 2-1.
|
Note: This dialog does not appear if you only have position level security access to one of the domains, or the task or template restricts it to master. |
To build the Administration workbook, perform the following steps:
Click the Create New Workbook icon in the Administration task.
You may be prompted to select a domain if you have access to more than one domain. For information on domain selection, see "Selecting the Domain when Creating a New Workbook".
The workbook wizard opens at the Select Sub Size Range screen. Select the desired size range and click Finish.
The Administration workbook is built.
|
Note: The size range selections apply only to the specification of kink exception thresholds in the Alert Thresholds. |
The following sections describe the steps available in the Setup step:
This view is used to trigger the generation (or re-generation) of size profiles associated with each generation ID.
The following table describes the measures available in the Manage Batch Run view:
Table 2-1 Manage Batch Run View Measures
| Measure | Description |
|---|---|
|
Generation ID Label |
A user-specified descriptive label for the profile generation ID. |
|
Generation ID Timestamp |
This is updated upon successful completion of the SPO batch. It indicates the timestamp of the previous SPO run associated with the generation ID. |
|
Empty Generation ID |
This indicates to the SPO batch that it is empty, and reuse the generation ID. |
The Basic Setup view is used to specify the basic parameters for this size profile run.
The following table describes the measures available on the Basic Setup view.
Table 2-2 Basic Setup View Measures
| Measure | Description |
|---|---|
|
Default History Start Date |
Indicates the first date in history that is used for computing this size profile run. |
|
Default History End Date |
Indicates the last date in history that is used for computing this size profile run. |
|
Profile Gen Method |
Specifies the profile generation method to use for computing size profiles. Options are: Optimized Size Profiles and Normalized Size Profiles. Normalized generation method considers the values within the valid threshold (treat the others as invalid) and create a profile based on these values. Normalized size profiles are basically the normalized ratio of pre-processes historic sales. Optimized generation method tries to insert estimated values for the invalid values and uses that for generating the profile. Optimized size profile is the MLE approach in the SPO insight. |
|
Batch Execution Flag |
This indicates the SPO batch needs to be executed. The SPO batch, when invoked, checks if this flag is true and only then continues processing. |
|
Skip Post Processing Flag |
If this flag is checked, the post-processing step in SPO batch is skipped. |
|
Archive Previous Run |
When this is selected, it would archive the results from the previous size profile run. |
The Set Default Season Start/End Date view is used to set different start and end dates for the season for each of the size ranges that are being optimized.
The following table describes the measures available on the Set Default Season Start/End Date view:
Table 2-3 Season Start/End Date View Measures
| Measures | Description |
|---|---|
|
Default Season Start Date |
Used for fashion items, this date indicates the season start date. It is used for preprocessing. |
|
Default Season End Date |
Used for fashion items, this date indicates the season end date. It is used for preprocessing. |
Escalation levels are the intersections at which size profiles can be generated. An escalation path is an ordered subset of escalation levels.
The following section describes the views available in the Escalation Path Management step:
The view displays the escalation level order, and allows you to enable/disable escalation levels for this run of the SPO batch.
If SPO is unable to obtain a valid size profile for a style-color/store, it tries to escalate to a higher level where a reliable profile may exist.Escalation starts with level one, and goes through to all of the higher levels that are enabled. The standard escalation levels are defined as an administration task and may be modified or extended.
|
Note: For more information on administering the plug-in, refer to the Oracle Retail Size Profile Optimization Implementation Guide. |
The following table describes the measures available on the Escalation Path Management view:
Table 2-4 Escalation Path Management View Measures
| Measure | Description |
|---|---|
|
Enable/Disable Escalation Levels |
When this check box is selected, it enables the escalation levels. When you de-select this check box, it disables escalation levels. |
|
Escalation Level Intersection Label |
The label associated with each escalation level. Note that this measure is also an attribute measure, which can be used throughout the SPO solution as a display attribute. |
|
Escalation Level Order |
Indicates the order of escalation path traversal. See the "Size Profile Optimization Concepts" section for more details on escalation paths. |
As per standard configuration, there are ten levels. Number of escalation levels may be increased using the plug-in provided with the SPO product. For more information on the new plug-in, refer to the SPO Implementation Guide.
Use this view to override the default escalation path that was displayed in the Escalation Path Management view. In this view specify the escalation path overrides at the escalation path override level.
The Alert Thresholds step allows users to review and modify any thresholds for alerts in the SPO batch runs.
The following section describes the steps available in the Alert Thresholds step:
This view allows users to review and modify alert thresholds for preprocessing alerts.
The following table describes the measures available on the Preprocessing Alert Threshold view:
Table 2-6 Preprocessing Alert Threshold View Measures
| Measure | Description |
|---|---|
|
Preprocessing Alert Eligible Sales Units vs Original Sales Units Threshold |
The threshold used by the Preprocessing Alert. This alert compares the original unfiltered sales to the filtered sales. If the ratio of the total filtered sales for the SKU/store to the total original unfiltered sales exceeds this threshold, then this implies the system has preprocessed too many sales and the alert parameter is set to true. |
This view allows the user to override the thresholds for the inner and outer ratios for Kink. This may be defined separately for each of the size ranges in the view.
The following table describes the measures available on this view:
Table 2-7 Preprocessing Alert Threshold View Measures
| Measure | Description |
|---|---|
|
Kink Inner Ratio |
The threshold for the inner ratio. If the inner and outer ratios of a size exceed the kink inner and kink outer ratios specified, the system will consider the size a kink. See Kink Ratio View for a definition of the inner ratio and other information. |
|
Kink Outer Ratio |
The threshold for the outer ratio. If the inner and outer ratios of a size exceed the kink inner and kink outer ratios specified, the system will consider the size a kink. See Kink Ratio View for a definition of the outer ratio and other information. |
The following section describes the different steps available in the Advanced step:
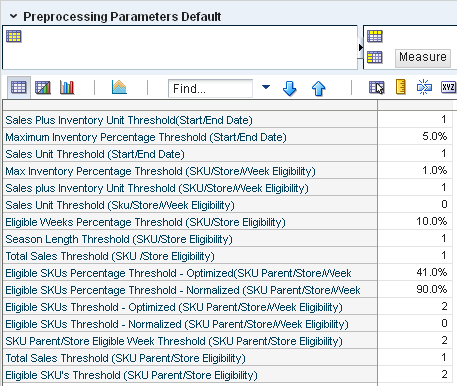
This view displays the default parameters defined for preprocessing. This applies across all items and may be edited here. Editing these parameters impacts the size profile runs requested in this view.
The following table describes the measures available on this view.
Table 2-8 Preprocessing Parameters Default View Measures
| Measure | Description |
|---|---|
|
Sales Plus Inventory Unit Threshold (Start/End Date) |
The first and last date of history where sales plus inventory units exceed this threshold. This measure is used in the season length calculation. |
|
Maximum Inventory Percentage Threshold (Start/End Date) |
The first and last date of history where ratio of sales plus inventory to maximum inventory for the SKU/Store exceed this threshold are used in the Season length calculation. |
|
Sales Unit Threshold (Start/End Date) |
The first and last date of history where sales units exceed this threshold. This measure is used in the season length calculation. |
|
Max Inventory Percentage Threshold (SKU/Store/Week Eligibility) |
The SKU/store/week is considered eligible only if its inventory expressed as a percentage of the maximum inventory for the SKU/store is greater than the max inventory percentage threshold specified. |
|
Sales Plus Inventory Unit Threshold (Sku/Store/Week Eligibility) |
The SKU/store/week is considered eligible for size profile generation only if, the value of the sum of sales and inventory of a given week, for that SKU/store need to exceed this Sales plus Inventory Unit Threshold value. |
|
Sales Unit Threshold (Sku/Store/Week Eligibility) |
The SKU/store/week is considered eligible for size profile generation only if, the sales units for a given week, for that SKU/store need to exceed this sales unit threshold value. |
|
Eligible Weeks Percentage Threshold (SKU/Store Eligibility) |
The minimum ratio of eligible weeks to season length needed for the SKU/Store to be considered eligible. |
|
Season Length Threshold (SKU/Store Eligibility) |
A SKU/store is considered eligible if its season length calculated is above this threshold. |
|
Total Sales Threshold (SKU/Store Eligibility) |
If the total sales for a SKU/store exceed this threshold, then it is considered eligible. |
|
Eligible SKU Percentage Threshold - Optimized (SKU Parent/Store/Week Eligibility) |
If the total number of eligible SKUs for a given SKU parent/store/week expressed as a percentage of total SKUs exceeds the threshold, then the SKU parent/store/week is considered eligible. This is for the optimized generation method. |
|
Eligible SKU Percentage Threshold - Normalized (SKU Parent/Store/Week Eligibility) |
If the total number of eligible SKUs for a given SKU parent/store/week expressed as a percentage of total SKUs exceeds the threshold, then the SKU parent/store/week is considered eligible. This is for the normalized generation method. |
|
Eligible SKUs Threshold - Optimized (SKU Parent/Store Eligibility) |
If the number of eligible SKUs for a given SKU parent/store exceeds this threshold, the SKU parent/store is considered eligible. This is for the optimized generation method. |
|
Eligible SKUs Threshold Normalized (SKU Parent/Store Eligibility) |
If the number of eligible SKUs for a given SKU parent/store exceeds this threshold, the SKU parent/store is considered eligible. This is for the normalized generation method. |
|
SKU Parent/Store Eligible Week Threshold (SKU Parent/Store Eligibility) |
SKU parent/store eligible weeks threshold, used in SKU parent/store eligible calculation. Minimum number of weeks required for the SKU Parent / Store to be considered eligible. |
|
Total Sales Threshold (SKU Parent/Store Eligibility) |
Used in the SKU parent/store eligibility check. If the total sales for a SKU parent/store exceed this threshold, then it is considered eligible. |
|
Eligible SKUs Threshold (SKU Parent/Store Eligibility) |
If the number of eligible SKUs for a given SKU parent/store is above this threshold, it is considered eligible. |
The Profile Generation Parameters view allows users to review and modify parameters used to calculate profiles at various escalation levels based on the escalation level's intersection.
The following table describes the measures available on this view.
Table 2-9 Profile Generation Parameters View Measures
| Measure | Description |
|---|---|
|
Max Iteration Profile Optimization |
This is used by the Optimized Size Profile method. This measure indicates the maximum number of iterations after which the algorithm will stop and return size profile from the last iteration. |
|
Angle Threshold |
This is used by the Optimized Size Profile method. The method calculates size profiles iteratively, and calculates the angle between the size profile from a given iteration to the size profile from the previous iteration. If the angle falls within the specified threshold, the system returns the latest value of the size profiles. No further iteration happens beyond this. |
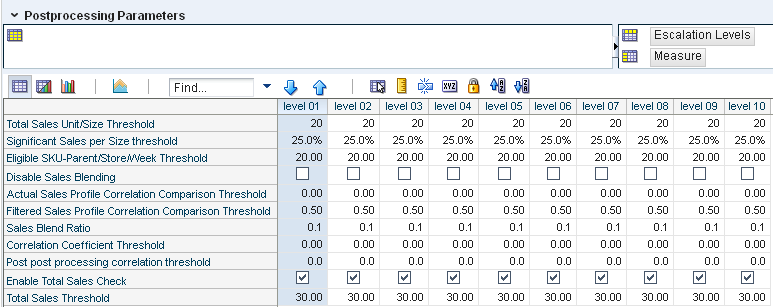
Postprocessing is performed to check size profiles for accuracy and reject or prune size profiles if they do not meet accuracy criteria. The Postprocessing Parameters view allows users to review and modify post processing parameters that drive the criteria for size profile accuracy.
SPO primarily performs the following types of postprocessing:
Blending or comparison to sales size profiles
Comparison to chain size profiles
Significant sizes check
Total sales check
Contributing number of SKU parent/store/weeks check
In addition, the system also looks for kinks in size profiles. This functionality is described in the "Kinks and Kink Exceptions" and in the "Size Range Management" chapters.
The following table describes the measures available on this view:
Table 2-10 Postprocessing Parameters View Measures
| Measure | Description |
|---|---|
|
Total Sales Unit/Size Threshold |
Total sales units per size for the size to be considered significant. Significant sizes are used to determine if a size profile is reliable; for example, if a size profile does not have sufficiently significant sizes, it is rejected by the system. |
|
Significant Sales per Size Threshold |
If the percentage of significant sales per size for a given size profile falls below the threshold defined by this measure, the size profile is rejected. The size is considered significant if the total sales units value for the size exceeds the value in the Total Sales Unit/Size Threshold. |
|
Eligible SKU-Parent/Store/Week Threshold |
If the number of contributing SKU parent/store/week combinations used for calculating a size profile is below this threshold, the size profile is pruned or rejected. |
|
Disable Sales Blending |
When sales blending is turned off and system compares calculated size profiles against normalized actual unfiltered historic sales and rejects size profiles if significantly different. |
|
Actual Sales Profile Correlation Comparison Threshold |
If correlation of calculated size profile to normalized unfiltered sales is less than this threshold, system will automatically prune the size profile. |
|
Filtered Sales Profile Correlation Comparison Threshold |
If correlation of calculated size profile to normalized filtered sales is less than this threshold, system will automatically prune the size profile. |
|
Sales Blend Ratio |
Used only when Disable Sales Blending is False, this indicates the ratio of unfiltered sales profile (based on actual unfiltered history) to use in the blending process to generate final size profiles. |
|
Correlation Coefficient Threshold |
Indicates the minimum correlation coefficient between raw profile and chain level profile. This is used in postprocessing to identify situations where the size profiles do not look in any way similar to the corresponding chain level aggregate size profiles. This check can effectively be disabled by specifying a very low threshold. Correlation coefficient is an indication of the degree to which two variables (in this case a calculated size profile for a given level and its corresponding chain level size profile) are linearly related. A correlation coefficient of 1 indicates there is a perfect relationship between the two variables, meaning that whenever one variable has a high (low) value, so does the other. A correlation coefficient of -1 indicates there is a negative relationship, meaning that whenever one variable has a high (low) value, the other has a low (high) value. A correlation coefficient of 0 means that there is no linear relationship between the variables. Correlation coefficient is calculated as: 
Where:
|
|
Post postprocessing Correlation Threshold |
Indicates the minimum correlation coefficient between a raw profile and a reference profile. The reference profile can be specified during implementation phase. For instance, the user could specify last year's sales profile or a previously approved size profile. This is used in postprocessing to identify situations where a computed size profile is highly correlated to the reference profile. If the computed size profile does not meet the minimum correlation, it is not filtered out, irrespective of its postprocessing. |
|
Enable Total Sales Check |
Enable this check to see if the total eligible sales that were used for calculating the size profile are below a certain threshold. If the total contributing sales is below this threshold, the size profile is pruned or rejected. The threshold is specified in the Total Sales Check Threshold measure. |
|
Total Sales Threshold |
This is used when the Enable Total Sales check flag is set to True. If the total contributing sales is below this threshold, the size profile is pruned or rejected. |
|
Enable Compare to Sales Profile Check |
This flag enables the Compare to Sales Profile check and automatically disables blending functionality. Note that the Compare to Sales Profile check and Blending are two mutually exclusive postprocessing concepts. Profiles against normalized actual unfiltered historic sales: If the ratio of the calculated size profile to corresponding normalized sales (for a given size) exceeds the normalized multiple threshold specified, the system will automatically prune the size profile. |
|
Sales Profile Comparison Threshold |
This is used when the Compare to Sales Profile check flag is set to True. If the ratio of the calculated size profile to corresponding normalized unfiltered sales (for a given size) exceeds the Sales Profile Comparison threshold specified, the system will automatically prune the size profile. |