| Oracle® Retail Demand Forecasting Cloud Service Implementation Guide Release 19.0 for Windows F24923-16 |
|

 Previous |
 Next |
| Oracle® Retail Demand Forecasting Cloud Service Implementation Guide Release 19.0 for Windows F24923-16 |
|
Previous |
Next |
RDF is a statistical forecasting solution that uses state-of-the-art modeling techniques to produce high quality forecasts with minimal human intervention.
RDF supports pre-processing, new item/store processing and forecast generation. To obtain good forecast results, the above features need to be configured to work together. RDF is highly configurable and extremely flexible. To streamline RDF implementation and shorten implementation time, several plug-ins are provided to work together with RPAS Configuration Tools. These plug-ins let users input configuration options through the GUI and automatically generate configuration solutions based on the RDF GA master template and user inputs. The configuration solutions generated by the plug-ins are PrepDemand, New Item and RDF. Since Promotions are integral to forecasting, it is part of the RDF solution. The plug-ins auto-generate the hierarchies, measures, rules, workbook templates, taskflow and the Dashboard configuration file that are required by RDF to support the forecasting configuration entered in through the plug-in interface:
Table 3-1 Autogenerated Items from Plug-ins
| Autogenerated Entity | Description |
|---|---|
|
Hierarchies |
The internal hierarchies required by the solution will be generated by the plug-in. Labeled Intersections are autogenerated. |
|
Measures |
All measures necessary to support the base solution will be created. |
|
Rules |
All Rule Sets, Rule Groups, and Rules to support the base solution will be created. |
|
Workbook Templates |
All pre-defined workbook templates to support the base solution will be created. |
|
Taskflow |
The taskflow will be auto generated based on the RDF template and the levels entered in the plug-in. |
|
Dashboard Configuration file |
The Dashboard configuration file is auto generated based on the dashboard levels and custom exceptions enter using the plug-in. |
|
Batch Control file |
The Batch Control file is auto generated. |
Understanding the RDF batch flow process is important before starting RDF Configuration:
RDF has two major batch process:
This batch process is suggested to run monthly or quarterly to generate seasonality curve and promotional effects.
This batch process involves the following steps:
Running Preprocess Batch
Running RDF Estimation
It is recommended to run this batch process weekly in order to generate the base demand, update promotion effects and combine base demand, promotional effects and the seasonality curve to produce a forecast.
|
Note: RDF provides a mechanism to extend the GA batch process. Refer to Customizing the RDF Batch Process. |
This batch process include the following steps:
Load Weekly Data
Running Preprocessing Batch
Running New Item Batch
Generate System Forecast
Adjust System Forecast
Approve Adjusted Forecast and System Forecast.
Forecasts can be approved in three ways:
Manual - Nothing is approved in the batch process and you must go to the forecast review workbook to approve forecasts.
Automatic - All forecasts are approved by the system. RDF has defined several GA approval alerts that are available for the approval process.
Approval by Alert - Approves forecasts based the user specified approve alert. With no alert hit, the forecast is approved. With an alert hit, the forecast is not approved,
Implementors can also define MyException alerts through the RDF plug-in to create additional approval alerts. These alerts are produced before approval.
|
Note: There is something tricky here for approval process. If an item/store is approved through either Automatic or Approve by Alerts, then the item/store's alert hit are cleared in all approval alerts including both GA approval alerts and MyException alerts.That way, when building the Dashboard workbook and the Forecast Review workbook, only the unapproved items still have alerts. |
Export Forecast
|
Note: It is recommended to export the forecast as close to the receiving / replenishment system needing the forecast, so as to reflect the current state of the RDF application. |
Build the Dashboard Workbook
The RDF GA configuration can be used out of the box to build the RDF domain. The GA configuration has RDF's point of view on the number of final levels, promotions and preprocessing paths.
RDF implementers can modify the RDF GA configuration to meet the retailer's business needs. RDF supports two means to achieve this:
Configuring the solutions using the plug-ins
Extensibility of the configuration
This chapter explains how to configure the various solutions using the plug-ins. Extensibility of the configuration is described in Chapter 4, "RDF Cloud Service Extensibility". Although there is a separate plug-in for New Item, Preprocessing and RDF solutions, from the Config Tools UI, we only see two plug-in dialogs – Forecast Common and RDF. This simplifies the configuration process for the implementer.
The RDF GA configuration is RDF's point of view and it is highly recommended to have:
Two pre-processing paths – one for baseline data source and another for causal data source
Not more than one Short Lifecycle final level
Ten escalation levels or less should be able to cover all business cases
One Long Lifecycle final level
Ten escalation levels or less should be able to cover all business cases
Five pooling escalation levels or less should be able to cover all business cases
Group events into ten promotions or less. By doing this, it is enough promotions to provide granularity yet few enough to provide robustness. Short Lifecycle must have only Boolean promotions. For Long Lifecycle, the price discount must be modeled as exponential
Five approval alerts or less. More than five is unwieldy for the user.
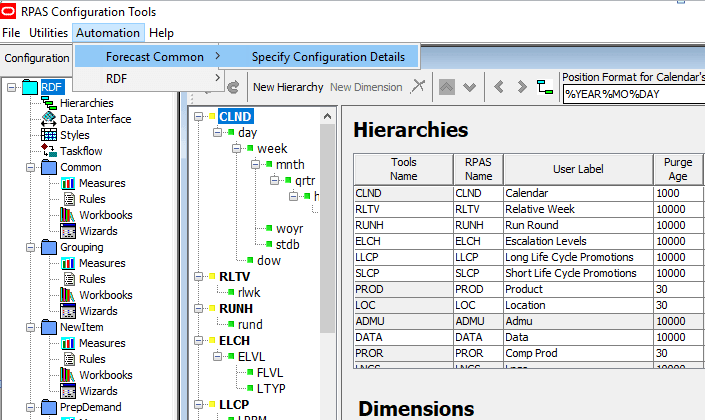
From the Configuration Tools toolbar, select the Automation menu and then from the Forecast Common option, select Specify Configuration Details.
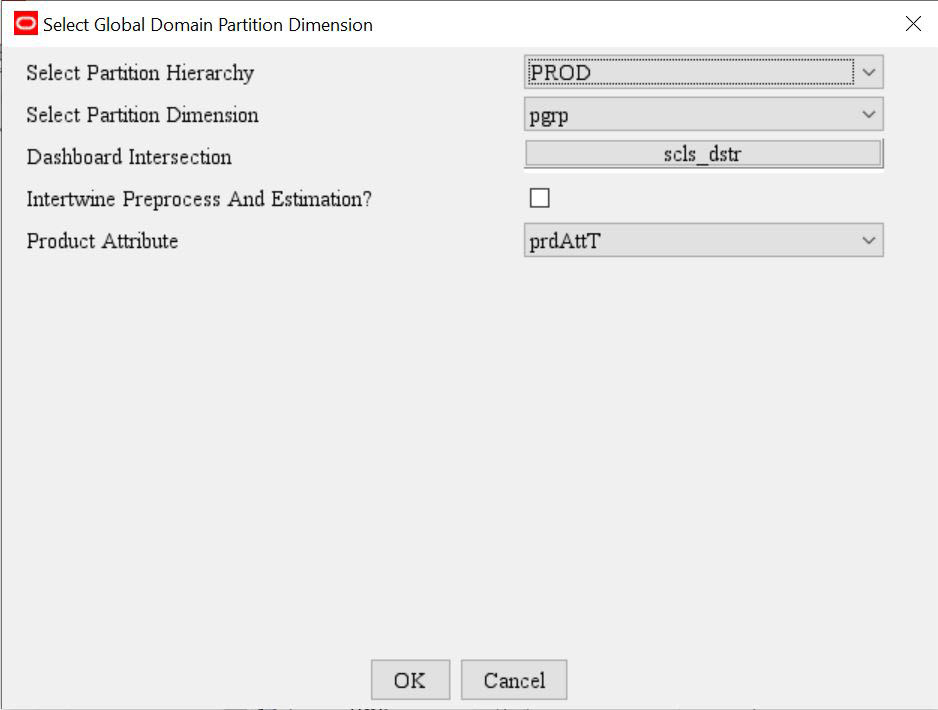
RDF only supports global domain configuration. So in this step we specify the partition dimension and hierarchy.
Dashboard Intersection is the level at which the information has to be displayed in the dashboard.
The Intertwine Preprocess and Estimation? check box allows implementors to indicate if they would like the Preprocess step and Estimation step to be intertwined in estimation batch. This check box should only be switched on when DePromote was selected as a Preprocess method to remove Promotion Effects from original sales. When the check box is turned on, different batch flow logic is followed and different custom hook are provided for batch control files. Implementors need to update the custom batch control files if they would like to check the box and patch the domain. It is recommended to turn this on only for new installation.
The product attribute measure to be used in the RDF and New Item solutions has to be specified in the Common Plug-in. The product attribute measure stores the attribute position name and not the attribute label.
|
Note: The partition dimension must be specified on the PROD hierarchy. The plug-in validation will ensure this. |
The labeled intersections listed in Table 3-2 must be defined before running the RDF plug-ins. The plug-in validation will ensure that the required labeled intersections are defined.
Table 3-2 Labeled Intersections
| Labeled Intersection | Definition | Description | Measures Defined |
|---|---|---|---|
|
SLS_INTX |
sku/stor/week |
Sales intersection |
pos, rsal, psal, csal, osal |
|
DAYSLS_INTX |
sku/stor/day |
Sales intersection at day (load intersection) |
Can be used as load intersection for sales coming in at day level |
|
PRESLS_INTX |
sku/stor/week |
Preprocess Sales input/output |
llcdata, totadjbasesls, totaladjcalsls |
|
SLSNC_INTX |
sku/stor |
Sales intersection without calendar |
ldactivefcstitem, flagllc |
|
PRESLSNC_INTX |
sku/stor/week |
Preprocess sales input intersection without calendar |
Used by Preprocess indicator measures and parameter measures |
|
PRESLSPROF_INTX |
sku/stor/woyr |
Seasonal profile intersection |
Used by measure to deseasonalize sales during preprocessing |
Labeled intersections listed in Table 3-2 can be defined based on the retailers business needs. SLS_INTX is the labeled intersection for the incoming sales measures (pos,rsal,psal,csal, osal). PRESLS_INTX is the labeled intersection for the Preprocessing input, output and indicator measures. All the preprocessing indicator measures should match the intersection of the preprocessing input and output measures.
Consider the following two use cases:
The RDF final level forecast is at sku/chnl/week and the input sales data has to be preprocessed at sku/chnl/week. In this case the PRESLS_INTX can be modified to be at sku/chnl/week. (This would avoid creating any custom measures to match the RDF data source intersection with the preprocessed output measure intersection.)
The RDF final level forecast is at sku/chnl/week and the input sales has to be preprocessed at sku/stor/week. In this case the PRESLS_INTX can remain at sku/stor/week and all the preprocessing takes place at this level. However we would need a custom measure at sku/chnl/week to serve as RDF data source measure and a custom rule is needed to aggregate from the Preprocessed sales measure (toadjbasesls) to the Custom RDF data source measure.
Open an RDF GA configuration to see the common modules. This solution should not be modified by the implementer and are considered as non-touch solutions. This solution defines input/output measures for the whole RDF project. The content created in this module will not be modified by the plug-ins. The measures created in these modules are external measures for the plug-ins, and they will serve as inputs to plug-ins. Although this module are not generated by plug-in, It will be overridden in RDF Configuration Automation Script. Any modification by the implementer will be ignored.
In RDF GA, the common solution is used to register measures related to sales and product attribute inputs/outputs to:
PrepDemand
New Item
RDF Solutions
|
Note: For the common solution, an implementor can only modify the labeled intersection definition that changes the measure intersection in common. |
The purpose of the PrepDemand solution also referred to as Preprocessing or Data cleansing, is to correct past data points that represent unusual sales values that are not representative of a general demand pattern. Such corrections may be necessary when an item is out-of-stock and cannot be sold, which usually results in low sales. Preprocessing will adjust for stockout for both the current week and the following week because it assumes that the out-of-stock indicators represent end-of-week-stockout. Data Correction may also be necessary in a period when demand is unusually high. The Preprocessing module allows you to automatically make adjustments to the raw POS (Point of Sales) data so that subsequent demand forecasts do not replicate undesired patterns that are caused by lost sales or unusually high demand. Preprocessing can also be used to remove promotion spikes when a promotion indicator is available. Inclusion of a promotion spike can seriously skew the baseline forecasting. It is ideal to remove seasonal effects from sales so that the seasonal pattern does not interfere with the causal estimation, especially when promotion and significant seasonal patterns overlap.
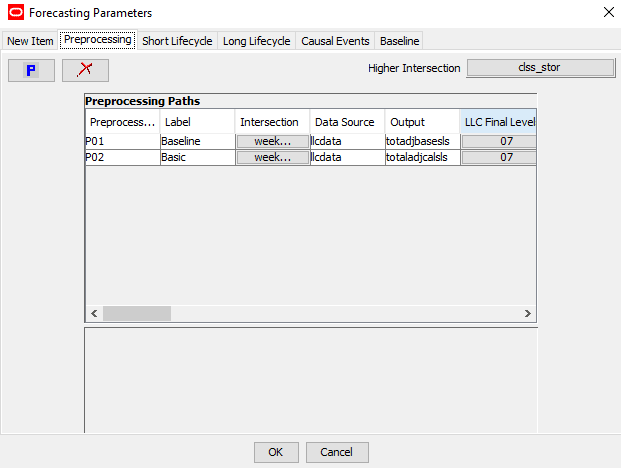
Based on the usage, sales history should be preprocessed in different ways. In RDF GA configuration, two preprocessing paths are configured. Path 01 is used to preprocess sales for baseline forecasting. Path 02 is used to preprocess sales for causal forecasting. For baseline forecasting, the sales history goes through four stages:
Out-of-stock correction
Outlier correction
Promotional spike removal
Smoothing
For causal forecasting, the sales history goes through three stages: out-of-stock correction, outlier correction and seasonal pattern removal. Each stage is called RUN in preprocessing.
Based on the customer's needs, an implementer can decide how many paths to configure, what kinds of runs to include in each path, and what the input and output measures are for each path. Once the information is fed to the PrepDemand plug-in, the PrepDemand solution will be auto-generated with all necessary measures, rules and workbook templates. Each preprocessing path is also associated with the RDF final level that uses the preprocessed output as RDF data source. This also aids in the calculation of the promo indicator and seasonal profile used during the de-promote and de-seasonalize phases of preprocessing.
The New Item module is designed to support the forecast for new item/store. RDF provides three approaches to forecast new item/store:
| Forecast Approach | Description |
|---|---|
| Like Item | The forecast is created based on the forecast of Like Items. The Like Items can be selected manually, and the choices are entered in the User Selected Like Items measure. The task can also be automated if attributes are available. RDF CS then suggests one Like Item in the system recommended Like Item measure.
The forecast for the New Item is given by: Base demand new item = base demand like item * Adjustment Factor The forecast for the New Item is calculated as: Forecast at time t = base demand new item * seasonality at time t (coming from escalation level) * promo and price effects (coming from pooling level) |
| Base Rate of Demand | RDF CS calculates the escalated base rate of demand. The forecast for the new item is given by:
Forecast at time t = base rate of demand (coming from escalation level) * seasonality at time t (coming from escalation level) * promo and price effects (coming from pooling level) |
| User Input | This method is very similar to Base Rate of Demand, with the difference that you have to manually specify a base rate of demand. The forecast is then generated using the same formula as for Base Rate of Demand.
Forecast at time t = base demand new item * seasonality at time t (coming from escalation level) * promo and price effects (coming from pooling level) |
The New Item module provides tools to support the automatic and manual assignment of like item/store to new item/store. If the user can provide product attribute information, the new item can be automatically identified and provided a like item recommendation. If no product attribute information is available, the user has to assign like items manually. New store mapping is always done manually.
Perform the following steps to generate a New Item solution:
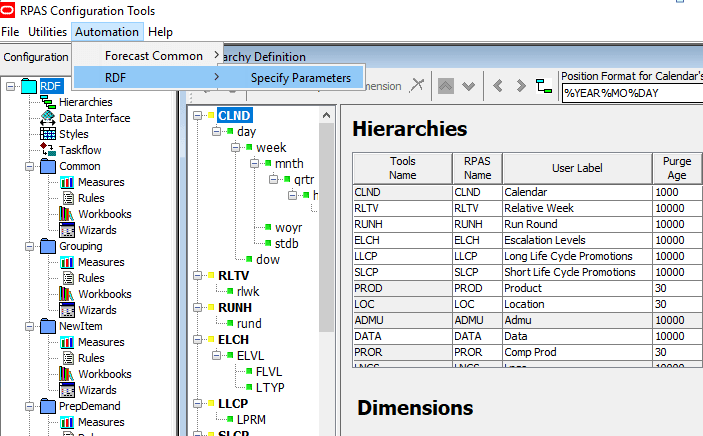
From the Configuration Tools toolbar, select the Automation menu and then, from the RDF option, select Specify Parameters.
From the Like Item Parameters utility, specify the properties for the New Item plug-in. Refer to Editing New Item Parameters for details.
Click OK once editing is finished.
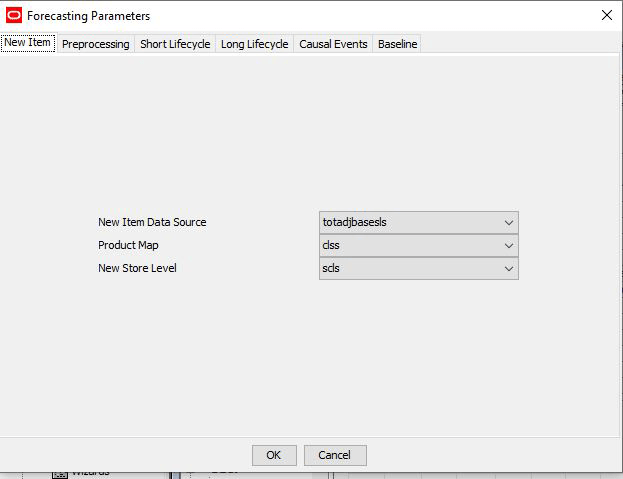
Table 3-3 lists the New Item parameters available for editing. Ensure that the labeled intersections listed in Table 3-4 are present
Table 3-3 New Item Parameters
| Parameter | Description |
|---|---|
|
New Item Data Source |
Sales data used to generate forecast for New item/store. |
|
Product Map |
This field specifies the range of the like item available to a new item. If the field is populated with clss, it means that only existing items under the same class as the new item are available as like item candidate. The Similarity Score calculation should only be performed between the new item and existing items with in the class. |
|
New Store Level |
This field specifies the product level on which like store is assigned to new store. If the field is selected as scls, it means that the like store assignment can be different per subclass. |
The following labeled intersections are used to define measures used by the New Item solution. They need to be created and customized before upgrading.
The following sections describe the configuration process for preprocessing historical demand.
There are several parameters within the PrepDemand solution that may reference other measures that are configured external to the solution. Prior to configuring a PrepDemand solution, it is required that these measures already exist within the project:
| Measure | Description |
|---|---|
| Data Source | The PrepDemand plug-in provides a list of existing numeric measures based on the user-specified intersection for a preprocessing path. An implementer selects the measure that stores the input data for preprocessing. This measure should be configured in the Common module. |
| Output | The PrepDemand plug-in provides a list of existing numeric measures based on the user-specified intersection for a preprocessing path. An implementer selects the measure that stores the output data from the preprocess. This measure is also normally an input to New Item/RDF plug-in. This measure should be configured in the Common module. |
| First Aux Measures | For each preprocessing path, the PrepDemand plug-in allows a maximum of six runs, which means six preprocessing stages (one preprocessing method per stage). Each preprocessing method may require supporting measures as inputs. Two supporting measures are allowed for each run. These supporting measures are specified in the fields of First and Second Aux measures. Examples of these measures include out-of-stock indicator or promotional indicator. These measures are external measures to PrepDemand and should be configured in PrepDemand Common. |
| Second Aux Measures |
Once all input measures are configured, perform the following steps in Configuration Tools and the Preprocessing Parameters utility.
From the Configuration Tools toolbar, select the Automation menu and then, from the Prepare Demand option, select Specify Parameters.
On the Preprocess Parameters utility, click the P icon.
A new preprocessing path is added, and it is assigned the next available level number. To specify the properties for the preprocessing path, see Edit Preprocessing Parameters for details. The Higher Intersection selection box allows you to specify the intersection of default preprocessing parameters.
After finishing the configuration, click OK to start generating the preprocessing configuration.
Table 3-5 lists all of the Preprocessing Parameters.
Table 3-5 Preprocessing Parameters
| Preprocessing Path Parameters | Description |
|---|---|
|
Preprocessing Path |
The field is the system-assigned path number when a preprocessing path is created. This is a read-only parameter. |
|
Label |
The field is the level description that is viewed by the user once the domain is created. |
|
Intersection |
The intersection of the preprocessing input and output measures. |
|
Data Source |
The data source is the measure to be used as the input data (for example, POS) for the preprocessing. |
|
Output |
The output is the measure to store preprocessed result, which may serve as input to New Item /RDF modules. |
|
Method [n] |
There are six fields for preprocessing method (method 1 through method 6). The plug-in provides a list to select a specific method each field. Each method is considered a run. The maximum number of runs allowed per path is six. |
|
Run [n] Label |
There are six fields to label preprocessing runs. One label per preprocessing method. |
|
First Aux [n] |
First Aux and Second Aux are fields to specify supporting measures per preprocessing method, such as seasonal profile, outlier indicator, outage indicator and promotion indicator. For each preprocessing method, the plug-in allows for two optional measures to be used. Some preprocessing methods need only one, others need none. If it is not needed, then leave the field empty. There are six First Aux fields and six Second Aux fields, one per method. Always populate the First Aux field first before using Second Aux. Refer to Table 3-6 for the First Aux and Second Aux supporting measures. |
|
Second Aux [n] |
Table 3-6 lists the supporting measures for the First Aux and Second Aux preprocessing parameters.
Table 3-6 First Aux and Second Aux Supporting Measures.
| Method | First Aux | Second Aux |
|---|---|---|
|
Standard Median |
not applicable |
not applicable |
|
Oracle Retail Median |
not applicable |
not applicable |
|
Standard Exponential Smoothing |
Outage |
event flag |
|
Override |
Reference |
mask |
|
Increment |
Reference |
mask |
|
Clear |
not applicable |
not applicable |
|
Deprice |
Price |
not applicable |
|
DePromote |
promolift |
event flag (optional) |
|
Deseasonal |
Seasonal Profile |
not applicable |
This method removes promotion lift from input based on the promolift and eventflag (optional). The promolift measure is expected to be a real measure on the same intersection as input. Its value is 0. Consecutive nonzero promolift periods is considered a promotion window. If all nonzero promolift is 1 for a timeseries, standard exponential smoothing is performed on the input. If the promolift is nonzero (not all ones) and the promotion window is less than or equal to short event max length, Standard Exponential Smoothing is performed on the input. All the parameters related to standard exponential smoothing such as eventflag, history window and future window will apply under this circumstance. When the promotion window is longer than short event max length, the input data is divided by the promolift value to remove promo lift.
This is a hybrid preprocessing method. If short event max length is set to zero, this method always perform Standard Exponential Smoothing. The promolift is used as promotion indicator. If short event max length is set to a larger number such as 9999, output = input/promolift when promolift is non zero. output =input when promolift is zero.
If the DePromote method is used and the promolift measure (prepromolift GA measure) is selected as the promo indicator measure, the same measure must be selected as the event flag (secondary aux measure) for the outage and outlier runs. Basically the even flag measure must be the same measure as the input measure for the de-promote run.
RDF GA has built in logic to calculate promolift based on causal effects and promotion calendars. There is a boolean measure named PreCalcPromolift in the Batch Flow Management workbook. When PreCalcPromolift is set to true, promolift for a certain preprocess path is automatically calculated based on its default forecast level's causal effects and promotion calendars. When PreCalcPromoLift is set to false, then promolift can be an custom measure that is loaded.
|
Note: The Calculate Promotion Lift (PreCalcPromoLift) and Calculate Promotion Indicator (precalcpromoind) are mutually exclusive and should not be selected together. |
In the common plug-in, the Intertwine Preprocess and Estimation? check box is introduced specifically for the DePromote method. There are two different flows for estimation batch when DePromote is configured. The different flow produces different results. When the check box is turned off, the estimation batch follows the normal process with preprocessing completed first and followed by estimation of seasonality curve and promotional effects second. The following is a description of the batch steps when preprocessing and estimation are not interwined.
When a domain is freshly built, there is no causal effects calculated. RDF GA calculates an initial promolift as 1 when merged promotion indicator is on and 0 when the merged promotion indicator is off.
After the first time estimation batch is run, then the following steps are performed:
If any input data reset is enabled for a preprocess path, clear out any preprocess adjustments, seasonal curves, and promotional effects. Save the Preprocess window.
Calculate the preprocessing indicators including promolift and seasonal profile.
If seasonal curves were not populated, 1 is used as default for initial seasonal profile for preprocessing. The initial promlift is 1.0 when the merged promotion calendar is on.
Run Preprocessing.
Determine if the Estimation needs to run twice. Rerun Estimation a second time if the promotion effects or seasonal curves do not exist.
Run Estimation batch to get causal effects and seasonal curve.
If Estimation needs to run a second time, then update preprocessing indicators based on the result from Step 5.
Calculate updated promolift using new effects and promotion calendars.
Calculate Seasonal Profile based on new seasonal curves.
If Estimation needs to run a second time, then run Preprocessing again
If Estimation needs to run a second time, then run Estimation Batch again to generate causal effects and seasonal curves.
Perform the following:
Restore the Preprocessing window
Set the reset preprocess data to false.
Set the run estimation twice to false.
When causal effects or seasonal curves exist, then the Estimation Batch has been run in the domain at least once before.
If the Estimation Batch is set to run again, then both preprocessing and estimation will only run once.
Only Steps 2-5 are performed. The remaining steps are skipped.
When the Intertwine Preprocess and Estimation? check box is selected, the estimation batch is performed using the following steps:
Wipe out previous sales adjustment and causal effects.
Calculate historical promotion lift based on causal effects and promotional calendar. Because the causal effects were wiped out, the weekly promotion lift were all 1s.
Run the preprocessing path that is configured to generate baseline estimation data source. It uses the DePromote method with promotion lift calculated from Step 2. Because the promotion lift were all 1s, the preprocessing special expression automatically switched to Standard Exponentially Smooth to remove the promotion lifts.
Calculate approved seasonal curves (appllccurve_CF_) using preprocessed sales from Step 3.
Calculate seasonal profile (preseasprof) using escalation path and approved seasonal curves from Step 4.
Run the preprocessing path that is configured to generate data source for causal. It uses the seasonal profile from Step 5 to deseasonalize the original sales.
Calculate approved promo effects (prmappeff_CFP_) using deseasonalized sales from Step 6.
Calculate weekly promotion lift using approved effects from Step 7 and promotion calendars. This time, the promotion lift can have numbers other than 1 and 0.
Run the preprocessing path that is configured to generate baseline estimation data source. It uses the DePromote method with promotion lift calculated from Step 8.
Calculate approved seasonal curves (appllccurve_CF_) using preprocessed sales from Step 9.
Calculate seasonal profile (preseasprof) using escalation path and approved seasonal curves from Step 10.
Run the preprocessing path that is configured to generate data source for causal. It uses the seasonal profile from Step 11 to deseasonalize the original sales.
Calculate approved promo effects (prmappeff_CFP_) using deseasonalized sales from Step 12.
There is a difference between the two modes of running the estimation batch. The non-interwine mode is an iterative mode. If the causal effects converge quickly, it will stabilize in a few runs. If it does not converge, the effects tend to be different after each run.
The interwine mode always starts with no effects and performs interpolate first and DePromote by promotion lift the second time. It will generate the same result every time. It is more consistent. There different custom hook for these two mode and it is not simple to switch between these two modes. Refer to Chapter 4, "RDF Cloud Service Extensibility," for the custom hooks that are available.
This method removes the seasonality from the input based on the seasonal profile generated during each run of the estimation.
This method increments or decrements the destination measure by the source measure, which is adjusted by the adjustment percentage according to the mask. It is recommended for updating outliers or data gaps when an existing reference measure exists as a default adjustment.
Increment provides the following features:
It is a simple data increment of a given percentage of the reference data to copy from.
Has one required parameter, Reference measure to increment by.
This has to be specified as the first auxillary measure in the preprocess plugin tab.
It may or may not take outage information (for example, event) as an input to mask the operation.
This can be specified as an optional second auxillary measure in the preprocess plugin tab.
Can accept another optional parameter, Ratio of reference to actually increment by.
This can be specified in the Delta parameter measure in the Preprocess workbook.
This method overrides the destination measure with the source measure that is adjusted by the adjustment percentage according to the mask. It is recommended for filling data gaps when an existing reference measure exists as a default value.
Override provides the following features:
It is a simple data copy of a given percentage of the reference data to copy from.
Has one required parameter, Reference measure to copy data from.
This has to be specified as the first auxiliary measure in the preprocess plug-in tab.
It may or may not take outage information (for example, event) as an input to mask the operation.
This can be specified as an optional second auxiliary measure in the preprocess plug-in tab.
Can accept another optional parameter, Ratio of reference to actually copy.
This can be specified in the Delta parameter measure in the Preprocess workbook.
Deleting a preprocessing path causes the system-assigned enumerated values in the path name to renumber such that paths are in consecutive order, starting with preprocessing path 01. Deleting a preprocessing path may impact any solution configuration that uses a specific preprocessing output.
|
Caution: If the domain using the configuration has previously been installed, there is potential to lose data associated with a path that has been deleted or renumbered. |
Perform the following steps to delete a preprocessing path:
On the Preprocessing Parameters utility, highlight the number of the path that you want to delete from the path window.
Click the X icon to delete the path. The path is deleted.
Select OK to regenerate the solution with the changes to the PrepDemand configuration.
In RDF, the Demand Model to generate the forecast is:
Demand = Base Demand * Seasonality * Promo Effects * Price Effects
This is the basic model used to forecast short lifecycle and long lifecycle items. However the approach to calculate each of these components might differ.
Forecast information is often required for items at the lowest levels in a hierarchy. Problems can arise when historic sales data for these items is too sparse and too noisy to identify clear selling patterns. In such cases, calculating the seasonality curves and effects at a higher level in the hierarchy based on an escalation path, would generate a reliable forecast. The RDF plug-in provides a mechanism to define the final levels and escalation levels; and the associated parameters for each level. The default escalation path is the order in which the escalation levels are defined in the plug-in. This can be edited in the setup workbooks from the UI. Users can also override the escalation path at the final level intersection from the UI.
The RDF solution can be configured using the following tabs in the RDF plug-in UI:
Table 3-7 RDF plug-in UI Tabs
| Tabs | Description |
|---|---|
|
Short Lifecycle |
Define and configure Short Lifecycle final level and escalation levels |
|
Long Lifecycle |
Define and configure Long Lifecycle final level and escalation levels. These final levels generate a causal forecast by applying the casual effects on top of the baseline. Level, trend, seasonality curve and promotion effects can be estimated on these levels. The forecast is derived based on these factors. |
|
Causal Events |
Define and configure the causal events for Short Life cycle and Long Lifecycle items. |
|
Baseline |
Define and configure Long Lifecycle final level and escalation levels. This generates a baseline forecast. This can be used when we only have base demand and seasonality curve, but do not have promo effects or price effects. |
Perform the following steps to generate an RDF solution:
From the Configuration Tools toolbar, select the Automation menu and then, from the RDF option, select Specify Parameters. The following steps outline the process for configuring RDF forecast levels.
Select the tabs to configure the various parameters for Short Lifecycle, Long Lifecycle, and Causal Events.Each tab is discussed in detail in subsequent sections.
Configure a forecast level:
To configure a final forecast level:
From the Forecasting Parameters utility, click the F icon. A new final level is added, and it is assigned the next available level number. Specify the properties for the final level. See Editing Forecast Level Parameters for details.
To configure an Escalation level:
From the Forecasting Parameters utility, highlight the final level number in which the new source level will be associated from the Level window and then click the S icon instead. A new escalation level is added, and it is assigned the next available number. Specify the properties for the escalation level.
To configure a Pooling level (applicable only for Long Lifecycle tab):
From the Forecasting Parameters utility, highlight the final level number in which the new pooling level will be associated from the Level window and then click the P icon instead. A new pooling level is added, and it is assigned the next available number. Specify the properties for the source level.
|
Note: To remove a final level, escalation level or pooling level, select the forecast level and then click the X icon. Deleting a final level will remove all of its associated escalation and pooling levels. |
|
Note: A causal final level should have at least one pooling level. For best performance and accuracy the pooling level should be higher than the final level. |
Perform the following steps to configure Short Lifecycle Forecast parameters:
Select the Short Lifecycle tab in the RDF plug-in UI.
Specify the parameters for the short lifecycle levels. See Edit Short Lifecycle Forecast Level Parameters.
Table 3-8 lists all of the Short Lifecycle Forecast Level Parameters.
Table 3-8 Short Lifecycle Forecast Level Parameters
| Short Life Cycle Parameters | Description |
|---|---|
|
Level Name |
The level name is the system-assigned level number when a forecast level is created. This is a read-only parameter. |
|
Level Label |
The level label is the level description that will be viewed by the user once the domain is created. Level labels may not exceed 40 characters. A hyphen '-' should not be used before or after the Forecast Level label. An example of a Forecast Level label that would violate this requirement is: -1:itm/str/week - Final-. This example is acceptable as: 1-itm/str/week – Final A colon ':' should not be used at all in the Level label. An example of a Level label that would violate this requirement is 1: itm/str/week- |
|
Intersection |
The intersection is the hierarchy dimensions that define the forecasting and escalation levels.To configure an escalation level supporting grouping, grouping dimension needs to be included in the intersection of the escalation level. For example, |
|
Forecast Intersection |
This defines the level at which forecast will be generated. |
|
Source Data |
Assigned only at the final level, the source data is the measure to be used as the input data (for example, POS) for the generation of forecasts. The values in this list are populated with all non-string and non-Boolean type measures that are configured in the project. |
|
Season Code Intersection |
Short Lifecycle items can be grouped together based on their selling pattern and assigned to a season code in the UI. In the plug-in we specify the intersection at which the season code is defined. In GA config, it is defined at dept/chnl/code. |
|
Average Sales Intersection |
For Short Lifecycle, to calculate the price effects, we transform the sales to remove seasonality and only keep markdown effects. During this transformation, the sales are averaged at the level defined by the ”Average Sales Intersection” parameter. In GA config, it is defined at clss/chnl/code. |
|
Seasonality Curve Intersection |
This defines the level of the seasonality curve that will be used for forecasting. In GA config, it is defined at woyr/skup/stor. |
|
Escalation Path Intersection |
This is the level at which the default escalation path is defined. In GA config, it is at clss/regn. |
|
Dashboard Level |
This parameter indicates that this final level has to be seen in the dashboard. Ideally we would have only one short lifecycle level. But if an implementer chooses to have more than one short lifecycle levels, there can be only one short lifecycle dashboard level. |
|
Promo Agg Profile Intersection |
This defines the Aggregation Profile intersection for promotions. |
|
My Exception |
This parameter provides a mechanism for the implementer to configure custom real time alerts. These alerts will be used during the batch for Forecast approvals and also seen in the dashboard exception profile as a separate tile. The implementer can enter the labels for the alert and the secondary measure such as variance measure. Note that the implementer is responsible to configure the rule/rule group (based on the alert definition) to populate the boolean measure (and variance measure) for the My Exception alert. After the plug-in automation has run, the implementer also needs to verify the alert condition settings and that the alert is on the intended worksheet. If an item/store is approved through either automatic or approve by alerts, the item/store's alert hit were cleared in all approval alerts including both GA approval alerts and MyException alerts. That way, when building the Dashboard workbook and Forecast Review workbook, only the unapproved items still have alerts. |
RDF validates the Short Lifecycle plug-in:
All the escalation levels must be defined higher than the final Forecast level intersection.
The seasonality curve intersection must be on PROD/LOC/woyr.
The Season Code Intersection must be on PROD/LOC/SeasonCode. It must be higher than or equal to final level intersection.
The Average Sales intersection must be within the season code intersection and partition dimension and higher than or equal to final level intersection.
The Long Lifecycle tab in the RDF plug-in dialog enables us to define long life cycle final levels and escalation levels. This is most common approach to be used when promo effects and price effects are available. The final level forecast generated takes into account seasonality and casual effects. In this approach the baseline forecast is internally generated and the effects are applied on top of it. In this tab we define three type of levels:
Final Level – This is the final forecast level.
Escalation Levels – defines the escalation levels used to calculate the seasonality curve
Pooling Levels – defines the pooling levels used to calculate the casual effects.
Perform the following steps to configure Long Lifecycle Forecast parameters:
Select the Long Lifecycle tab in the RDF plug-in UI.
Specify the parameters for the long lifecycle levels. See Edit Long Lifecycle Forecast Level Parameters.
Table 3-9 lists all of the Long Lifecycle Forecast Level parameters.
Table 3-9 Long Lifecycle Forecast Level Parameters
| Long Life Cycle Parameters | Description |
|---|---|
|
Level Name |
The level name is the system-assigned level number when a forecast level is created. This is a read-only parameter. |
|
Level Label |
The level label is the level description that will be viewed by the user once the domain is created. Level labels may not exceed 40 characters. A hyphen '-' should not be used before or after the Forecast Level label. An example of a Forecast Level label that would violate this requirement is: -1:itm/str/week - Final-. This example is acceptable as: 1-itm/str/week – Final A colon ':' should not be used at all in the Level label. An example of a Level label that would violate this requirement is 1: itm/str/week- |
|
Intersection |
The intersection is the hierarchy dimensions that define the forecasting and escalation levels.To configure an escalation level supporting grouping, grouping dimension needs to be included in the intersection of the escalation level. For example, |
|
Forecast Intersection |
This defines the level at which forecast will be generated. Usually the final level forecast intersection will be at week. In case of daily causal final level, the effects will be calculated at week level and the forecast will be spread from week to day. |
|
Source Data |
Assigned only at the final level, the source data is the measure to be used as the input data (for example, POS) for the generation of forecasts. The values in this list are populated with all non-string and non-Boolean type measures that are configured in the project. |
|
Casual Data Source |
Here we select the name of the data source measure used to calculate promotion effects at the final level. The values in this list are populated with all non-string and non-Boolean type measures that are configured in the project. |
|
Pooling Data Source |
Here we select the name of the data source measure used to calculate promotion effects at the pooling levels. The measure may be different than the causal data source, because at the pooling levels the data source can be normalized, something that is not recommended. |
|
Promo Agg Profile Intersection |
This defines the intersection of the Promo Aggregation Profile measure. It is used only for Daily Promotions, to aggregate promotions defined at day up to the week. |
|
Baseline Spread Profile |
This defines the intersection of the Baseline Spread profile measure. It is used only for Daily Causal to spread the baseline forecast from week to day level. |
|
DT Level |
This determines if the level enables the demand transference effects or not. If enabled, the DT corresponding measures will be created during automation. |
|
Seasonality Curve Intersection |
This defines the level of the seasonality curve that will be used for forecasting. In GA config, it is defined at woyr/skup/stor. |
|
Escalation Path Intersection |
This is the level at which the default escalation path is defined. In GA config, it is at clss/regn. It is used to defined the intersection of Intermediate Level views and forecast intermediate level parameters, as well as the lowest level of the wizards in Estimation Setup and Forecast Setup workspaces. |
|
Dashboard Level |
This parameter indicates that this final level has to be seen in the dashboard. Ideally we would have only one Long lifecycle level. But if an implementer chooses to have more than one Long lifecycle levels, there can be only one Long lifecycle dashboard level. |
|
Extra Week Indicator |
This defines the level at which the extra week indicator measure (week53indicator) is registered. |
|
Max Horizon |
Defines the maximum number of weeks of forecast length. |
|
My Exception |
This parameter provides a mechanism for the implementer to configure custom real time alerts. These alerts will be used during the batch for Forecast approvals and also seen in the dashboard exception profile as a separate tile. The implementer can enter the labels for the alert and the secondary measure such as variance measure. Note that the implementer is responsible to configure the rule/rule group (based on the alert definition) to populate the boolean measure (and variance measure) for the My Exception alert. After the plug-in automation has run, the implementer also needs to verify the alert condition settings and that the alert is on the intended worksheet. If an item/store is approved through either automatic or approve by alerts, the item/store's alert hit were cleared in all approval alerts including both GA approval alerts and MyException alerts. That way, when building the Dashboard workbook and Forecast Review workbook, only the unapproved items still have alerts. |
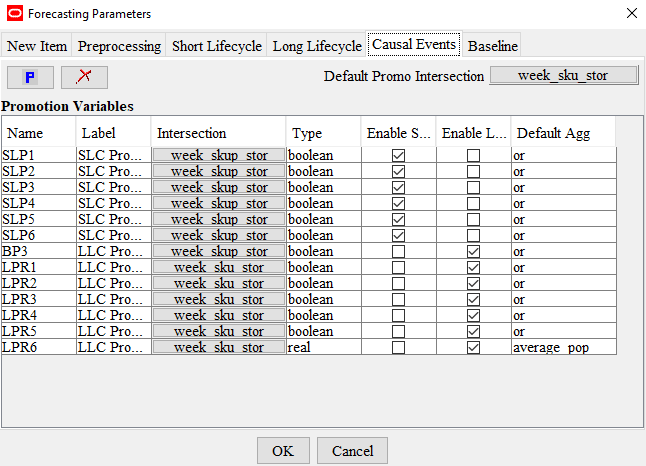
This tab provides a mechanism to setup promotional and causal events, such as radio advertisements and holiday occurrences.
Select the Causal Events tab in the RDF plug-in UI.
Specify the parameters for the casual events. See Edit Parameters for Causal Events.
Perform the following steps to create a promotion:
From the Promote Parameters utility, click the P icon.
A new promotion is added, and it is assigned a default promotion number for the Promotion Name (for example, P001).
Specify the properties for the promotion. See Edit Parameters for Causal Events.
Perform the following steps to delete a promotion:
From the Promote Parameters utility, highlight the promotion that you want to delete from the configuration.
Click the X icon. The promotion is deleted.
Click OK to regenerate the solution with the changes to the promotion configuration.
Patch the domain with the new configuration.
Table 3-9 lists all of the Casual Events parameters.
Table 3-10 Casual Events Parameters
| Causal Events Parameters | Description |
|---|---|
|
Default Intersection |
The Default Intersection is the intersection at which any new promotion will be defined. Editing the Default Intersection will not affect any existing promotions. |
|
Promotion Name |
The Promotion Name is the internal system identifier of the promotion. The system will initially assign a generic Promotion Name (P001), but this value may be overwritten. The Promotion Name may not be greater than four characters. The following characters may not precede or follow the name that is entered in this field: '( )' Example: (xmas) '-' Example: -xmas- The following must not be used at all in the Promotion Name: ':' Example: xmas: |
|
Promotion Label |
The Promotion Label is the description of the promotion that will be viewed by the user once the domain is created. Promotion Labels may not exceed 40 characters. The following characters may not precede or follow the label that is entered in this field: '( )' Example: (xmas) '-' Example: -xmas- The following must not be used at all in the Promotion Name: ':' Example: xmas: |
|
Promotion Intersection |
The Promotion Intersection is the hierarchy dimension that defines the promotion. It is pre-populated with the value set in the Default Intersection at the time when the promotion is created. |
|
Type |
The Type is the data type of the promotion variable. Promotion Variables may be defined as Boolean or Real types. The value in this parameter defaults to Boolean. |
|
Enable LLC |
Enables the promotion for Long Lifecycle. |
|
Enable SLC |
Enables the promotion for Short Lifecycle. |
|
Default Agg |
The default aggregation to be used for the display of causal events. |
RDF validates the Casual Events plug-in:
Boolean promotions can only be of Linear model type.
Promotions of real data type can be exponential or power model type.
Short Lifecycle promotions can only be of boolean type.
The Baseline tab although not recommended, can be used when there are no promo effects or price effects to feed into the demand model. In such cases, we have only have the base demand and seasonality curve. Hence we only have the baseline final level and the escalation levels to calculate the seasonality curve.
Select the Baseline tab in the RDF plug-in UI
Specify the parameters for the baseline only long lifecycle levels. See Edit Baseline Only Long Lifecycle Forecast Level Parameters.
Table 3-11 lists all of the Baseline Only Long Lifecycle Forecast Level parameters.
Table 3-11 Baseline Only Long Lifecycle Forecast Level Parameters
| Baseline Only LLC Parameters | Description |
|---|---|
|
Level Name |
The level name is the system-assigned level number when a forecast level is created. This is a read-only parameter. |
|
Level Label |
The level label is the level description that will be viewed by the user once the domain is created. Level labels may not exceed 40 characters. A hyphen '-' should not be used before or after the Forecast Level label. An example of a Forecast Level label that would violate this requirement is: -1:itm/str/week - Final-. This example is acceptable as: 1-itm/str/week – Final A colon ':' should not be used at all in the Level label. An example of a Level label that would violate this requirement is 1: itm/str/week- |
|
Intersection |
The intersection is the hierarchy dimensions that define the forecasting and escalation levels.To configure an escalation level supporting grouping, the grouping dimension needs to be included in the intersection of the escalation level. An example of a grouping escalation level intersection is:Dept/DVSN/grpd/woy. The prod/loc under a particular dept/dvsn intersection were grouped according certain criteria. Seasonal curves that were created will be on dept/dvsn/grpd/woy. |
|
Source Data |
Assigned only at the final level, the source data is the measure to be used as the input data (for example, POS) for the generation of forecasts. The values in this list are populated with all non-string and non-Boolean type measures that are configured in the project. |
|
Seasonality Curve Intersection |
This defines the level of the seasonality curve that will be used for forecasting. In GA config, it is defined at week/skup/stor. |
|
Escalation Path Intersection |
This is the level at which the default escalation path is defined. In GA config, it is at clss/regn. |
|
Dashboard Level |
This parameter indicates that this final level has to be seen in the dashboard. Ideally we would have only one Long lifecycle level. But if an implementer chooses to have more than one Long lifecycle levels, there can be only one Long lifecycle dashboard level. |
|
Extra Week indicator |
This defines the level at which the extra week indicator measure (extra***) is registered. |
|
Max Horizon |
Defines the maximum number of weeks of forecast length. |
|
My Exception |
This parameter provides a mechanism for the implementer to configure custom real time alerts. These alerts will be used during the batch for Forecast approvals and also seen in the dashboard exception profile as a separate tile. The implementer can enter the labels for the alert and the secondary measure such as variance measure. Note that the implementer is responsible to configure the rule/rule group (based on the alert definition) to populate the boolean measure (and variance measure) for the My Exception alert. After the plug-in automation has run, the implementer also needs to verify the alert condition settings and that the alert is on the intended worksheet. If an item/store is approved through either automatic or approve by alerts, the item/store's alert hit were cleared in all approval alerts including both GA approval alerts and MyException alerts. That way, when building the Dashboard workbook and Forecast Review workbook, only the unapproved items still have alerts. |
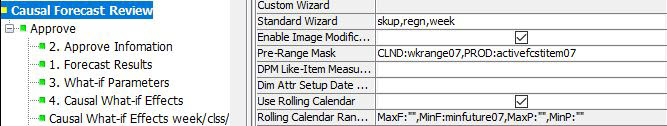
RDF CS has enabled an RPAS Rolling Calendar feature for the Long Lifecycle and Short Lifecycle Forecast Review workbook templates. Refer to the Oracle Retail Predictive Application Server Cloud Edition Configuration Tools User Guide for more details.
In essence this allows us to define a calendar window based on RPAS_TODAY. The main use case for this feature is for auto workbook builds, where in the calendar window advances based on RPAS_TODAY.
Out of the four rolling calendar range measures, only the Minimum Future has been set to the Alert Calculation window. This is set during the forecast batch.
The Minimum Past defaults to 0, which means it is not required to pull in any week prior to TODAY.
The Maximum Past and Maximum Future are also not set and will default to the current Calendar pre-range.
|
Note: The rolling calendar feature is not extensible and implementors cannot edit the rolling calendar range measures. |
As part of the domain build or patch process, RDF loads the GA translation files (which includes RPAS and taskflow files).
RDF then loads any custom translations that you may have placed on the SFTP server in the INCOMING_FTP_PATH/translation directory.
During the patch, RDF also loads previously uploaded translation files.
For details, refer to the Internationalization chapter in the Oracle Retail Predictive Application Server Cloud Edition Administration Guide.
|
Note: As part of configuration or extensibility, if the implementer changes the labels of the RDF level or Preprocessing paths in the plug-in, RDF generates the corresponding English (and non-english_us) translations in ther_msglabel measure and loads it.
For locale specific translations, it is the implementer's responsibility to upload the correct translation files. |
Since the RDF level labels are appended to the worksheet labels, the implementer should upload the new labels.
Perform the following steps to access the position names to create the locale specific file:
Make sure the browser locale is English - United States
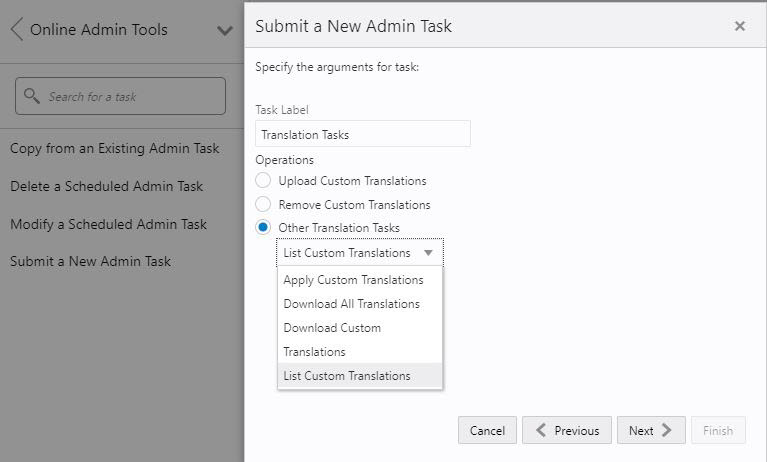
From the OAT configure batch task, go to the Translation Task and then, Download All Translations.
The r_msglabel.csv.ovr file contains the English labels as updated by the implementer in the RDF plug-in.
This file can serve as an example to create the locale specific r_msglabel file.
The locale specific file can contain only the records with the updated labels.
Revert the browser language to the original locale.
Upload the locale specific r_msglabel.csv.ovr file using the Translation Task from the OAT Configure Batch Task.