| Oracle® Retail Demand Forecasting Cloud Service User Guide Release 19.0 F24922-17 |
|

 Previous |
 Next |
| Oracle® Retail Demand Forecasting Cloud Service User Guide Release 19.0 F24922-17 |
|
Previous |
Next |
This chapter describes the Estimation Review Long Lifecycle for RDF Cloud Service.In this workspace you can review the seasonality curves and promotion at various intersections. This is also the place where, if available, the user adjusted, or loaded parameters are displayed.
The following table lists the workspaces, steps, and views for the Estimation Review Long Lifecycle task.
The General Estimation Review LLC workspace allows you access to all of the views listed in Estimation Review LLC Workspaces, Steps, and Views.
To build the General Estimation Review LLC workspace, perform these steps:
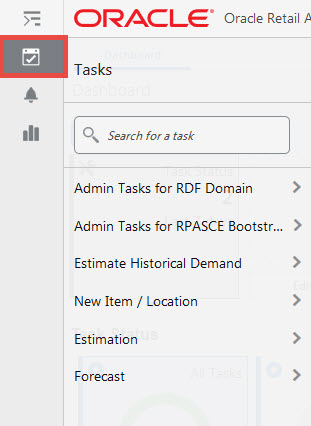
From the left sidebar menu, click the Task Module to view the available tasks.
Click the Estimation activity and then click Review to access the available workspaces.
Click Long Lifecycle. The Long Lifecycle wizard opens.
You can open an existing workspace, but to create a new workspace, click Create New Workspace.
Enter a name for your new workspace in the label text box and click OK.
The Workspace wizard opens. Select the products you want to work with and click Next.
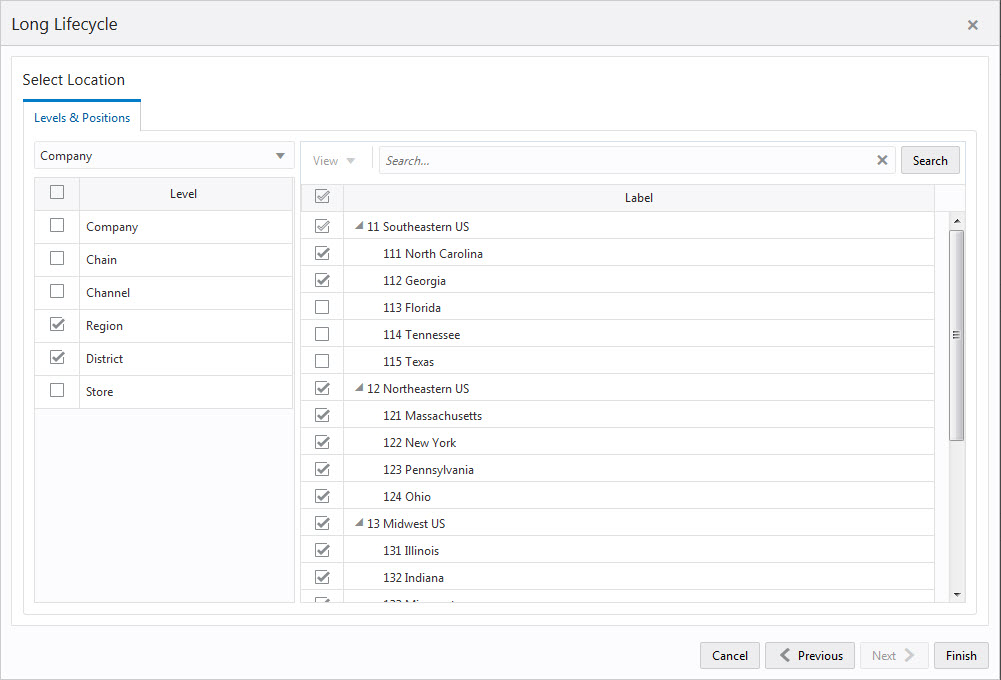
Select the locations you want to work with and click Finish.
The wizard notifies you that your workspace is being prepared. Successful workspaces are available from the Dashboard.
The available views are:
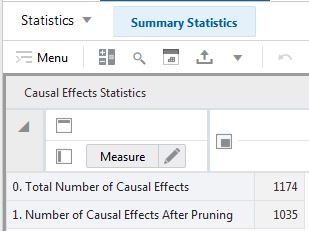
The Causal Effects Statistics view shows a summary of promo effects count.
The Causal Effects Statistics view contains the following measures:
0. Total Number of Causal Effects
This measure shows the total number of calculated promo effects.
1. Number of Causal Effects After Pruning
This measure shows the number of promo effects that passed pruning.
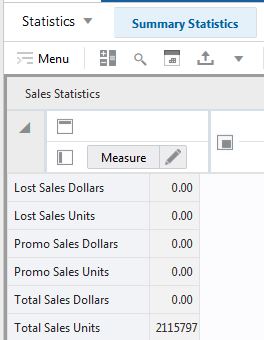
The Sales Statistics view shows a summary of demand metrics.
The Sales Statistics view contains the following measures:
Lost Sales Dollars
This measure shows the total amount of lost sales.
Lost Sales Units
This measure shows the total lost sales units.
Promo Sales Dollars
This measure shows the total amount of sales driven by promotions or price discounts.
Promo Sales Units
This measure shows the total sales units driven by promotions or price discounts.
Total Sales Dollars
This measure shows the total sales amount.
Total Sales Units
This measure shows the total sales units.
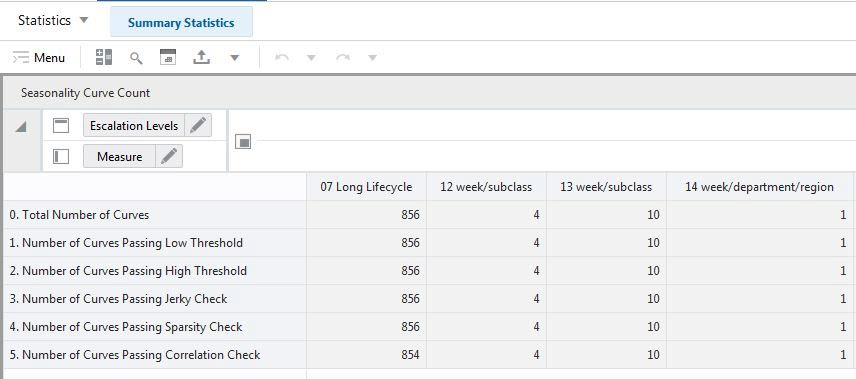
The Seasonality Curve Count view shows a summary of seasonality curves count.
The Seasonality Curve Count view contains the following measures:
0. Total Number of Curves
This measure shows the total number of calculated seasonality curves.
1. Number of Curves Passing Low Threshold
This measure shows the number of seasonality curves that passed the check for low seasonality indices.
2. Number of Curves Passing High Threshold
This measure shows the number of seasonality curves that passed the check for large seasonality indices.
3. Number of Curves Passing Jerky Check
This measure shows the number of seasonality curves that passed the check for jerky curves.
4. Number of Curves Passing Sparsity Check
This measure shows the number of seasonality curves that passed the check for sparse curves.
5. Number of Curves Passing Correlation Check
This measure shows the number of seasonality curves that correlate well with demand.
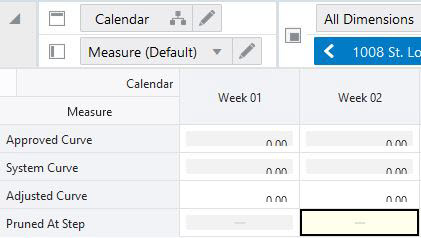
This step includes the Curves View.
The Curves view allows you to review the seasonality curves at several escalation levels
The Curves view contains the following measures:
System Curve
These are the seasonality curves calculated by the system.
Approved Curve
These are the approved seasonality curves.
Adjusted Curve
This measure can be used to load seasonality curves generated outside of RDFCS. If loaded curves exist, they display, if no load occurred, then the system values display. You can change values and click Calculate so that the values are normalized and copied into the Approved Curve measure.
|
Note: If you choose to override a seasonality curve, the values entered by you are normalized to 52, and become the approved curve. The approved curve is not a merge between the seasonality calculated by the system and the override values.Specifically, if you enter one value in week 42 of the override measure, the approved seasonality curve will be all zeros, except for week 42 where the index is 52. |
Pruned At Step
If a seasonality curve has all zeros there can be two reasons:
First, seasonality indices were generated, but one of the pruning checks have deemed the numbers unreliable. If this is the case, the measure displays the step in the pruning during which the seasonality curve was discarded.
The second reason for an empty curve is that seasonality indices were not generated to start with. For instance, because the historical demand was all zeros (new merchandise) or not long enough, typically 104 periods at the week level. If this is the case, the measure won't display anything, because it was not the pruning process responsible for the seasonality values to be all zeros.
The available views are:
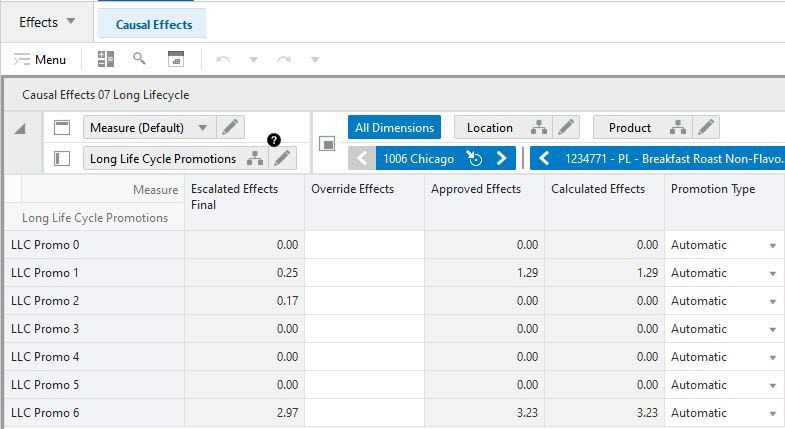
The Causal Effects Final view shows the promo effects at the final level.
The Causal Effects Final view contains the following measures:
Escalated Effects Final
This measure displays the effects calculated at pooling levels, which were determined during the escalation search.
Override Effects
This measure allows you to manually override the promo effect. The promotion type needs to be set to Override for the override to take effect.
Approved Effects
The approved effects are a combination between the override and calculated values. The logic is:
If override value exists, use it. Otherwise use the calculated value.
Calculated Effects
This measure displays the effects calculated at the final level
Promotion Type
Causal variable types define how causal variables are treated in the causal model-fitting process (which includes a call to the lower-level regression engine) and the forecast generation process where the model is used to extend the forecast over the forecast horizon.
The options are
Automatic: The system provides the effect.
Override: You can specify what value is used to determine the effect the event has on demand.
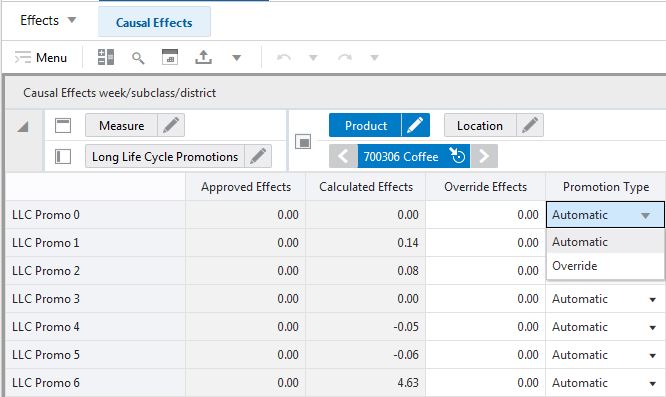
The Causal Effects Pool view shows the promo effects at the pooling levels.
The Causal Effects Pool view contains the following measures:
Override Effects
This measure allows the user to manually override the promo effect.
Approved Effects
This measure stores the approved effect at the pooling level. It is merging the calculated and the override values as follows: If there is no override value, use the calculated effects, otherwise use the override.
Calculated Effects
This measure shows the values of the calculated promo effects.
Promotion Type
Causal variable types define how causal variables are treated in the causal model-fitting process (which includes a call to the lower-level regression engine) and the forecast generation process where the model is used to extend the forecast over the forecast horizon.