| Oracle® Retail Demand Forecasting Cloud Service User Guide Release 19.0 F24922-17 |
|

 Previous |
 Next |
| Oracle® Retail Demand Forecasting Cloud Service User Guide Release 19.0 F24922-17 |
|
Previous |
Next |
This chapter describes the Estimation Review Short Lifecycle for RDF Cloud Service. In this workspace you can review the seasonality curves and price elasticities at various intersections. This is also the place where, if available, the user adjusted, or loaded parameters are displayed.
The following table lists the workspaces, steps, and views for the Estimation Review Short Lifecycle task.
The General Estimation Review SLC workspace allows you access to all of the views listed in Estimation Review SLC Workspaces, Steps, and Views It displays important information about the data that was processed during the estimation step. For the estimation results to be robust it is necessary to remove unreliable data points from the calculations. This step shows the original data points and the number of data points still available after each filter.
To build the General Estimation Review SLC workspace, perform these steps:
From the left sidebar menu, click the Task Module to view the available tasks.
Click the Estimation activity and then click Review to access the available workspaces.
Click Short Lifecycle. The Short Lifecycle wizard opens.
You can open an existing workspace, but to create a new workspace, click Create New Workspace.
Enter a name for your new workspace in the label text box and click OK.
The Workspace wizard opens. Select the products you want to work with and click Next.
Select the locations you want to work with and click Finish.
The wizard notifies you that your workspace is being prepared. Successful workspaces are available from the Dashboard.
The available views are:
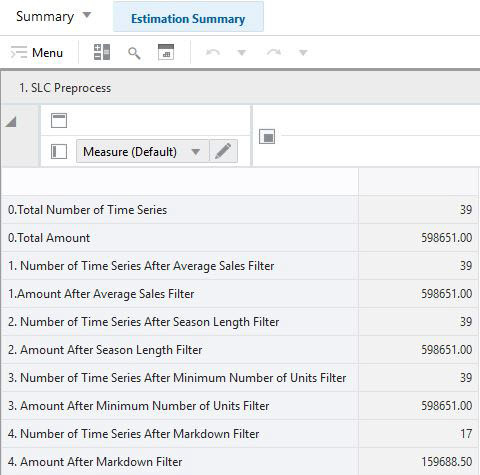
The SLC Preprocess view shows a summary of the SLC preprocessing.
The SLC Preprocess view contains the following measures:
0. Total Number of Time Series
Total number of product/location combinations with short lifecycle.
0. Total Amount
Total amount generated by product/locations with short lifecycle.
1. Number of Time Series After Average Sales Filter
Number of product/location combinations with short lifecycle that passed the average sales filter.
1. Amount After Average Sales Filter
Amount generated by product/location combinations with short lifecycle that passed the average sales filter
2. Number of Time Series After Season Length Filter
Number of product/location combinations with short lifecycle that passed the season length filter.
2. Amount After Season Length Filter
Amount generated by product/location combinations with short lifecycle that passed the season length filter.
3. Number of Time Series After Number of Units Filter
Number of product/location combinations with short lifecycle that passed the number of units filter.
3. Amount After Number of Units Filter
Amount generated by product/location combinations with short lifecycle that passed the number of units filter.
4. Number of Time Series After Markdown Filter
Number of product/location combinations with short lifecycle that passed the markdown filter.
4. Amount After Markdown Filter
Amount generated by product/location combinations with short lifecycle that passed the markdown filter.
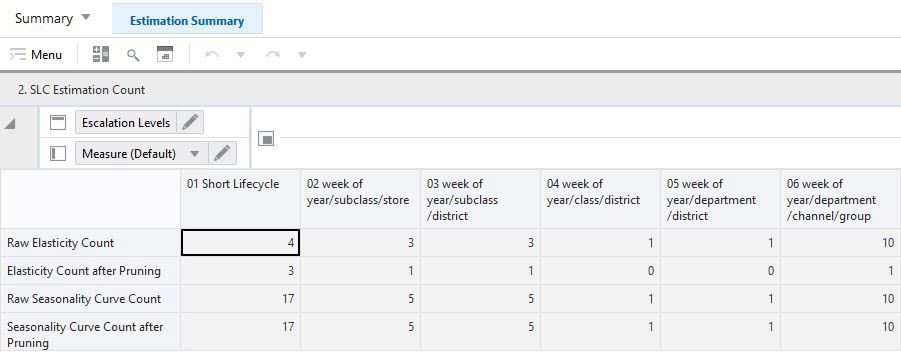
The SLC Estimation Count view shows a summary of the count of forecast parameters.
The SLC Estimation Count view contains the following measures:
Raw Elasticity Count
Total number of price elasticities before pruning.
Elasticity Count after Pruning
Number of price elasticities after pruning.
Raw Seasonality Curve Count
Total number of seasonality curves before pruning.
Seasonality Curve Count after Pruning
Number of seasonality curves after pruning.
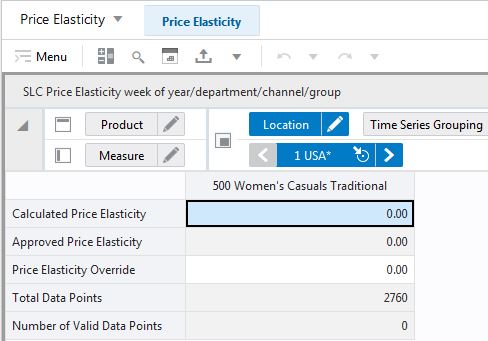
This step includes the SLC Price Elasticity View.
The SLC Price Elasticity view reviews the price elasticities at several escalation levels.
The SLC Price Elasticity view contains the following measures:
Calculated Price Elasticity
This measure shows the value of the price elasticity calculated by the system.
Approved Price Elasticity
This measure shows the value of the approved price elasticity.
Price Elasticity Override
This measure shows the override value of the price elasticity. This can be loaded, or can be manually entered.
Total Data Points
Total number of data points in this escalation level.
Number of Valid Data Points
Number of data points in the escalation level that passed pruning and were used to calculate price elasticities.
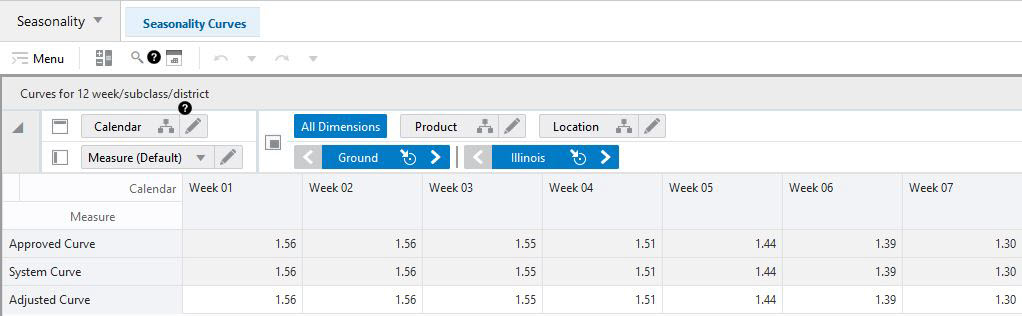
This step includes the SLC Seasonality Curve View.
The SLC Seasonality view reviews the seasonality curves at several escalation levels.
The SLC Seasonality view contains the following measures:
System Curve
This measure shows the seasonality curves calculated by the system.
Approved Curve
This measure shows the approved seasonality curves.
Adjusted Curve
This measure can be used to load seasonality curves generated outside of RDFCS. If loaded curves exist, they display, if no load occurred, then the system values display. You can change values and click Calculate so that the values are normalized and copied into the Approved Curve measure.
|
Note: If you choose to override a seasonality curve, the values entered by you are normalized to 52, and become the approved curve. The approved curve is not a merge between the seasonality calculated by the system and the override values.Specifically, if you enter one value in week 42 of the override measure, the approved seasonality curve will be all zeros, except for week 42 where the index is 52. |