| Oracle® Retail Assortment Planning User Guide for the RPAS Fusion Client Release 14.1 E55312-01 |
|

 Previous |
| Oracle® Retail Assortment Planning User Guide for the RPAS Fusion Client Release 14.1 E55312-01 |
|
Previous |
In-season/historical analysis is the eighth step in the AP business process. This process step includes the following tasks:
Table 9-1 Business Role in Size/Pack Allocation
|
|
The Senior Buyer and Buyer Analyst review in-season trends, make extend/markdown/add choices, review plans and trend/historical performance. |
|
|
The Merchandise Planner reviews sell-thru and Buy Plan changes. |
|
|
The Allocator executes the inventory strategy. |
This task includes one step with a number of tabs to support the various types of analysis required in-season. It is expected that the Buyer has re-trended the Buying Plan before using the Extend-Markdown-Drop functionality contained in this task.
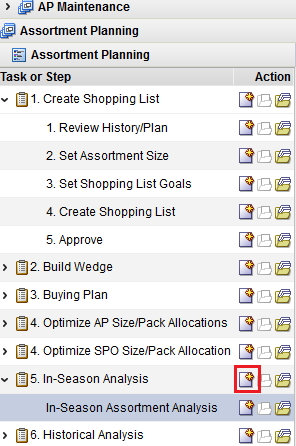
To create the In-Season Analysis workbook:
Select the New Workbook icon in the In-Season Analysis task.
The workbook wizard opens.
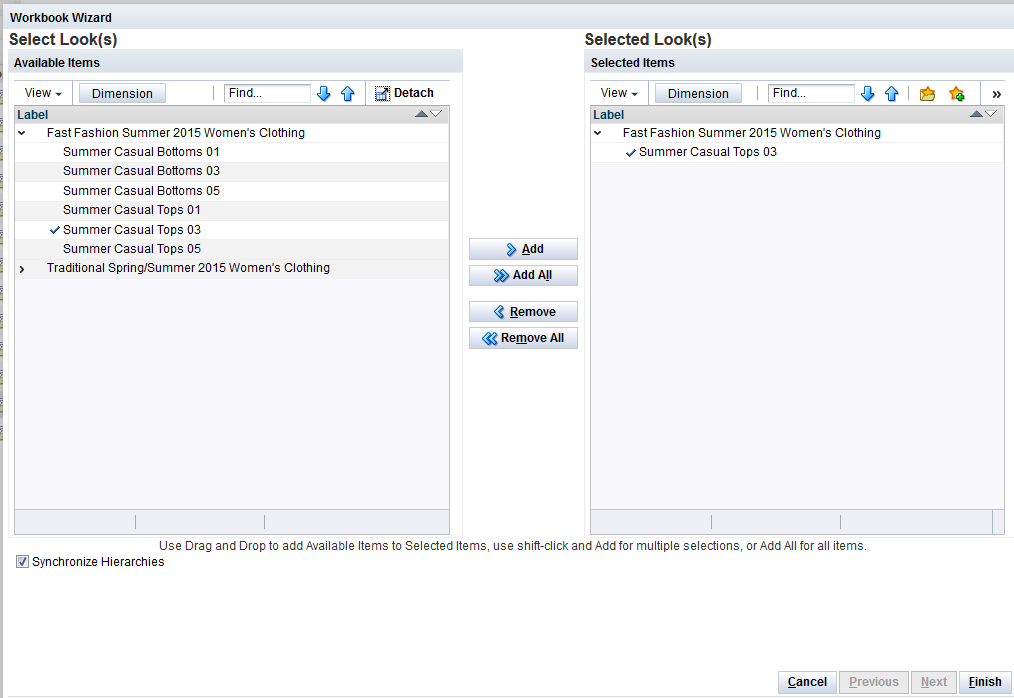
In the Select Looks page, select the looks to be loaded into the workbook. Click Finish.
The workbook is created.
This step has the following tabs and views:
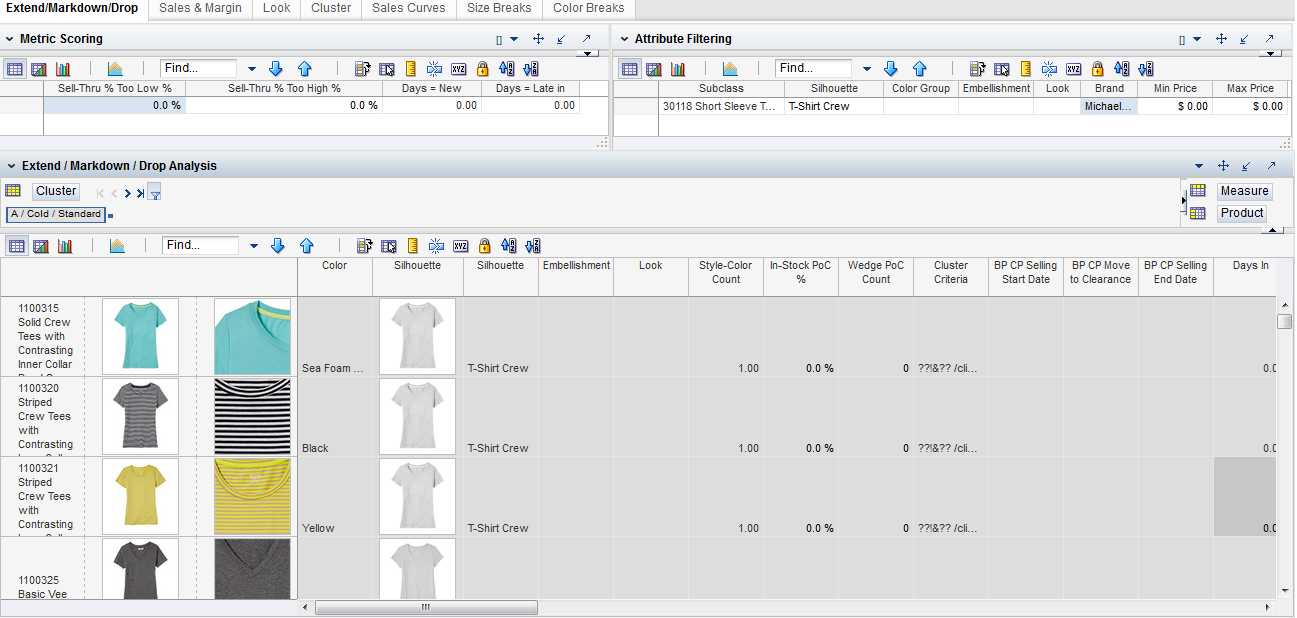
On this tab, the Buyer executes the in-season process of Extend (carry the style or style-color longer), Markdown (begin to mark the item down earlier than planned) and Drop (Exit the item earlier than planned. This could be due to faster or slower sales than planned).
This tab includes a variety of measures that enable three important areas of analysis for the Buyer:
Where am I trending to end a Look in terms of sales, margin and inventory for a given Subclass?
What styles or style-colors and/or clusters are contributing to the good or bad trended performance?
What actions do I need to take and can I take to correct the trends that are pointing to any negative end of Look projections (even selling better than plan early in the life-cycle can be a problem if that leaves me without any inventory of the desirable items later).
It is expected that the Buyer has re-trended the Buying Plan before using the Extend-Markdown-Drop functionality.
In this view, the Buyer views the trending positions for each style-color in the look and sees projected ending inventory positions and a recommendation for what can be done. There are several possible recommendations:
| Recommendation | Description |
|---|---|
| New |
|
| Move Up Exit Date |
|
| Buy Qty/Order Cancel |
|
| Start Clearance Now |
|
| Extend Selling Period |
|
| No Change |
|
The measures in this view can control the styles and style-colors visible in the Extend / Markdown / Drop view.
This tab has one view.
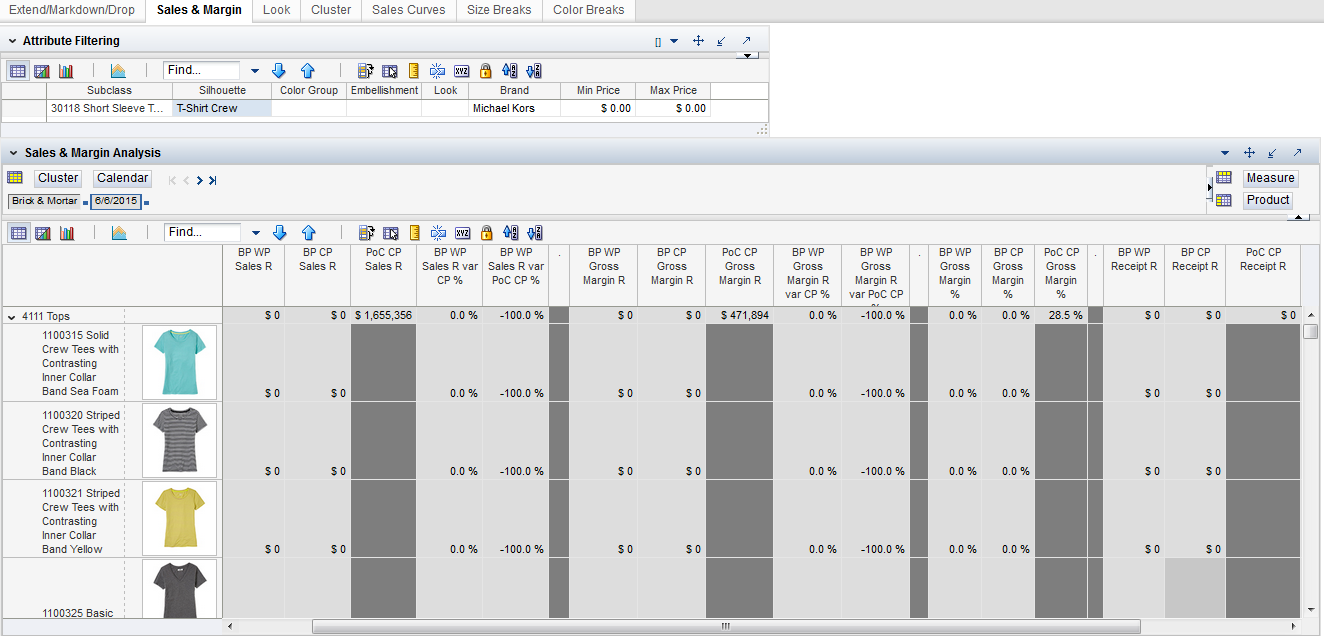
In this view, the Buyer views re-projected (from their Buying Plan) Working Plan version sales, margin, receipts, and inventory performance versus their Current Plan Version of the Buying Plan versus the Merchandise Financial Plan (that was spread down to the cluster level).
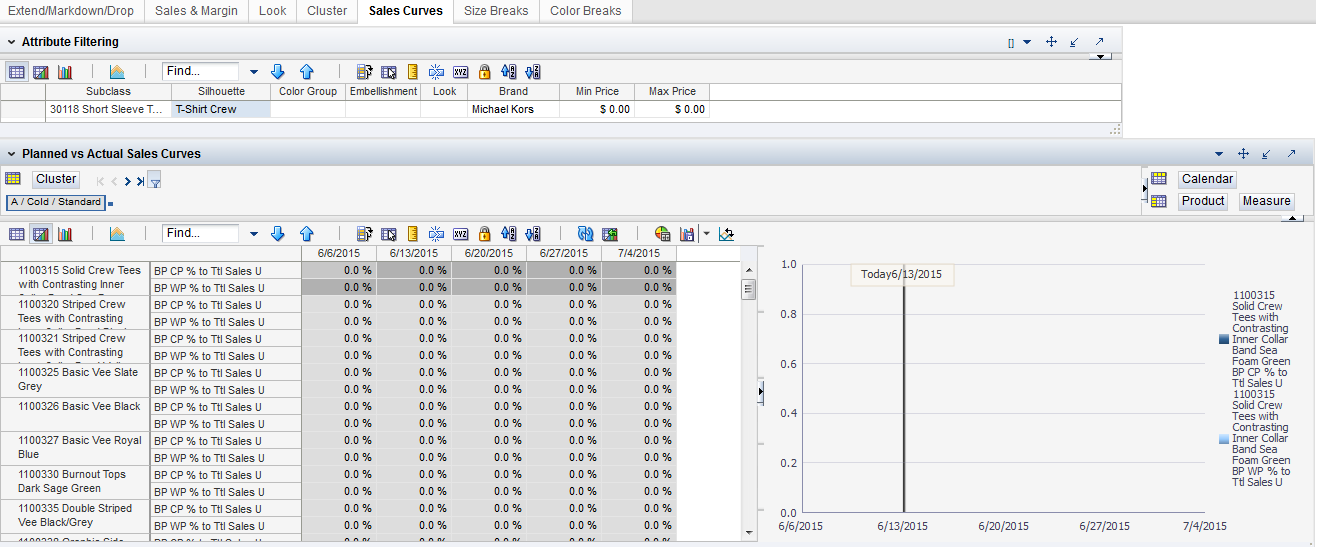
This tab has one view.
In this view, the Buyer can compare the sales curve used to seed the Buying Plan versus actuals.
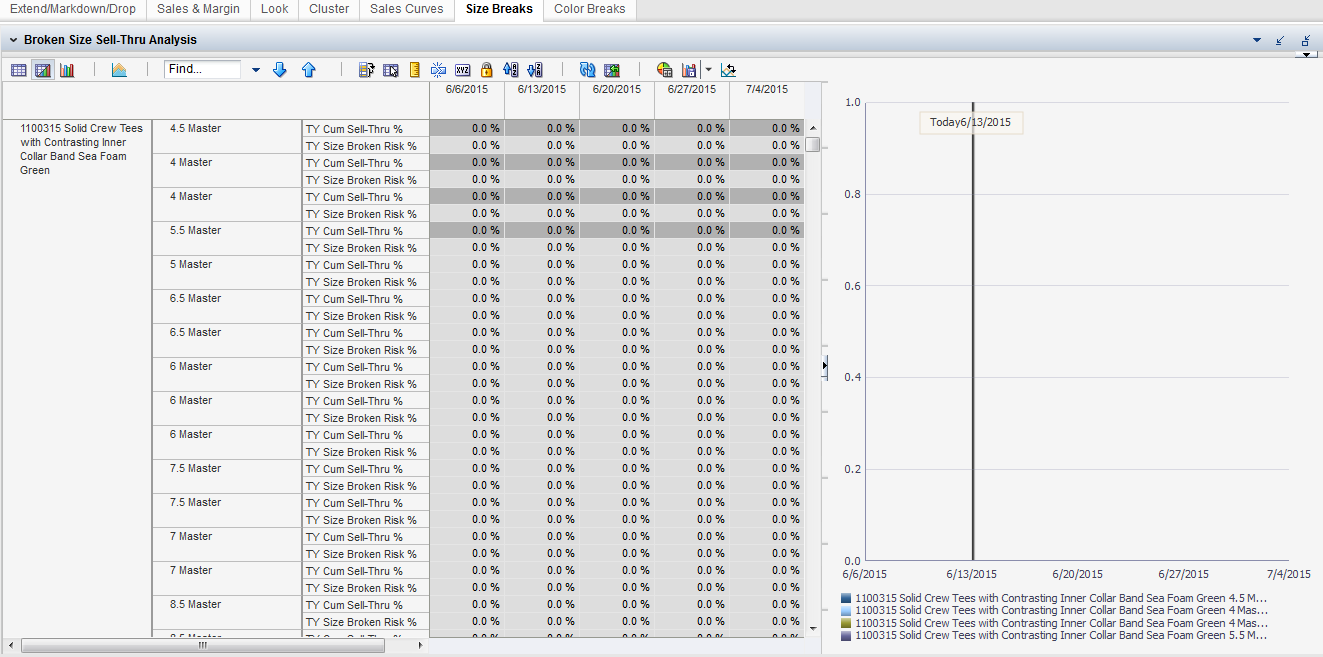
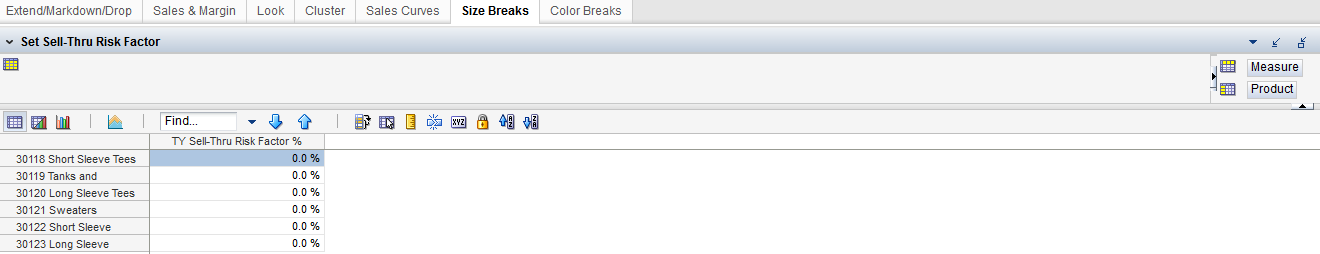
This tab shows analysis regarding actual size breaks at an aggregate of Store, Site, Application (Points of Commerce). Once a few of a style-color's sizes begin to run out of stock (and fulfilling the definition of being broken on sizes), sales begin to taper off more dramatically than based solely on the ratio of sizes out of stock. The display will begin to look ragged and the customer faces the issue of not wanting to buy the last item on the rack at full margin (as it was rejected by everyone else). This view helps to keep tabs on any looming size breaks.
This view shows the size break analysis.
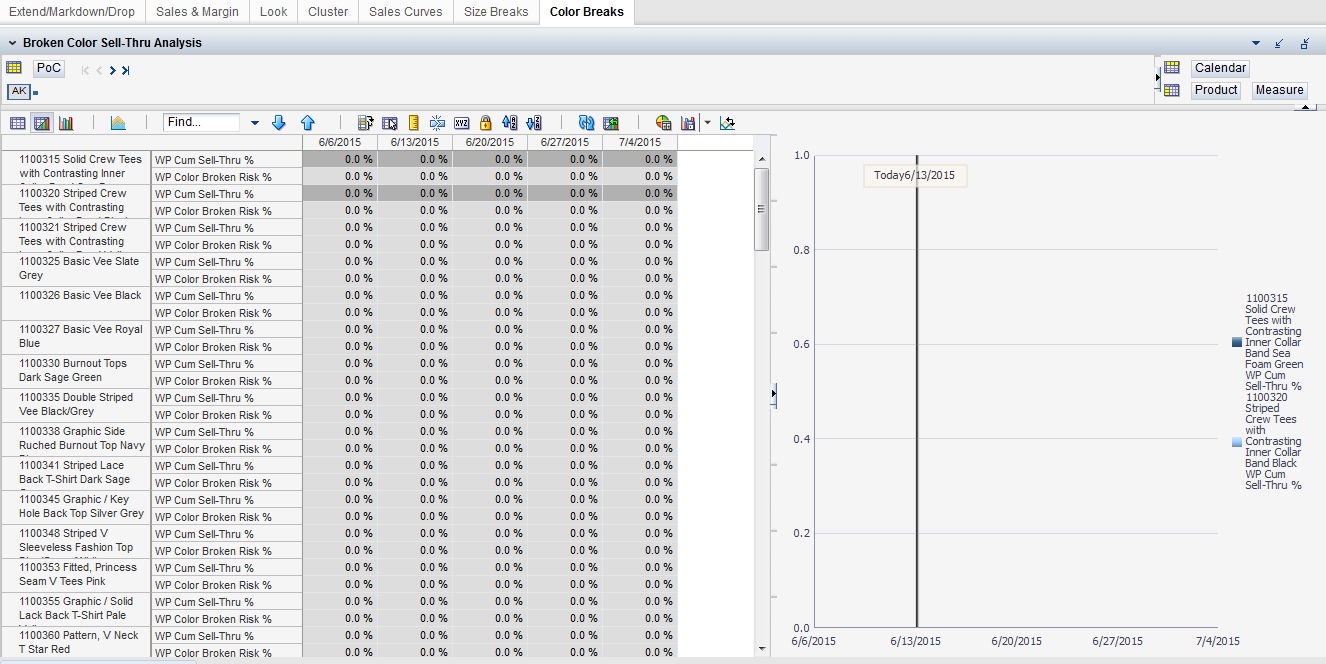
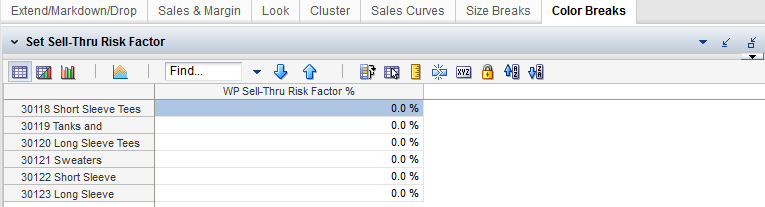
This tab shows analysis regarding projected and actual color breaks at an aggregate of Store, Site, Application (Points of Commerce). Once a few of a style's colors begin to run out of stock (and fulfilling the definition of being broken on colors), sales begin to taper off more dramatically than based solely on the ratio of colors out of stock. The display will begin to look ragged and Customer faces the issue of not wanting to buy the last item on the rack at full margin (as it was rejected by everyone else). This view helps to keep tabs on any looming color breaks.
This view shows the color break analysis.
This task includes one step with a number of tabs to support the various types of analysis required for historical analysis (the Buyer can view past, present and future time periods in these views).
These views are designed to give the Buyer and team better visibility into the trends that impact the assortment. These trends could manifest themselves in terms of product attributes, colors, customer segment preferences, how it is sold in direct channels (there are more nuanced measures available in the direct channels), and preferences for where the style-color was sold versus where it was fulfilled.
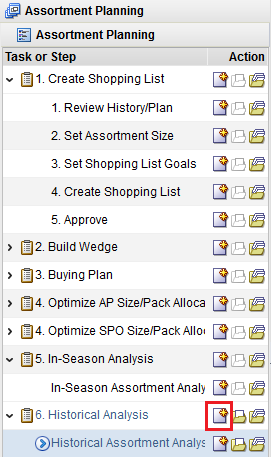
To create the Historical Analysis workbook:
Select the New Workbook icon the Historical Analysis task.
The workbook wizard opens.
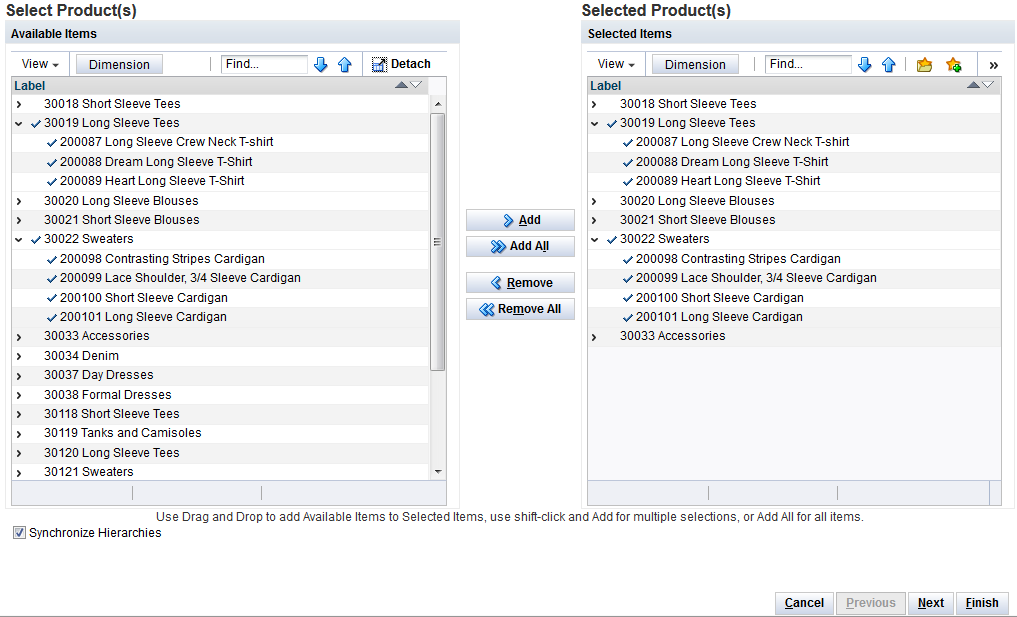
Select the Styles (or higher), Weeks (or higher), and the PoCs (stores, sites or applications and higher) to be loaded into the workbook. Click Finish.
The workbook is created.
This step has the following tabs and views:
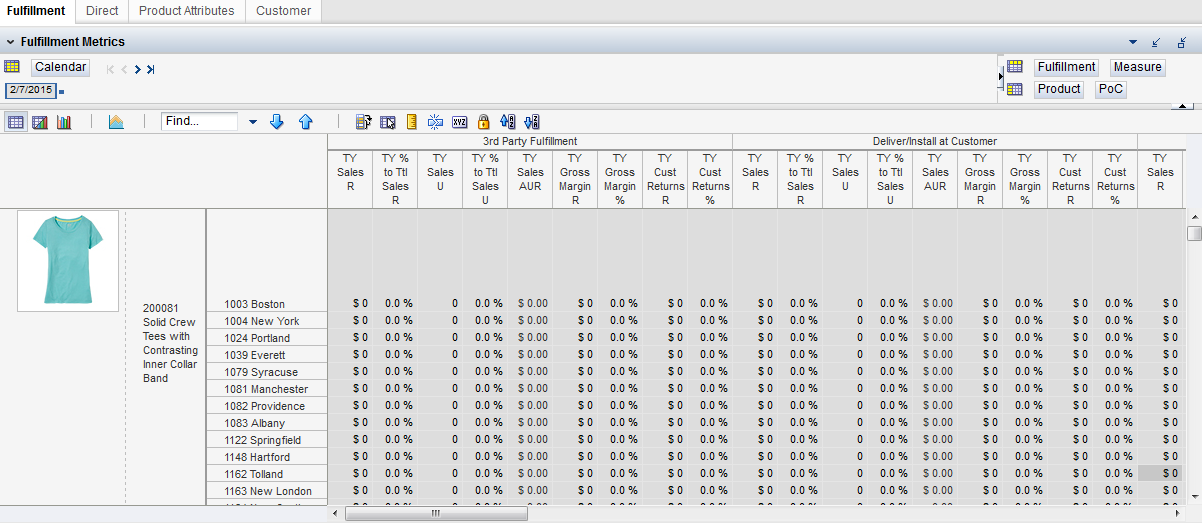
This tab has one view.
In this view, the Buyer can view the sales and margin that originated in a site, store, or app (or at an aggregate) and what percentage was fulfilled by each fulfillment type. For example, Mobile App X sold 500 units of sweaters:
40% were picked up by a customer in a store
40% were delivered to the customer's home
20% were delivered to someone other than the paying customer (as a gift)
There are some sample fulfillment options in the GA version, but the Buyer can tailor it to meet the fulfillment options.
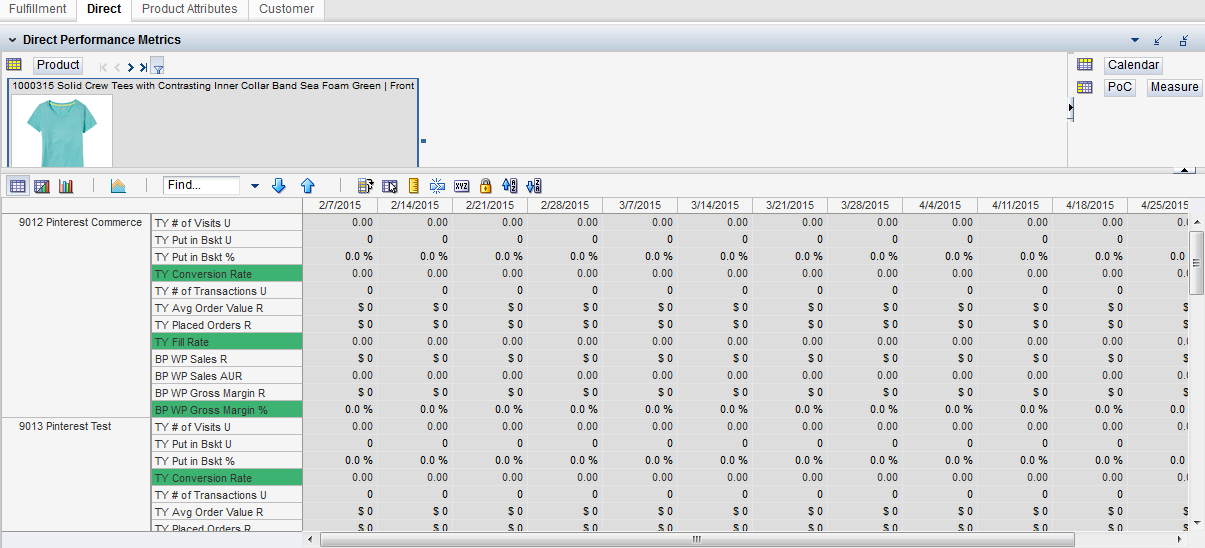
This tab has one view.
The Buyer can view the steps involved in the following:
Making a Direct Channel (web, mobile, social) purchase and determine how close they were to getting a sale. For example, if a style-color is missing its plan but leads in abandoned baskets, then it may not be the item itself, but the price or the shipping cost, and so on, as opposed to another item with equally poor sales that is put into baskets at a much lower rate (where the item is less desirable).
Fulfilling and returning a Direct Channel (web, mobile, social) purchase and determining if there was a fill rate or quality issue (leading to higher than normal returns) for the style-color (or higher).
This tab has one view.
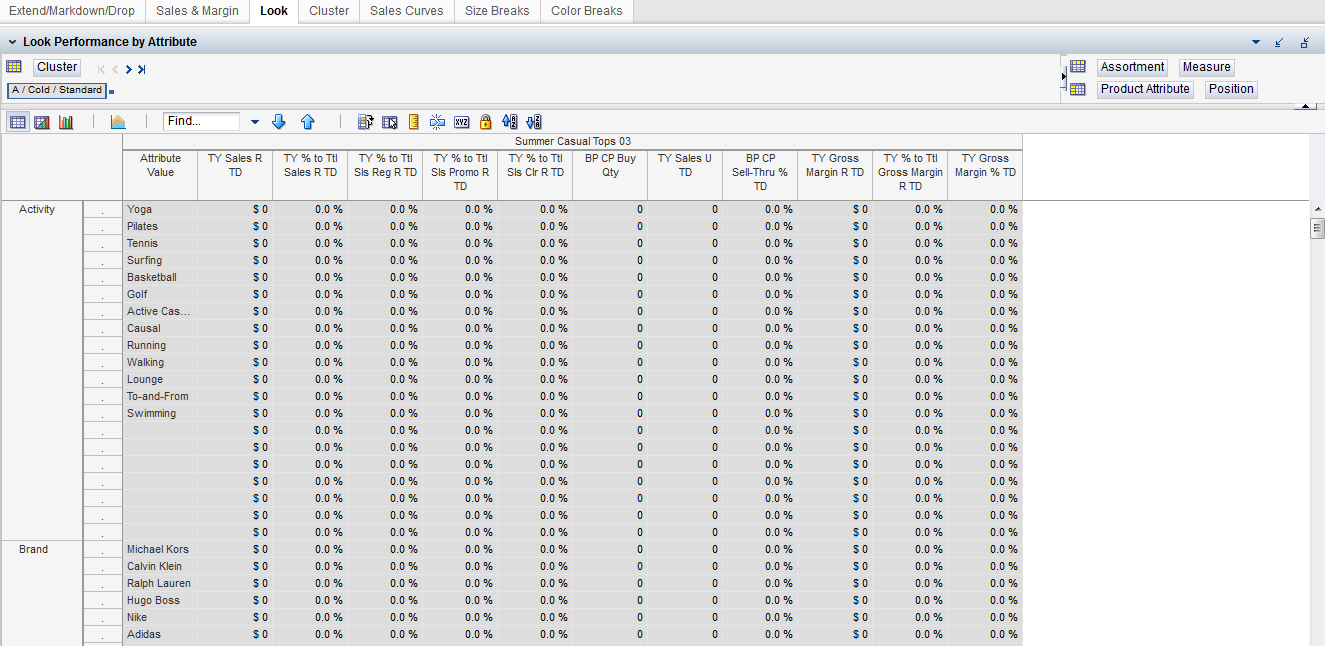
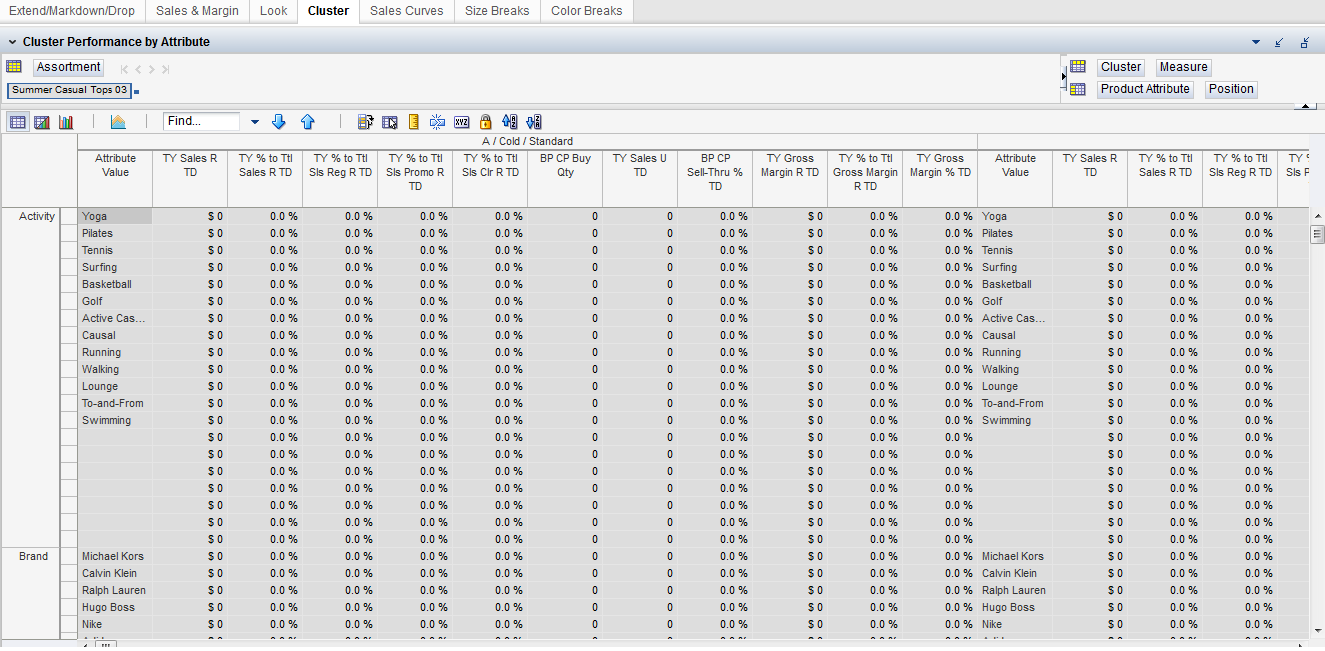
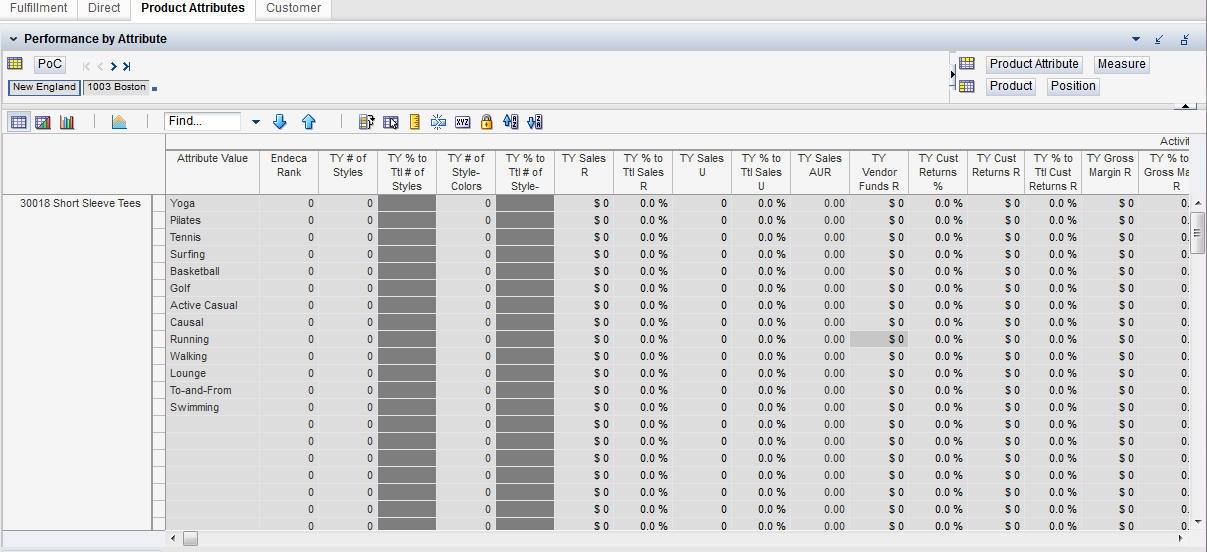
In this view, the Buyer can view historical (TY and LY) and Buy Plan Working Plan and Current Plan versions of sales, margin, returns, receipts and inventory by Product Attribute (and Endeca search results if available). This view can help identify product attribute based trends and the success of those trends, for example, evolving customer preferences by silhouette, color family, price tier, and so on.
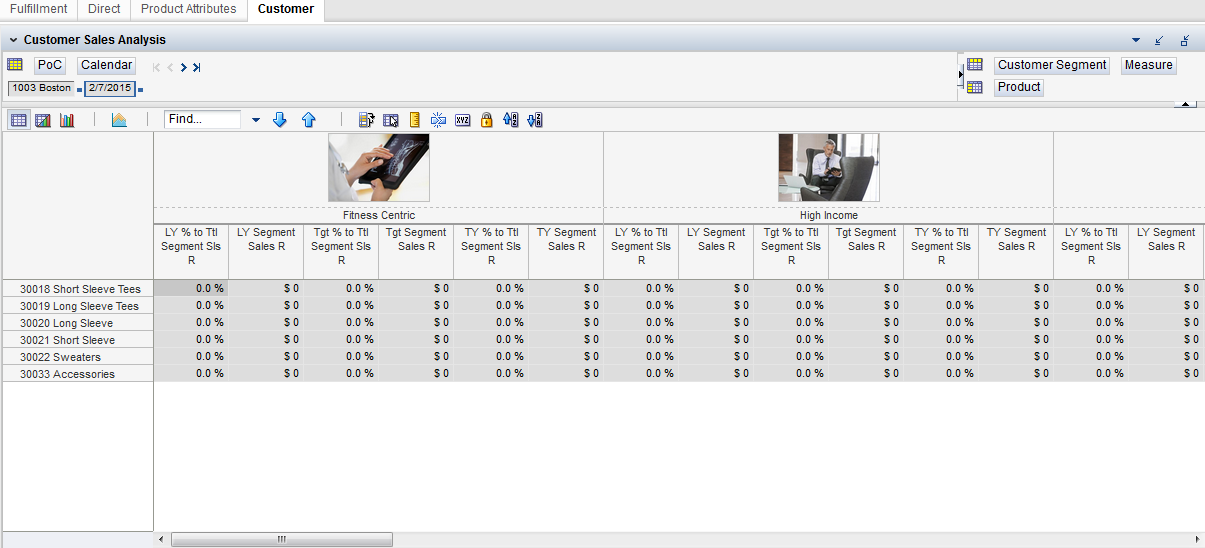
In this tab, the Buyer can view the customer segment level expectations and performance of each assortment.
The Buyer can evaluate how various trends, price tiers, and so on, have performed with each customer segment over time by comparing the current year to the prior year performance to target. The Buyer also has the ability to use this recent and prior year trend to adjust the product attribute characteristics most attractive to each customer segment. This is then used when planning future assortments, when the Shopping List and Wedge are rolled up by customer segment.
In this view, the last year, recent trend, and target performance are shown by customer segment with intersections of Product, Time, and Points of Commerce (sites, applications, and stores).
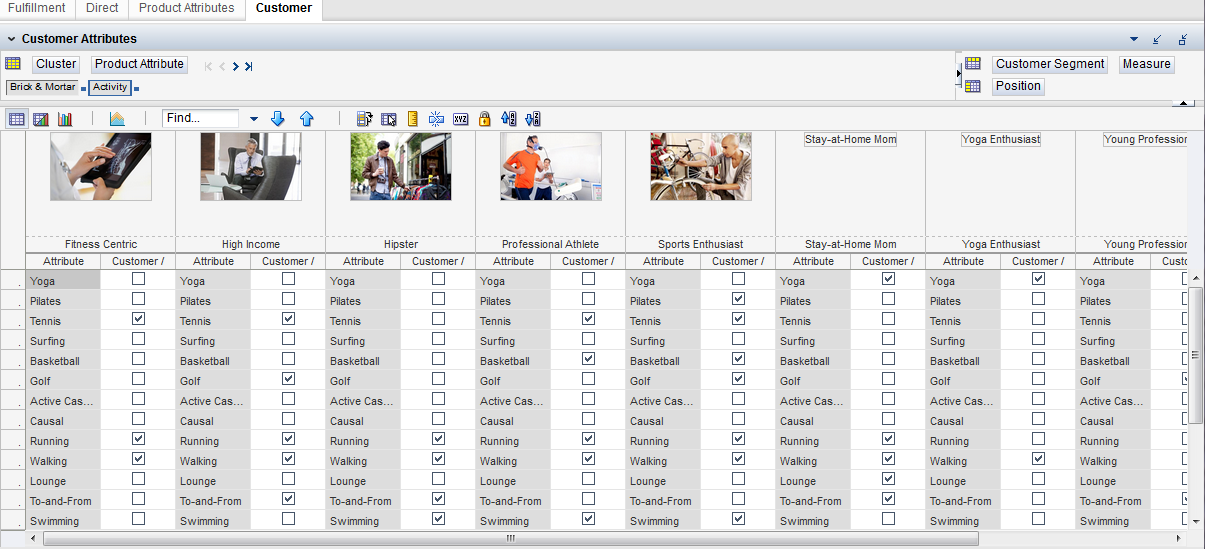
In this view, the Buyer can use the prior view to help tailor the attributes appropriate to each customer segment. These attribute choices are then used when rolling up the future assortments in the Shopping List and Wedge processes.
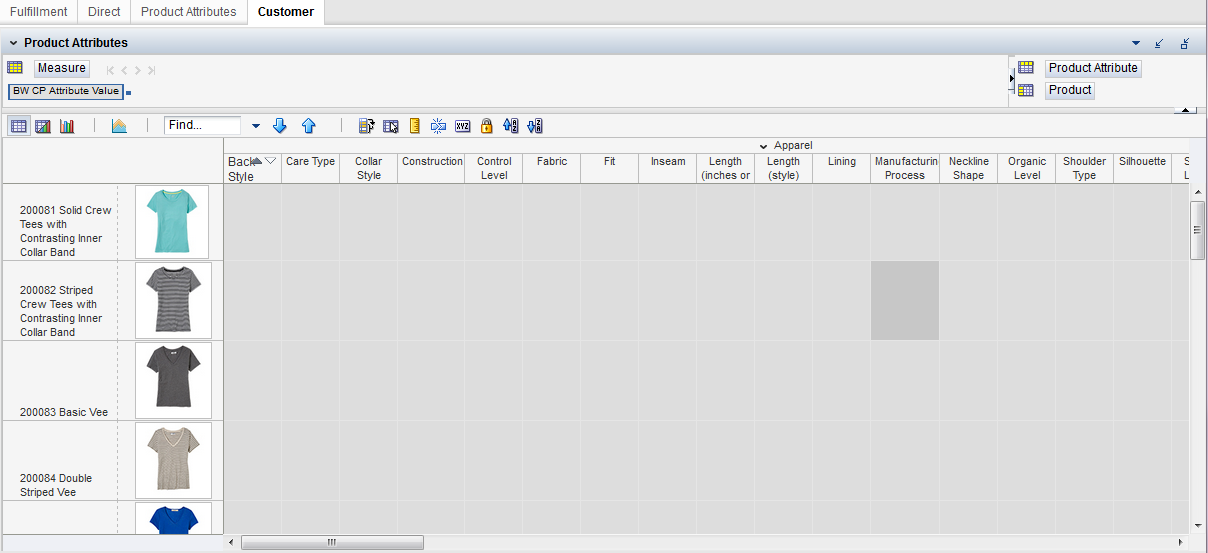
This view shows the product attributes for each style-color that were set up in the Shopping List and Fill the Wedge tasks (or loaded from an external source). These product attributes are compared to the desired attributes of each customer segment, to determine whether a given style-color is applicable to that segment.