| Oracle® Retail Merchandise Financial Planning Retail Cloud Service User Guide Release 18.0 F10757-01 |
|

 Previous |
 Next |
| Oracle® Retail Merchandise Financial Planning Retail Cloud Service User Guide Release 18.0 F10757-01 |
|
Previous |
Next |
Oracle Retail Merchandise Financial Planning Cloud Service (MFP Cloud Service) provides flexible and easy-to-use financial planning solution templates that enable retailers to create high-level strategic and low-level detailed financial plans. The solution guides users through best-practice planning processes in an efficient, streamlined manner while providing top-down and bottom-up functionality for developing, reconciling, and approving plans.
|
Note: There are two versions of MFP Cloud Service: MFP Retail Cloud Service and MFP Cost Cloud Service. This guide describes MFP Retail Cloud Service.For information about MFP Cost Cloud Service, see the Oracle Retail Merchandise Financial Planning Cost Cloud Service User Guide. |
MFP Cloud Service provides both pre-season and in-season merch planning and location planning with key financial indicators that include sales, markdowns, receipts, inventory, gross margin, and open-to-buy. MFP Cloud Service users can bring many plans together for quick and easy reconciliation and approval through consistent, disciplined processes. Furthermore, MFP Cloud Service can be used to plan for multiple retail channels including Brick & Mortar, Direct, and Wholesale/Franchise. MFP Cloud Services include the capability for both Merchandise (Merch) and Location Planning.
MFP Cloud Service enables users to perform the following tasks:
Create a financial plan in a structured way
Set and pass targets
Reconcile a plan
Submit and approve a plan
Monitor a plan
Maintain a plan
Update a plan
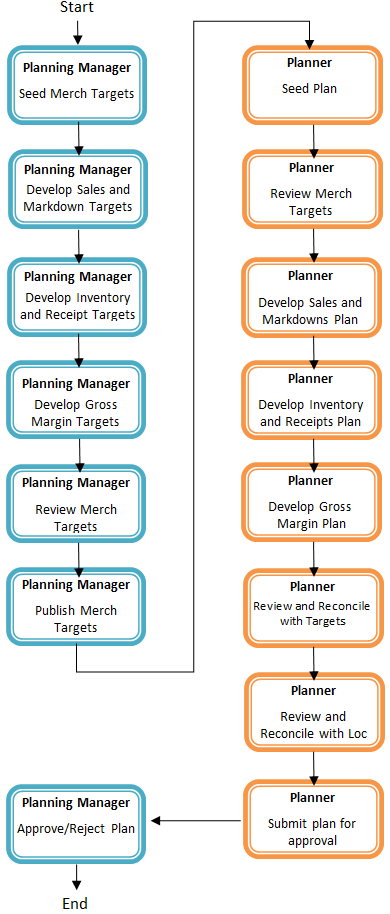
The Merch planning process can be separated into two sub-processes: pre-season and in-season planning. Creating the merchandise financial plan occurs during pre-season planning. Managing and updating the merchandise financial plan occurs during in-season planning. Pre-season planning focuses on creating the Original Plan (Op) against which to benchmark in-season progress. In the pre-season process, the plan is initialized by seeding from Last Year (Ly) or from a forecast. This seeding gives users a curve of demand against which to spread a new plan. Users then plan sales, receipts inventory, turn, and gross margin measures.
There are two types of users in merch planning:
Planning Managers. These users are planning directors or managers. They create the overall targets for the Merch Plan.
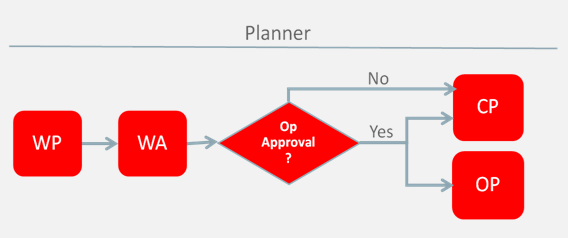
Planner. These users are the merchandise planners. They create Original Plan (Op) and Current Plan (Cp) plans for approval by the Planning Managers role.
The targets are published by superior levels to the subsequent level: Planning Managers passes targets to the Planner. The Planner then submits the Op, Cp, or both to the Planning Manager for approval. The Op and Cp plans are not created until they are approved by the Planning Manager.
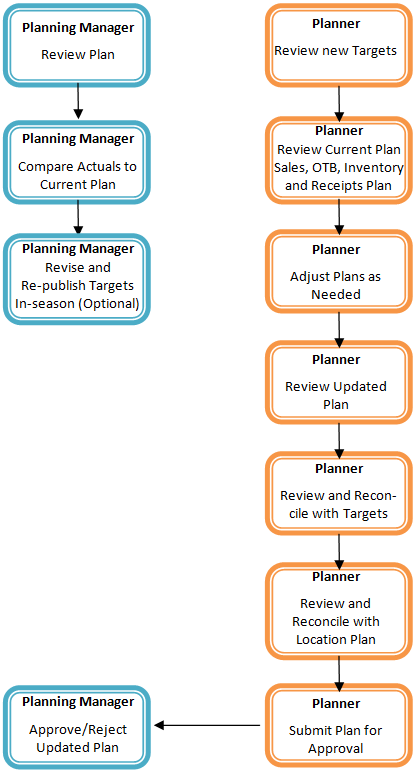
This process is shown in Figure 1-1 and Figure 1-2.
After the planning period has begun, the process of in-season planning begins. The objective of in-season planning is to track progress against the original plan in order to identify opportunity and risk for the Original Plan (Op).
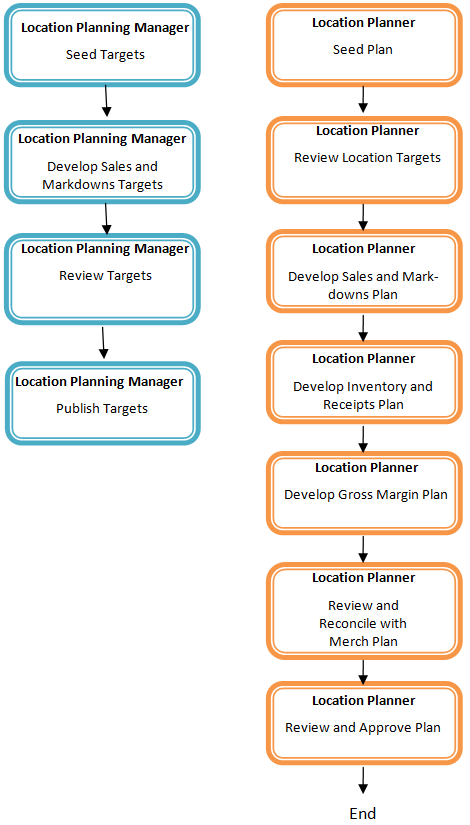
The Location Planning (LP) process is also separated into two sub-processes: pre-season and in-season planning. Creating the location plan occurs during pre-season planning. Managing and updating the location plan occurs during in-season planning. Pre-season planning focuses on creating the Original Plan (Op) against which to benchmark in-season progress. In the pre-season process, the plan is initialized by seeding from Last Year (Ly) or from a forecast. This seeding gives users a curve of demand against which to spread their new plan. Users then plan sales, receipts, inventory, turn, and gross profit measures.
There are two types of users in LP:
Location Planning Manager. This role may be performed by location planning managers or location planners, meaning that the location targets and plan may be created by the same user. This role's task is to create a target version of sales/markdowns that is corrected for non-repeating events, such as store closures, bad weather, construction, and so on, at a total company level. These are passed down as targets to the location planner.
Location Planner. This role is often performed by the same user as the merch Planner. This role's task is to create Op and Current Plans (Cp) at a lower, department level. The total sales, markdowns, and so on are planned through the use of average store metrics, using a number of user-defined hierarchies with location attributes (such as comp, volume, size, climate, and demographics).
The targets are published by superior levels to the subsequent levels: top location targets pass targets to the location plan. The location planner self-approves the Op, Cp, or both. Once the working plan is approved, it is promoted to either the Op or Cp.
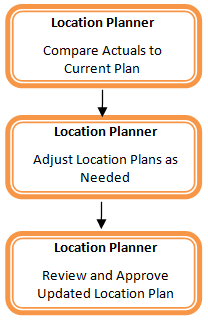
This process is shown in Figure 1-3 and Figure 1-4.
Reconciliation of targets and plans is essential in building meaningful plans that achieve the business objectives. Merch Targets and Merch Plans are brought into alignment by reconciling the target and plan using the plan comparison view. Location Targets and Location Plans align with one another through seeding the plan with the Location Target. Merch and Location Plans are brought into alignment by reconciling the plans using the provided plan comparison view.
The merch planning process involves multiple user roles. These user roles work together to pass targets and reconcile plans at different levels of the product, location, and calendar dimensions. The process of using multiple roles divides the planning process into logical sections that provide oversight to the plan creation at multiple levels.
The Manager sets targets for the Planner, both for Merchandise Financial Planning and Location Planning. The approved plans can be made visible to an item planner using a separate product, Oracle Retail Item Planning.
Planning roles serve the following purposes:
They identify the organizational level at which planning occurs.
They set the product level at which that role will plan.
They set the time period at which that role will plan.
Each role is part of a bottom-up or a top-down process (see Table 1-1). The role's base intersection defines the lowest level of product to which that role has access when building a plan. The planning role is also used to define the range of planning responsibilities and controls the measures shown in planning views along with those measures' accessibility.
While the planning roles can be customized during implementation, a standard set of planning roles is supplied with MFP Cloud Service:
Planning Manager: sets the merch targets
Planner: produces the merch plan
Location Planning Manager: sets location plan targets
Location Planner: produces the location plan.
The range of planning and the role relationships for these roles are listed in Table 1-1.
Table 1-1 Range of Planning and Role Relationships
| Role | Base Intersection | Range of Planning | Lowest-Level Time Period |
|---|---|---|---|
|
Planning Manager |
Department/Week/Channel |
Company - Department |
Week |
|
Planner |
Subclass/Week/ Channel |
Department - Subclass |
Week |
|
Location Planning Manager |
Company/Week/Location |
Channel-Location |
Week |
|
Location Planner |
Department/Week/Location |
Channel-Location |
Week |
The key components and features of MFP Cloud Service provide the basis for standard processes and activities that are necessary for planners to perform their planning functions.
Key components include:
Workspace
The primary element used in building a plan. A workspace contains one or more Views. A planner uses a workbook to build and maintain plans throughout the season.
Views
Contained within a workspace. The views contain pre-defined lists of measures and are arranged to reflect a step in the standard planning process, allowing a user to work in a logical path to build a plan.
View Data
The data displayed within a view. It is used to save, commit, and edit plan data.
Forecasting
The forecast is a future projection of sales based on historical sales.
Plan Versions
MFP Cloud Service functionally provides the capability to have more than one version of the plan. This allows users to track actual data against the original plan, update the plan for the current season, and save to a new plan.
Plan Reconciliation and Approvals
Plan reconciliation is a process of combining lower-level plans and comparing them to a higher-level target. Plan approval is a built-in application process that allows a Merch Plan role to submit a plan for approval to the Merch Targets role, who can approve or reject it.
An MFP Cloud Service user accomplishes multiple planning tasks using workspaces. A workspace consist of views and graphical charts used for planning, viewing, and analyzing data pertinent to the business. Workspaces organize related planning information and divide levels of user responsibility. This framework allows a user to easily view, create, modify, and store datasets that are common to repeated tasks.
A workspace's Segment can be built automatically, through a batch process, or manually using the Segment wizard. Each workspace contains the planning views, measures, and business rules needed for a complete plan.
A workspace structure consists of the following elements:
Product dimension and its levels such as Department, Class, and Sub-Class.
Calendar dimension and its levels such as Season, Month, and Week.
Location dimension and its levels which may reflect multiple channels within an organization at their aggregate level, such as total Brick and Mortar departments, Catalog, or e-Commerce.
Plan versions such as Working Plan (Wp), Original Plan (Op), Current Plan (Cp), and Last Year (Ly).
Metrics, called Measures, and corresponding business rules such as Sales, Receipts, and Inventory.
Data in a workbook can be displayed using both multidimensional spreadsheets and charts. The data can be viewed at a detailed level or at an aggregate level.
Planning views are multidimensional pivot tables that provide users with views of the data contained in a workbook. Oracle Retail Merchandise Financial Planning comes with a series of built-in views that support an industry-standard business process. Each view can contain its own unique product, calendar, location, and metric information. This approach enables users across an organization to use a standard planning process.
Views can be personalized for each user. Rotating, pivoting, and formatting functions allow a user to create individual views within a view. Each user can also display the data in a graphical format by using the charting functionality.
Users edit and enter data in the views. The solution's business rules are implemented throughout the views to ensure consistent edit behavior regardless of where (on which view) the edit is performed.
Users can edit data at many levels of each dimension (product, location, calendar). If the data is modified at an aggregate level (a level with one or more lower levels beneath it), the modifications are distributed to the lower levels within the dimension. This function is called spreading. If data is modified at a level that has a higher level above it (parent), the data changes are reflected in those higher levels. This is known as aggregation.
Each measure that is used in the MFP Cloud Service solution is assigned a default aggregation and spreading behavior. A measure's aggregation method controls how data is calculated at aggregate levels of the dimension, such as month or department. A measure's spread method controls how data is spread to lower levels of a dimension when the user enters data at an aggregate level. Table 1-2 provides a list of relevant aggregation and spread methods that are used in MFP Retail Cloud Service.
Aggregation Methods
Table 1-2 displays aggregation methods, their results, and their types of measures.
Table 1-2 Aggregation Methods
| Aggregation (Agg) Methods | Result | Types of Measures |
|---|---|---|
|
Total |
Values are summed up the hierarchy dimensions. |
Value or unit measures such as sales and receipts. |
|
Recalc |
Value is recalculated at aggregate levels based on its rule calculation. |
Percentage measures such as Gross Margin%. Also other calculated measures such as TO and Forward Cover. |
|
PST - Period Start Total |
Value is summed up non-calendar dimensions. Value at aggregate time equals the same value as the first child period's value belonging to the aggregate parent. |
Beginning of Period Inventory (BOP). |
|
PET - Period End Total |
Value is summed up non-calendar dimensions. Value at aggregate time equals the same value as the last child period's value belonging to the aggregate parent. |
End of Period Inventory (EOP). |
|
AMBG |
All values within and across hierarchies are equal; otherwise a ? is displayed at aggregate levels. |
Used by informational text measures, such as Event Information or pick list Approve/Reject. |
|
B_AND |
For Boolean types only referring to situations that are either true or false. Value is on or true at an aggregate level if all values below the dimension level are on. |
Boolean (check box) Submit. |
Spread Methods
Table 1-3 displays spread methods, their results, and their types of measures.
Table 1-3 Spread Methods
| Spread Methods | Result | Types of Measures |
|---|---|---|
|
Proportional |
Typically used in conjunction with Total Agg type. Value is spread proportionally to the child levels when a value is entered at an aggregate level. |
Value or unit measures such as sales and receipts. |
|
None |
The result of the edit is passed to another measure. The spread method for the measure that inherits the edit is used to spread the new value to the child levels. For example, an edit to Wp Sales var Ly R% at an aggregate level (Month) results first in the Sales R value being recalculated at the Month level, reflecting the edited percent increase over Ly Sales R. Then the new Sales R value is spread to the week level proportionally. Finally, the Wp Sales var to Ly R% is recalculated at the week level. |
Variance measures such as Wp Sales var to Ly R%, Wp Mkd var to Op R%. |
|
PS (Period Start) |
For edits at an aggregate level, the edited value is placed into the first logical child level beneath the level of the edit. For example, an edit to BOP Inv at the Month level spreads the edited BOP Inv value to the first week reporting to the Month. |
NA |
|
PE (Period End) |
For edits at an aggregate level, the edited value is placed into the last logical child level beneath the level of the edit. For example, an edit to EOP Inv at the Month level spreads the edited EOP Inv value to the last week reporting to the Month. |
Typically used in conjunction with EOP Inv, Avg Inv. |
Overriding Default Spread Methods
A measure's default spread method can be overridden on a data entry by using the override spread method function. The default spread method is overridden for that specific data edit and is not permanently changed. To use an alternate spread method, enter a number in a data cell at an aggregate level followed by an r, e, p, or d. This applies the replicate, even, proportional, or delta distribution function to spread that number to the lowest level.
|
Note: Save information in the workbook before trying these features. If the results are not satisfactory, use the Edit - Revert command to undo the changes. The Revert command resets the workbook back to its state after the last save was issued. |
Explanation of Spread Types
This section describes the following spread types.
Replicate
Even
Proportional
Delta
For each of the spread types, assume the following levels and values.
Table 1-4 Example for Spread Types
| February | Week1 | Week2 | Week3 | Week4 | |
|---|---|---|---|---|---|
|
Department1 |
570 |
155 |
170 |
100 |
145 |
|
Class1 |
120 |
20 |
20 |
40 |
40 |
|
Class2 |
100 |
25 |
25 |
25 |
25 |
|
Class3 |
200 |
100 |
50 |
20 |
30 |
|
Class4 |
150 |
10 |
75 |
15 |
50 |
Replicate
Replicate copies the entered value to all cells below the aggregate level. This method can be used for measures that have an aggregation method of Total or Recalc.
If a value is entered at more than one aggregate level (such as aggregate product and time), then the value is copied to all lower-level base cells below the aggregate time and product.
Example: Enter 50r for Feb/Department1. The values at every intersection of week and class belonging to Feb/Department1 are changed to 50. The aggregate total is then recalculated as the sum of the lower-level cells, 800. See Table 1-5 for the results.
Table 1-5 Example for Replicate Method
| February | Week1 | Week2 | Week3 | Week4 | |
|---|---|---|---|---|---|
|
Department1 |
800 |
200 |
200 |
200 |
200 |
|
Class1 |
200 |
50 |
50 |
50 |
50 |
|
Class2 |
200 |
50 |
50 |
50 |
50 |
|
Class3 |
200 |
50 |
50 |
50 |
50 |
|
Class4 |
200 |
50 |
50 |
50 |
50 |
Even
Even divides the entered value evenly to all cells below the aggregate level. This method can be used for measures that have an aggregation method of Total or Recalc.
If a value is entered at more than one aggregate level (such as aggregate product and time), then the value is copied to all lower-level base cells below the aggregate time and product.
Example: Enter 600e for Feb/Department1. The value at every intersection of week and class belonging to Feb/Department1 changes to 37.5. The aggregate total is then recalculated as the sum of the lower-level cells, 600. See Table 1-6 for the results.
Table 1-6 Example for Even Method
| February | Week1 | Week2 | Week3 | Week4 | |
|---|---|---|---|---|---|
|
Department1 |
600 |
150 |
150 |
150 |
150 |
|
Class1 |
150 |
37.5 |
37.5 |
37.5 |
37.5 |
|
Class2 |
150 |
37.5 |
37.5 |
37.5 |
37.5 |
|
Class3 |
150 |
37.5 |
37.5 |
37.5 |
37.5 |
|
Class4 |
150 |
37.5 |
37.5 |
37.5 |
37.5 |
Proportional
Proportional spreads the difference between the original and entered value to all cells below the aggregate level based on that cell's percent contribution to the original value in the edited cell. This method can be used for value or unit measures that have an aggregation method of Total.
If a value is entered at more than one aggregate level (such as aggregate product and time), then the value is copied to all lower-level base cells below the aggregate time and product.
Example: Enter 1140p for Feb/Department1. The value for every intersection of week and class belonging to Feb/Department1 doubles. The percentage contribution of the base cell to the aggregate remains unchanged. See Table 1-7 for the results.
Table 1-7 Example for Proportional Method
| February | Week1 | Week2 | Week3 | Week4 | |
|---|---|---|---|---|---|
|
Department1 |
1140 |
310 |
340 |
200 |
290 |
|
Class1 |
240 |
40 |
40 |
80 |
80 |
|
Class2 |
200 |
50 |
50 |
50 |
50 |
|
Class3 |
400 |
200 |
100 |
40 |
60 |
|
Class4 |
300 |
20 |
150 |
30 |
100 |
Delta
Delta spreads the difference between the original and entered value evenly to all cells below the aggregate level. This method can be used for value or unit measures that have an aggregation method of Total.
If a value is entered at more than one aggregate level (such as aggregate product and time), then the value is copied to all lower-level base cells below the aggregate time and product.
Example: Enter 670d for Feb/Department1. The value for every intersection of week and class belonging to Feb/Department1 increases by the same value, 100/16 or 6.25. See Table 1-8 for the results.
Two options, Save and Commit, are available to ensure that data is saved during the planning process:
Save. Data is auto-saved to a user database and does not affect the master database. This allows you to manipulate details and evaluate the impact of the changes without changing the master data. Any data saved with the auto-save option is saved to a local copy of the database. Other users are not able to view the saved data by default.
Commit. Date is saved to the master database. Data (including changed) is accessible to all users after their segments are rebuilt or refreshed.
Refresh and build are two methods for retrieving updated data from the master database to a local workbook:
Refresh. Click the refresh button to retrieve data from the master database into an existing workspace.
Build. When the user follows the wizard selection process to select the products, locations, and periods for a segment, the segment workspace is built from the most up to date data.
Throughout MFP Cloud Service, you will see standard labeling for the Unit of Measure of any given metric. The following table lists the label you will see on a measure (concatenated with other label descriptions) and what it represents.
A forecast is a projection of future sales. It can be used for planning financials and inventory. Two forecasting methods are used to generate forecasts for merchandise financial planning depending on the planned period, pre-season or in-season.
The pre-season forecast is generated using Oracle Retail's AutoES (Automatic Exponential Smoothing) method. The AutoES method evaluates multiple forecast models, such as Simple Exponential Smoothing, Holt Exponential Smoothing, Additive and Multiplicative Winters Exponential Smoothing, Croston's Intermittent Demand Model, and Seasonal Regression forecasting to determine the optimal forecast method to use for a given set of data. The accuracy of each forecast and the complexity of the forecast model are evaluated in order to determine the most accurate forecast method.
The in-season forecast is generated using Oracle Retail's Bayesian Forecasting method. Bayesian Forecasting assumes that the shape that sales takes is known, but the scale is uncertain. In Bayesian Forecasting, when sales history is unavailable, the forecast figures are equal to the financial plan figures. At this point, there is no reason to mistrust the financial plan. As point-of-sale data becomes available, the forecast is adjusted and the scale becomes a weighted average between the initial plan's scale and the scale reflected by actual sales history.
The strategic and financial planning processes supported by MFP Cloud Service use plan versions to designate different plan types that are used throughout the planning horizon. These version names and their abbreviations are used frequently in planning views (for example, to distinguish measures).
Working Plan (Wp)
The plan version that is editable for a particular pre-season or in-season period.
This plan version is used to develop and revise plan data.
Actualized data values are loaded into the Wp and Cp versions for all historical (elapsed) time periods.
Target (Tgt)
Target measures contain values set by a higher role that are then passed to a lower role. For example, the Planning Manager role passes a target plan version down to the Planner role.
Targets are created from Wp by way of the Publish Targets custom menu, which is executed by the Manager role. After the data is committed to the database, those targets become available to the Planner role.
Waiting for Approval (Wa)
A plan awaiting approval by the Planning Manager. The Planner submits Wp for approval, which copies the plan data from the Wp version to the Wa version.
The Planning Manager and Planner access the same Wa version. The Planner owns this version, and the Planning Manager reads from this version to approve or reject the plan. The Wa version is read-only for both roles.
If the plan is approved, the user must execute a copy to promote the now approved, Wa plan. A Waiting for Approval plan is promoted to either the Original Plan (Op) version, the Current Plan (Cp), or both the Op and Cp, depending on whether Op Approval is enabled by the administrator.
If the plan is rejected, the Working Plan (Wp) version is not promoted to Original Plan or Current Plan. Needed adjustments are made by the planner before the plan is resubmitted for approval.
Original Plan (Op)
A pre-season plan that has been approved and promoted from Waiting for Approval (Wa) to Original Plan (Op) version. This plan is considered the budget.
The planner's plan is the only plan that is approved and becomes the Original Plan (a manager plan becomes the Target).
All roles can view the Op version measures.
Current Plan (Cp)
Cp starts out identical to the Original Plan. Then, actual data values are loaded into the Cp (and Wp) version for historical (elapsed) time periods.
When an in-season plan has been approved, it is promoted to Cp (and not Op).
All roles can view the Cp version measures.
The planner's plan is the only one that is approved and becomes the Current Plan.
This Year (Ty)
Plan version containing the actualized data.
Actualized data is unadjusted for holiday remapping or 53rd week, and so on.
Note also that Actual values are also loaded into Cp and Wp versions for historical (elapsed) time periods.
Last Year (Ly)
A plan version that references the year prior, adjusted for holiday remapping or 53rd week, and so on. LY is always based on the working plan for the prior year mapped period. Working Plan is actualized weekly, therefore LY will reflect actual historical data when available; otherwise, it will utilize the in-flight/un-actualized Working Plan.
Last, Last Year (Lly)
Same as LY, but for 12 months prior.
The plan versions that are visible to MFP Cloud Service users depend on the users' planning roles.
The goal of plan reconciliation, an important step of the financial planning process, is to achieve a single, unified plan that all contributing parties have reviewed and approved. As plans are generated, they move through a reconciliation phase and on to the plan approval phase. Merch Plans and Location Plans are reconciled to each other, and their respective Merch Targets or Location Targets to ensure the plans meet the business objectives.