| Oracle® Retail Assortment & Item Planning for Fashion/Softlines Cloud Service User Guide Release 19.0 F24864-08 |
|

 Previous |
 Next |
| Oracle® Retail Assortment & Item Planning for Fashion/Softlines Cloud Service User Guide Release 19.0 F24864-08 |
|
Previous |
Next |
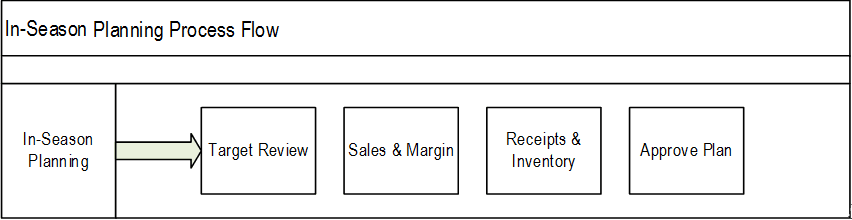
Once the assortment period has begun, in-season planning begins. The planner now uses the plan created in the Item planning process as the benchmark for successful in-season planning. To begin the in-season planning process, the planner reviews trends, ranks, and filters items by relevant KPIs, and is able to make keep/add/drop decisions based on actual performance. The planner will then review and update sales, promotions, and markdown plans based on trends. Once sales have been replanned, an updated receipt plan should be entered based on how items are performing.
Real-Time Alerts
Real-Time Alerts allow the planner to manage by exception. When dealing with large amounts of data at the Item/Location level, it can be difficult to search for and find items/locations that are performing outside of expectations. Real-Time Alerts solve that issue by highlighting the most common issues and presenting them in an actionable format for the planner to resolve. Real-Time Alerts help to simplify business processes by focusing the planner's attention on prioritized, value-based activities.
The typical business user who completes this task will be an Assortment Planner. The Planner usually will have completed the Item Planning process, and is now ready to update that plan based on actuals and trends.
Local Currency
Local Currency refers to the ability to plan in more than one currency if your business operates in multiple countries with different currencies. Multiple currencies and their exchange rates can be managed within Item Planning, allowing the planner to choose which currency they would like to plan in. Data will be stored in the one global currency, and within a segment, users can switch between currencies as business needs dictate.
Approved location clusters
Location hierarchy
Product hierarchy
Calendar hierarchy
Sales Retail, Sales Unit, and Cost actuals
Customer Returns actuals
Direct/ecommerce actuals
Item attributes and attribute values
Price elasticity entered by the Administrator
Promotional lifts entered by the Administrator
Markdown lifts entered by the Administrator
Item images loaded by the Administrator (optional)
The high-level steps to complete this process:
Review trends based on actual performance.
Replan Sales and Margin by item.
Replan receipt and inventory by item.
Review and resolve real-time alerts.
Compare the new plan to the Original Plan and to MFP.
Approve the item plan to the Current Plan.
When working in a segment, it is a common practice to keep the wizard selections for the segment size limited to what will be worked on, to facilitate navigation and increase UI responsiveness.
To create the In-Season Planning segment:
Click Assortment Services in the Task menu. Then, click the Planning Services activity and then the In-Season Planning task.
The dialog to create New Plan opens. Click Create New Plan.
Enter the Plan Label in the text field. Click Ok.
In Select Product, select one or multiple subcategories and click Next.
In Select Assortment Period, select the time period or periods for this assortment.
Multiple Assortment Periods may be brought into the segment:
The Assortment Groups visible in the wizard are pre-ranged to the subcategories selected in the previous screen.
To see the user-defined assortment information, click the Dimension tile and select Assortment Detail.
Click Finish. The In-Season Planning segment is built.
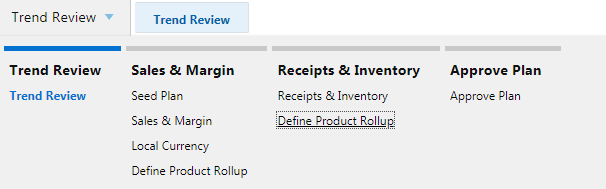
The first step in the In-Season Item Planning process is Trend Review. The planner can select KPIs to review for Season To Date (STD), which are elapsed periods and Balance to Achieve (BTA), which are the remaining unelapsed periods in the segment. Based on these trends, Keep/Add/Drop decisions can be made for existing and new items.
Prior to Starting this Step:
A pre-season Item Plan should be approved.
STD/BTA should be set up through the batch process.
After Completing this Step:
Replan sales and margin by item.
Tab and Views in this Step:
The Trend Review tab is used to analyze/review the trends and the planner can view style/color.
The Filters and Parameters view is used to select the KPIs that will be used in the Trend Analysis view.
The steps to complete this process:
In the Rank by (KPI) measure, select the KPI that you wish to review in Trend Analysis.
If checked, the Rank by Actuals Only Boolean flag measure will rank items by actual sales results only.
If left unchecked, the ranking will be based on actuals and plan.
The WP Filter On and WP Filter On (# of Items) measures default to Top and 10, which will show the top 10 items in the Trend Analysis view.
You can also choose to show the lowest ranked items by selecting Bottom from the WP Filter On measure picklist.
Click Calculate to set your selections for view in the Trend Analysis view.
Measure Table
Table 15-1 1. Filters and Parameters View Measures
| Label | Definition |
|---|---|
|
Rank By (KPI) |
Key Performance Indicators that can be used to rank items in the Trend Analysis view. |
|
Rank by Actuals Only |
When this Boolean flag is selected, the Trend Analysis view will only show Season To Date actuals. |
|
WP Filter On |
Picklist that allows the planner to select whether to rank the top or bottom items in the Trend Analysis view. |
|
WP Filter On (# of Items) |
A planner-entered number, defaulted at 10, to show the chosen number of items in the Trend Analysis view. |
Measure Profile
Default Profile
The Default profile is used to select KPIs and set parameters for review in the Trend Analysis view.
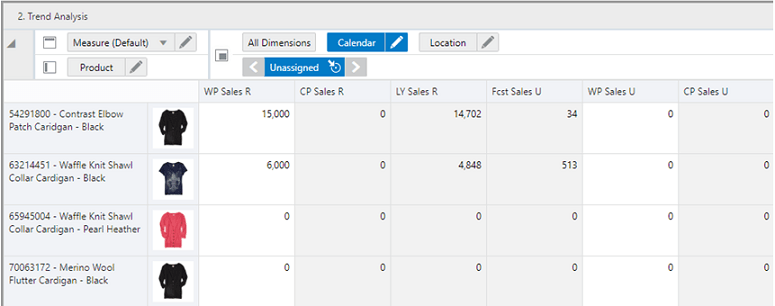
The Trend Analysis view is used to view Season To Date (STD) or Balance To Achieve (BTA) sales data to view variance to plan, as well as to facilitate focusing on exceptions through top and bottom item performance reviews.
The steps to complete this process:
Review the performance of the items by the parameter and filters that were defined in the Filters and Parameters view, using the variance measures to compare to Working Plan, Current Plan (Approved version), and LY.
Update the KPIs, filters, and parameters as necessary and review the results in the Trend Analysis view.
These reviews can be done by cluster or channel.
Measure Table
Table 15-2 2. Trend Analysis View Measures
| Label | Definition |
|---|---|
|
WP Sales R, U, ROS GM R% |
Working Plan Sales Retail, Units, Rate of Sales, and Gross Margin percent. |
|
ROS |
The weekly rate of sales for the item/cluster/calendar periods that were selected in the wizard process. |
|
Keep/Add/Drop |
Picklist measure used to make In-Season assortment changes. |
|
Keep/Add/Drop Comments |
Comments added for the status Keep/Add/Drop. |
|
CP Sales R, U, ROS, GM R% |
Current Plan Sales Retail, Units, Rate Of Sales, and Gross Margin percent. |
|
LY Sales R, U, ROS, GM R% |
Last Year Sales Retail, Units, Rate Of Sales, and Gross Margin percent. |
|
WP Sales R/U Var CP % |
Working Plan Retail, Units Variance to Current Plan. |
|
WP Sales R/U Var LY% |
Working Plan Retail, Units Variance to Last Year. |
Measure Profile
Default Profile
The Default profile is used to view trends using selected KPIs.
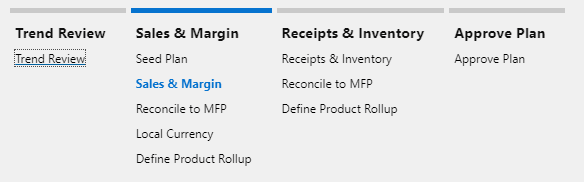
The second step in the In-Season Planning process is Sales & Margin. This step is used to assign like items, seed sales if necessary, and replan sales and margin based on actual results.
The steps to complete this process:
Define item parameters.
Replan regular, promotional, and clearance sales and margin based on actuals and updated information.
Prior to Starting this Step:
Best and worst performers should be reviewed.
Trends should be reviewed and analyzed.
After Completing this Step:
Replan receipts and inventory based on the updated sales plan.
Tabs and Views in this Step:
The Seed Plan tab is used to view and/or make Keep/Add/Drop decisions, seed sales, and assign like items.
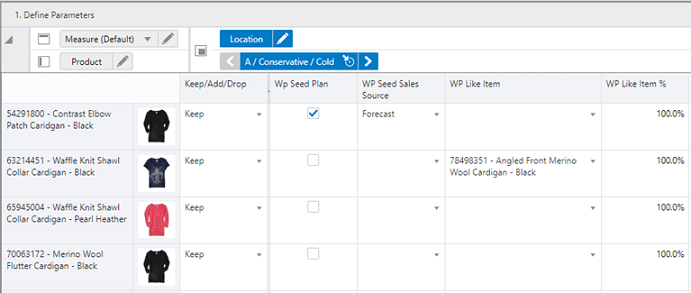
The Define Parameters view is used to review and/or make Keep/Add/Drop decisions, Seed Sales, and assign like items by location cluster. If all clusters will receive the same data, the planner can roll up to All Location in the location hierarchy.
The steps to complete this process:
In the Keep/Add/Drop picklist, review and/or make Keep/Add/Drop decisions.
If you have decided to drop an assorted item, select Wp Drop week to drop all planned metrics from that week. The execution of custom custom menu drop items clears all the data from Wp measures from the selected drop week.
If you have a new item, or an item that you would like to re-seed, check the WP Seed Sales Boolean.
If you selected the Seed Sales Boolean, select the seed source from the WP Seed Source picklist measure:
Original Plan - the source for this data is from the Item Planning approved plan. If this option is selected, all the sales metrics will be seeded from the OP measures. This also includes Receipts, Customer Returns, Transaction, and Traffic measures.
Current Plan - the source for this data is from the In-Season Planning approved plan. If this option is selected, all the sales metrics will be seeded from the CP measures. This also includes Receipts, Customer Returns, Transaction, and Traffic measures.
Forecast - the source for this data is Forecast Sales. If this option is selected, only the forecast sales will be copied to the regular sales.
Last Year - the source for this data is Last Year (if the item has data from the previous year). If this option is selected, only the total sales from last year will be copied to the regular sales. This does not include Receipts, however will include seeding of Customer Returns, Transaction, and Traffic measures.
If you want to assign a like item, in the WP Like Item measure, select the existing item to assign to the new item
Like Item CP - the source for this data is Current Plan from the selected Like Item. If this option is selected, all the sales metrics will be seeded from the CP measures. This also includes Receipts, Customer Returns, Transaction, and Traffic measures.
Like Item LY - the source for this is Last Year data from the selected Like Item. If this option is selected, only the total sales from last year will be copied to the regular sales. This does not include Receipts, however will include seeding of Customer Returns, Transaction, and Traffic measures.
In the Like Item % measure, assign an adjustment ratio for the existing item sales to be copied to the new item.
Run the Seed Plan Application Action.
Running the Seed Plan Application Action creates the following logic for each Assorted Item:
Source Sales Units are spread to week based on the source selected.
Units are multiplied by the Base Unit Price and Base Unit Cost to get Retail and Cost.
Base Unit Price and Cost are interfaced from a source system for existing items and entered by the planner for placeholder items in the Item Administration segment.
Run the Drop item Application action.
Executing the custom menu Drop Items does the following for each of the items to be dropped:
If an item status is set to drop and the Wp Drop Period is set as one of the unelapsed weeks, then the custom menu clears all Wp Planned data from the selected week for the dropped items.
If an item status is set to drop and if the Wp Drop Period is not set, a real time alert is created to notify users to select the Wp Drop Period.
If you accidently select a non-assorted item to be dropped with a Wp Drop Period, then the custom menu runs successfully. There is not any impact to the plans as there would be no plans available for the non-assorted item.
Wp plans can be cleared only for the unelapsed periods.
Note that only unelapsed periods will be updated with seeded data.
Measure Table
Table 15-3 1. Define Parameters View Measures
| Label | Definition |
|---|---|
|
Keep/Add/Drop |
Picklist measure used to make In-Season assortment changes. |
|
Wp Drop Period |
Picklist value of weeks the to determine from which week the assorted item needs to be dropped .Items can only be dropped from the unelapsed periods. |
|
WP Seed Sales |
A Boolean flag measure which is required to be checked to create a weekly sales plan for assorted items. |
|
WP Seed Sales Source |
A picklist used to select the seed source for an item's sales. |
|
WP Like Item |
An item used to populate the Sales R, U, and GM R of a new item being added to the assortment using an adjustment ratio. |
|
WP Like Item % |
Provides a facility to adjust a new item's Sales R, U and GM R by using a percentage ratio to the sales of the like item. |
|
Wp Assorted item |
Boolean measure to highlight the assorted item. |
|
Wp Assorted item count |
Integer measure to holding the count of each assorted item. |
Measure Profile
Default Profile
The Default profile is used to assign item parameters before seeding sales.
Application Action
Seed Plan
The Seed Plan Application Action populates an item's weekly sales based on the Sales Source selected.
Drop item
The Drop item Application Action drops the Wp planned sales from the selected unelapsed week.
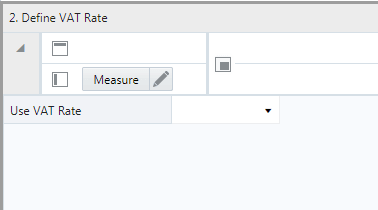
The Define VAT Rate view is used by the planner to choose the VAT Rate used for the category.
The step to complete this process:
In the Use VAT Rate picklist measure, select the appropriate VAT rate for the category.
Measure Table
Table 15-4 2. Define VAT Rate View Measure
| Label | Definition |
|---|---|
|
Use VAT Rate |
User-selected VAT rate for the category/store being planned. |
Measure Profile
Default Profile
The Default profile is used to select the appropriate VAT Rate.
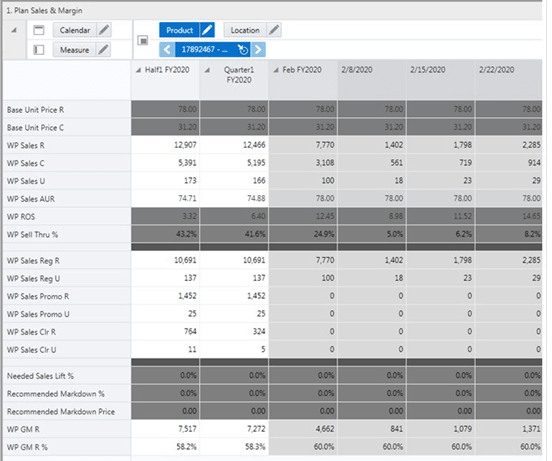
The Sales and Margin tab is used to replan regular, promotional, and clearance sales by item and cluster based on actuals and known trends. What-if promotional plans and markdown plans may be created to help the planner understand the financial impacts of different promotional and markdown scenarios. The what-if scenarios can be applied to the working plan for approval, if deemed appropriate by the planner.
The Plan Sales and Margin view is used by the planner to replan regular, promotional, and clearance sales by item and location cluster.
The steps to complete this process:
Use the each of the Real Time Alerts to identify and locate items that need immediate attention. Resolve the alerts as appropriate.
Review the Regular Sales for item/cluster/week combinations that are performing outside of expectations and make adjustments as necessary.
Adjust the Promotional and Markdown events and sales by week as necessary.
Review ROS and Sell Thru % to ensure that sales and inventory are in line with expectations.
Review the WP Sell Thru U var CP measure to understand unit variance between your WP Sell Thru and CP Sell Thru.
Review the WP Needed Sales Lift % measure to understand the sales lift % necessary to bridge the gap between your WP Sell Thru and CP Sell Thru.
Review the Recommended Markdown Price measure to understand the optimal markdown price based on elasticity, current inventory and seasonal effects.
Review the Recommended Markdown % measure that provides a simple price optimization calculation to facilitate markdown pricing decisions.
The Recommended Markdown % is used to compare against the Min/Max filter within the Define/Filter Rollup view.
Review AUC and Gross Margin measures to ensure financial viability of the plan.
Repeat this process for each item and cluster in the assortment.
Once all item/clusters/weeks have been planned, utilize the measure profiles to compare to LY, OP, and CP, as well as to reconcile to MFP.
Measure Interactions
The following logic is used when planning different types of sales:
WP Sales are the aggregation of WP Sales Reg, WP Sales Promo, and WP Clr.
Updates to WP Sales will update WP Reg Sales, WP Promo, and WP Clr Sales proportionally.
Updates to WP Sales Reg R will hold AUR and recalculate Units.
The following logic is used when planning promotions and markdowns:
If a Promotion or Markdown event is applied to a week, the predefined discount percent is applied to the WP Reg Sales and the predefined Sales Lift % is applied to WP Reg Units, which are then multiplied to calculate the WP Promo/Clr Sales Retail and Units.
Updates to WP Sales Promo Disc % or the WP Markdown % will apply the entered discount to the WP Promo/Clr Sales AUR, hold the units and recalculate WP Promo/Clr Sales Retail.
Updates to WP Sales Promo/Clr R will hold the AUR and recalculate units.
Measure Calculations
The calculations for the Sell Thru Gap and Markdown Optimization measures are shown in the following table.
Table 15-5 1. Plan Sales & Margin View Measure Calculations
| Label | Calculation |
|---|---|
|
WP Sell Thru % diff CP |
WP Sell Thru % - CP Sell Thru % |
|
Needed Sales Lift % |
WP Sell Thru U var CP / WP Sales U |
|
Recommended Markdown Price |
The maximum value of either Unconstrained Price or Inventory Constrained Price. Note that if the calculated Recommended Markdown Price is greater than the item unit price, then it will be zero. Unconstrained Price: ((Item Unit Cost * elasticity) / (elasticity - 1) ) Inventory Constrained Price: ((BOP U + Remaining Receipts U) / Seasonal Effects, -1/elasticity) Seasonal Effects (Sales Plan): WP Sales U * (WP Sales AUR, elasticity) The Item Unit Price is the current price fed from the source system. |
|
Recommended Markdown % |
(Item Unit Price - Recommended Markdown Price) / Item Unit Price Note that if the Recommended Markdown Price rounded down is zero, then the recommended markdown % will be 0%. |
Measure Table
Table 15-6 1. Plan Sales & Margin View Measures
| Label | Definition |
|---|---|
|
Fcst Sales U |
Forecasted Sales Units from RDF or RDF Lite. |
|
Base Unit Price R |
An item's retail value, which can be different by location. |
|
WP Event |
Populated after a What-if promotion or markdown event is applied after running the Apply WI Application Actions, or the planner can manually enter a value. |
|
WP Sales R, U, AUR |
The aggregation of WP Sales Reg, WP Sales Promo and WP Clr. WP Sales do not include customer returns. |
|
WP ROS |
The weekly rate of sales for the item/cluster/calendar periods that were selected in the wizard process. |
|
WP Sales Reg R, U, AUR |
Regular Sales Retail, Units, and Average Unit Retail. |
|
WP Sales Promo R, U, AUR |
Promotional Sales Retail, Units, and Average Unit Retail. |
|
WP Sales Promo Disc % |
The Promotional discount percent applied to the promotional week. |
|
WP Sales Clr R, U, AUR |
Markdown Sales Retail, Units, and Average Unit Retail. |
|
WP Markdown % |
The Markdown discount percent applied to the markdown week. |
|
Sell Thru % |
The percent of inventory that will be sold during a period, calculated as Net Sales Units / (BOP U + Receipts U). |
|
WP Sell Thru % diff CP |
WP Sell Thru % - CP Sell Thru %. |
|
Needed Sales Lift % |
The unit sales lift percent necessary to bridge the gap between your WP Sell Thru and CP Sell Thru. |
|
Recommended Markdown Price |
The recommended optimal markdown price that maximizes margin, subject to inventory constraints. The calculation is based on elasticity, current inventory and the sales plan. |
|
Recommended Markdown % |
The recommended markdown percent to maximize margin, subject to inventory constraints. |
|
WP Sales C, AUC, GM R, GM % |
Sales Cost, Average Unit Cost, Gross Margin value, and Gross Margin percent for an item. |
|
WP Sell Thru U var CP |
The BOP unit variance between your WP Sell Thru and CP Sell Thru. |
Measure Profiles
Default Profile
The Default profile is used to plan regular, promotion, and clearance sales by item and cluster.
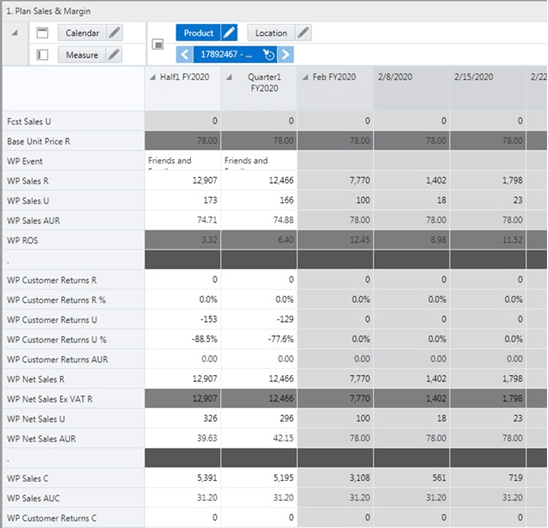
Return/Net Sales Profile
The Return/Net Sales profile is used to plan customer returns and view net sales, as well as compare the returns and net sales to last year (LY) and the Item Plan Original Plan (OP).
The steps to complete this process:
Review the seeded Customer Returns data and make adjustments by item and cluster as necessary.
Review the Net Sales data.
Net Sales = Sales - Customer Returns
Measure Table
Table 15-7 1. Plan Sales & Margin View with Returns/Net Sales Measures
| Label | Definition |
|---|---|
|
Customer Returns R, R %, U, U%, AUR, C, AUC |
Customer Returns Retail, Retail percent of WP Sales R, Units, Units percent of WP Sales U, Average Unit Retail, Cost and Average Unit Cost |
|
Net Sales R, U, AUR, C, AUC, GM R, GM % |
Net Sales = Sales - Customer Returns Net Sales Retail, Units, Average Unit Retail, Cost, Average Unit Cost, Gross Margin value and Gross Margin percent. |
Last Year Profile
The Last Year profile is used to review last year regular, promotional, and clearance data compared to the working plan.
Original Plan Profile
The Original Plan profile is used to review the most recently approved Item Plan Original Plan (OP) regular, promotional, and clearance data compared to the working plan.
Current Plan Profile
The Current Plan profile is used to review the most recently approved Item Plan Current Plan (CP) regular, promotional and clearance data compared to the working plan.
MFP vs WP Profile
The MFP vs WP profile is used to compare and reconcile the MFP Tgt to the Item Plan WP. Roll up to the Sub-class or category level to make the MFP plan visible.
MFP vs CP Profile
The MFP vs CP profile is used to compare and reconcile the MFP Tgt to the Item Plan CP. Roll up to the Sub-class or category level to make the MFP plan visible.
Simplified Sales Profile
The Simplified Sales profile focuses on WP only, for detailed review of working plan reg/ promo/ clearance and total sales measures.
Direct WP/LY Plan Profile
The Direct WP/LY profile is used to review and plan measures related to the Direct, or ecommerce business, and compare to last year.
Direct WP/CP Profile
The Direct WP/CP profile is used to review and plan measures related to the Direct, or ecommerce business and compare to the Item Plan CP.
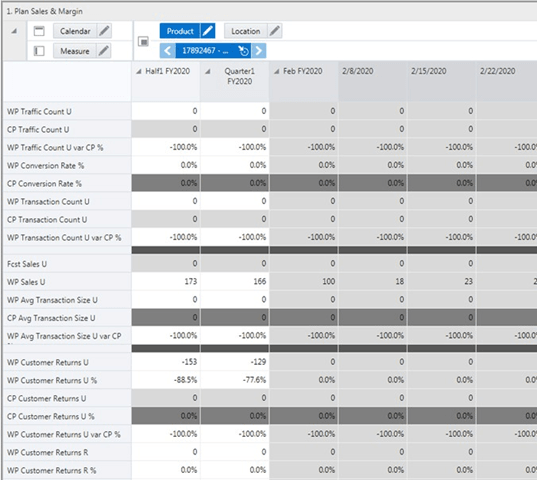
Measure Table
Table 15-8 1. Plan Sales & Margin View with Direct WP/CP Measures
| Label | Definition |
|---|---|
|
Traffic Count |
Measures the hits an item receives. |
|
Conversion Rate |
Conversion rate is calculated as Transaction Count / Traffic Count. |
|
Transaction Count |
Measures the number of transactions for an item. |
|
Avg Transaction Size |
Average Transaction Size is calculated as Sales U / Transaction Count. |
|
Customer Returns U, U %, R, R%, AUR |
Customer Returns Units, Units percent of WP Sales U, Retail, Retail percent of WP Sales R, Average Unit Retail. |
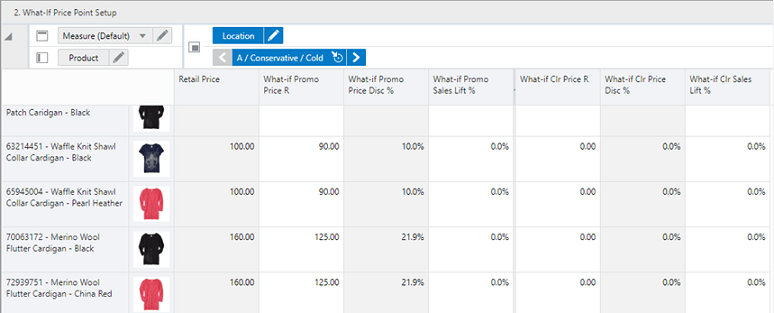
The What-If Price Point Setup View is used to define What-If price points, which will drive the what-if discount not associated to predefined events. The promotional what-if and markdown what-if capabilities are both driven by percent off; this capability is the setup view for another choice to promote or mark down by price points. Examples of price point promotions would be to promote a product from 80.00 to 49.99, or 2 for 29.99 (14.99 each). Setup entails defining the new price points and the sales lift associated with that price point.
The steps to complete this process:
For products planned to have a price point promotion, enter the What-if Promo Price R and Sales Lift % that will be used in the item plan.
For products planned to have a clearance price point, enter the What-if Clr Price R and Sales Lift % that will be used in the item plan.
Measure Table
Table 15-9 2. What-If Price Point Setup View Measures
| Label | Definition |
|---|---|
|
Retail Price |
An item's base retail price. |
|
What-if Promo Price R |
User-entered promotional price point. |
|
What-if Promo Disc % |
((Base Unit Price R - What-if Markdown Price R) / Base Unit Price R). |
|
What-if Promo Sales Lift % |
User-entered lift associated with the promotional price point. This defines how much more the product will sell than the currently planned WP sales, once the promo price is in effect. |
|
What-if Clr Price R |
User-entered clearance price point. |
|
What-if Clr Price Disc % |
((Base Unit Price R - What-if Markdown Price R) / Base Unit Price R). |
|
What-if /Clr Sales Lift % |
User-entered lift associated with the clearance price point. This defines how much more the product will sell than the currently planned WP sales, once the clearance price is in effect. |
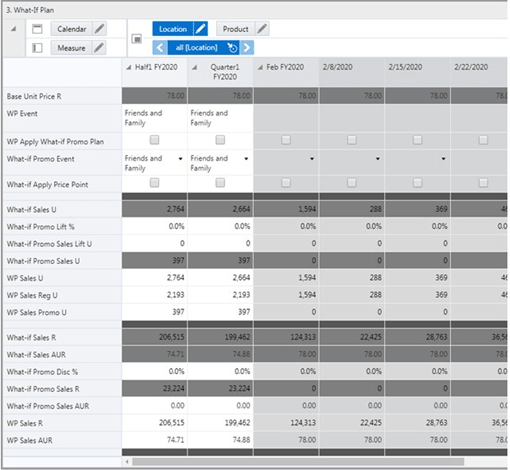
The What-If Plan view is used to perform what-if analysis with different promotions or markdowns. It allows the planner to view the sales, units and gross margin impacts if a larger or smaller promotion or markdown is taken, without changing the working plan measures. The What-if capability provides an intelligent tool for analysis; it automatically incorporates different sales lifts for different types of discounts, using either an entered lift percent or the products' elasticity (responsiveness to a discounted price). If the planner wants to apply the what-if plan to override the working plan, the Apply What-If Plan Application Action can be run to automatically copy the data to the working plan. Promotions and markdowns can be planned by item/week/location cluster or at higher levels in the hierarchy, as desired.
Item Planning provides four options to perform a what-if analysis:
By promotion event
By markdown amount
By price point
By directly entering what-if sales AUR, discount %, and/or lift %
The steps to complete this process:
Select the measure profile consistent with the type of What-If that will be performed: 1. Promotion or 2. Markdowns.
Calculate the What-If:
To What-If using an event: In the What-if Promo or Markdown Event measure, select the what-if promotion event associated with the item/week/cluster and click Calculate What-if.
The What-If Promotion or Markdown lift is calculated from Reg Sales.
To What-If using a price point: Check the What-If Apply Price Point measure for the item/week(s)/cluster and click Calculate What-if.
The What-If Promotion or Markdown lift is calculated from Reg Sales.
|
Note: When performing a What-if for Markdowns, check the What-if Apply Calc Onwards measure for the week when applying the markdown, which will apply the markdown from the current week's change to the remaining future weeks. |
Review the What-if Promo or Markdown sales measures to view the sales, unit and gross margin impact of the what-if event.
Promotion events and Markdown amounts and their associated discounts and lifts were set in the Assortment Maintenance segment and can be referenced in the Review Promotions Library or Review Markdowns Library view.
If you previously assigned an item to have a markdown, it will be visible in this view as a reference.
Review the What-if Gross Margin R, Gross Margin R%, and variance measure.
Continue making adjustments to the what-if plan until satisfied with the financial results.
Once satisfied with the what-if plan, copy it into the WP Apply What-if Promo (or Markdown) Plan measure, and check the Boolean for the item/week/cluster that a what-if markdown will occur.
Run the Apply What-If Plan Application Action to copy the what-if measure data to the WP measure data.
After running the Application Action, the what-if measure data will be cleared.
Note that if there is a business need to override the markdown discounts and lifts, use the appropriate measures in the Promotions or Markdown measure profile.
Additional platform capabilities exist which further enhance the What-If capabilities. The scenario feature of RPAS can be used to create a completely different second scenario to compare against the planned scenario, by creating a scenario and then measure profile What-if Override and following the same process as above using the (Override) measures. Details on this feature can be found in the Oracle Retail Predictive Application Server Cloud Edition User Guide.
Measure Profile
Promotions Profile
The Promotions profile is used to plan what-if promotions to assess the financial impact of different scenarios. This view offers the ability to what-if for a promotional event or promotional price point. It also provides the ability to override the promotional discount, lift, or AUR.
Measure Table
Table 15-10 3. What-If Plan with Promotions Measure Profile View Measures
| Label | Definition |
|---|---|
|
WP Event |
Populated after a What-if promotion or markdown event is applied after running the Apply What-If Application Actions, or the planner can manually enter a value. |
|
Base Unit Price R |
An item's retail value, which can be different by location. |
|
WP Apply What-if Promo Plan |
Boolean measure that when flagged and used in conjunction with the Apply WI Markdown Application Action, copies the what-if promotion plan into the working plan. |
|
What-if Promo Event |
Picklist used to select a what-if promotion event. |
|
What-if Sales U, R, AUR, C, GM R, GM R% |
The aggregation of What-if Reg, What-if Promo, and What-if Clr Sales Units, Retail, Average Unit Retail, Cost, Gross Margin value, and Gross Margin percent. |
|
What-if Sales Reg U, R, AUR |
What-if Regular Sales Units, Retail, and Average Unit Retail. If a What-if Promotion event is planned, the Regular sales will be cleared. |
|
What-if Promo Lift % |
The Promotional lift percent associated with the selected What-if Promo Event. This comes from the administration views, and can be overridden if needed. |
|
What-if Promo Sales Lift U |
The unit lift associated with the selected What-if Promo Event. This comes from the administration views, and can be overridden if needed. |
|
What-if Promo Sales R, U, AUR |
What-if Promotional Sales Retail, Units and Average Unit Retail. |
|
What-if Sales Promo Disc % |
The Promotional discount percent applied to the promotional week. |
|
Fcst Sales U |
Forecasted Sales Units from RDF or RDF Lite. |
|
WP Sales Reg U, R, AUR |
Working Plan Regular Units, Retail and Average Unit Retail. |
|
Needed Sales Lift% |
WP Sell Thru U var CP / WP Sales U. |
|
Recommended Markdown Price |
The maximum value of either Unconstrained Price or Inventory Constrained Price. Note that if the calculated Recommended Markdown Price is greater than the item unit price, then it will be zero. Unconstrained Price: ((Item Unit Cost * elasticity) / (elasticity - 1)) Inventory Constrained Price: ((BOP U + Remaining Receipts U) / Seasonal Effects, - 1/elasticity) Seasonal Effects (Sales Plan): WP Sales U * (WP Sales AUR, elasticity) The Item Unit Price is the current price fed from the source system. |
|
Recommended Markdown % |
(Item Unit Price - Recommended Markdown Price) / Item Unit Price Note that if the Recommended Markdown Price rounded down is zero, then the recommended markdown % will be 0%. |
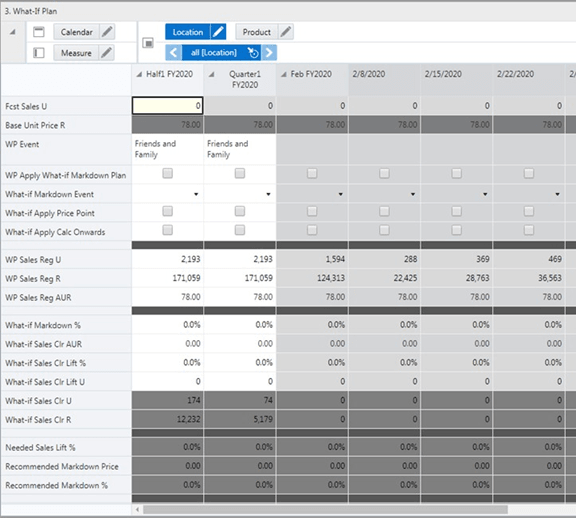
Markdowns Profile
The Markdowns profile is used to plan what-if markdowns to assess the financial impact of different scenarios. This view offers the ability to what-if for a markdown event or price point. It also provides the ability to override the markdown discount, lift or AUR. As markdowns are permanent (do not end), the planner should check the What-if Apply Calc Onwards measure for the week when applying the markdown, which will apply the markdown from the current week's change to the remaining future weeks.
Measure Table
Table 15-11 3. What-If Plan with Markdowns Measure Profile Measures
| Label | Definition |
|---|---|
|
WP Event |
Populated after a What-if promotion or markdown event is applied after running the Apply WI Application Actions, or the planner can manually enter a value. |
|
Base Unit Price R |
An item's retail value, which can be different by location. |
|
WP Apply What-if Markdown Plan |
Boolean measure that when flagged and used in conjunction with the Apply WI Markdown Application Action, copies the what-if promotion plan into the working plan. |
|
What-if Markdown Event |
Picklist used to select a what-if promotion event. |
|
What-if Apply Price Point |
Boolean measure that when flagged will apply the price point associated with the product. This price point is established by the planner in the 2. What-if Price Point Setup view. |
|
What-if Sales U, R, AUR, C, GM R, GM % |
The aggregation of What-if Reg, What-if Promo, and What-if Clr Sales Units, Retail, Average Unit Retail, Cost, Gross Margin value and Gross Margin percent. |
|
What-if Sales Reg U, R, AUR |
What-if Regular Sales Units, Retail, and Average Unit Retail. If a What-if Clearance event is planned, the Regular sales will be cleared. |
|
What-if Clr Lift % |
The clearance lift percent associated with the selected What-if Promo Event. This comes from the administration views, and can be overridden if needed. |
|
What-if Clr Sales Lift U |
The unit lift associated with the selected What-if Markdown Event. This comes from the administration views, and can be overridden if needed. |
|
What-if Clr Sales U, R, AUR |
What-if Clearance Sales Retail, Units, and Average Unit Retail. |
|
What-if Apply Calc Onwards |
If this is checked, the markdown change will apply from the current week's change to the remaining future weeks. This is provided so that the planner has the option to apply markdown clearance across multiple weeks without having to manually edit each week. |
|
Fcst Sales U |
Forecasted Sales Units from RDF or RDF Lite. |
|
WP Sales Reg U, R, AUR |
Working Plan Regular Units, Retail and Average Unit Retail. |
|
Needed Sales Lift% |
WP Sell Thru U var CP / WP Sales U. |
|
Recommended Markdown Price |
The maximum value of either Unconstrained Price or Inventory Constrained Price. Note that if the calculated Recommended Markdown Price is greater than the item unit price, then it will be zero. Unconstrained Price: ((Item Unit Cost * elasticity) / (elasticity - 1)) Inventory Constrained Price: ((BOP U + Remaining Receipts U) / Seasonal Effects, - 1/elasticity) Seasonal Effects (Sales Plan): WP Sales U * (WP Sales AUR, elasticity) The Item Unit Price is the current price fed from the source system. |
|
Recommended Markdown % |
(Item Unit Price - Recommended Markdown Price) / Item Unit Price Note that if the Recommended Markdown Price rounded down is zero, then the recommended markdown % will be 0%. |
Application Actions
Calculate What-If
The Calculate What-If Application Action is used to calculate the effect of potential markdowns or promotions on the selected products. The Calculate What-If Application Action will calculate the new unit and retail sales and margin, after considering the discount applied and the elasticity (sales lift) that correlates to the selected discount. This also allows the What-if Promo Sales AUR, Promo Disc %, and Promo Lift % to be editable. After running the Application Action, What-if measure data will be populated with the calculated effect.
Apply What-If Plan
The Apply What-If Plan Application Action is used to copy what-if promotion measure data into the working plan measures. After running the Application Action, what-if promotion measure data will be cleared.
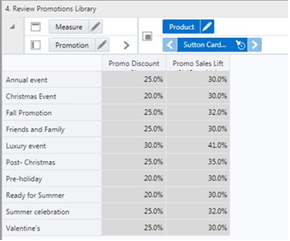
The Review Promotions Library view is a reference-only view used to review the planned promotional discounts and the associated sales lifts that are expected with each promotion event that was set up in Promotion and Markdown Maintenance.
The step to complete this process:
Review the promotional discounts and their associated sales lifts by promotion event and Sub-class, as necessary.
Measure Table
Table 15-12 4. Review Promotions Library View Measures
| Label | Definition |
|---|---|
|
Promo Discount % |
The planned discount percentage of the promotion. |
|
Promo Sales Lift % |
The percent of increased sales that must occur to overcome the decrease in price to sell the same dollar amount. The lift in this measure is automatically calculated from the Planned Promo Discount % measure after calculating. If an override is used, it will take the place of the system-calculated value in the Item Planning segments. |
Measure Profile
Default Profile
The Default profile is used to view each promotion event and its related discount and sales lift percent.
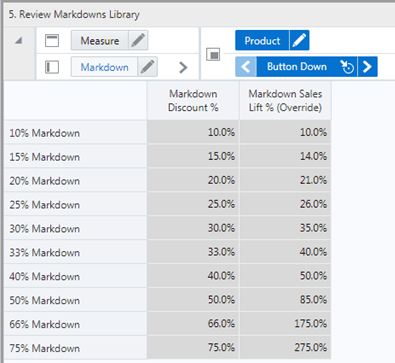
The Review Markdowns Library view is a reference-only view used to review the planned markdown discounts and the associated sales lifts that are expected with each markdown event that was set up in Promotion and Markdown Maintenance.
The step to complete this process:
Review the markdown discounts and their associated sales lifts by markdown event and Sub-class, as necessary.
Measure Table
Table 15-13 5. Review Markdowns Library View Measures
| Label | Definition |
|---|---|
|
Markdown Discount % |
The planned markdown elasticity percentage. |
|
Markdown Sales Lift % |
The markdown sales lift based on the planned markdown elasticity for the event and Sub-class. If an override is used, it will take the place of the system-calculated value in the Item Planning segments. |
Measure Profile
Default Profile
The Default profile is used to view each markdown event and its related discount and sales lift percent.
This tab is used to reconcile the working plan with MFP Targets and review in order to approve the item plan.
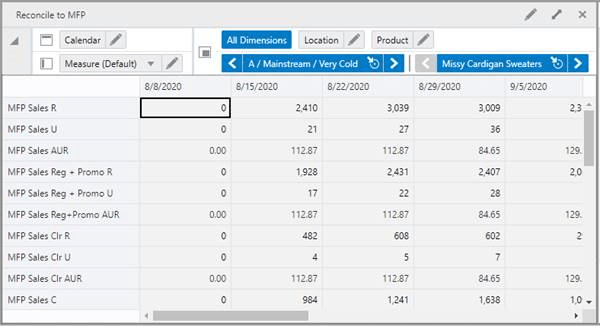
The Reconcile to MFP view is used by the planner to compare the working plan of the item plan to the approved MFP Current Plan (MFP Tgt) for each Sub-class and cluster.
The steps to complete this process:
Review WP Sales var MFP Tgt % measures to identify variances that are outside of acceptable parameters.
Review Sales R, Sales U, Sales C, and GM variances to ensure that all of the financials meet targets.
Make adjustments to the sales and the receipt plans to be within an acceptable variance.
Repeat this process for each Sub-class and cluster in the assortment.
Note that if a Location Plan is not available, the MFP CP view displays the MFP Current Plan by Sub-class spread to Location using last year's location sales' proportionality. If a Location Plan is available, the MFP CP view displays the MFP Current Plan by Sub-class spread to Location using the Location Plan CP sales' proportionality.
Measure Table
Table 15-14 Reconcile to MFP View Measures
| Label | Definition |
|---|---|
|
MFP Sales R, U, AUR, C, AUC, GM R, GMR% |
MFP Sales Retail, Units, Average Unit Retail, Cost, Average Unit Cost, Gross Margin value, Gross Margin percent. |
|
MFP Sales Reg + Promo R, U, AUR |
MFP Full price Sales Retail, Units, Average Unit Retail. |
|
MFP Sales Clr R, U, AUR |
MFP Clearance Retail, Units, Average Unit Retail. |
|
WP Sales R, U, AUR, C,AUC, GM R, GM R% |
IP Working Plan Retail, Units, Average Unit Retail, Cost, Average Unit Cost, Gross Margin value, Gross Margin percent. |
|
WP Sales Reg+Promo R, U, AUR |
IP Working Plan Full Price Retail, Units, Average Unit Retail. |
|
WP Sales Clr R, U, AUR |
IP Working Plan clearance Retail, Units, Average Unit Retail. |
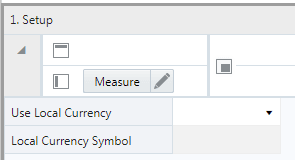
This tab is used to set up local currency.
Process Extension
If your business is using the local currency function, follow this process:
Go to the Local Currency tab and Setup view and select the currency you wish to plan in from the Use Local Currency measure picklist.
Run the Convert Local Currency Application Action.
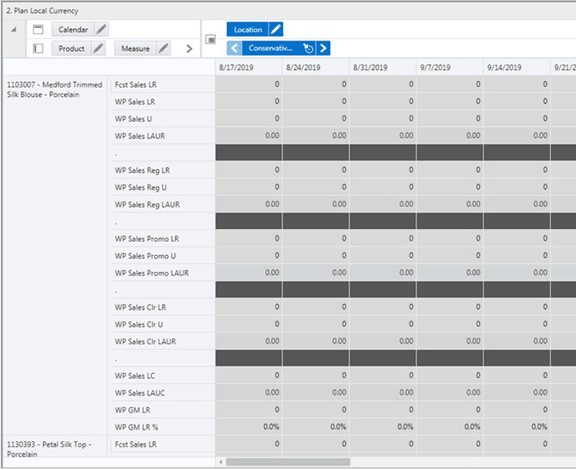
Go to the Plan Local Currency view to plan item level sales in the local currency.
Note that local currency is denoted by an L in the measure name to indicate Local Currency, for example WP Sales LR.
This view is used to select the currency you wish to plan in from the Use Local Currency measure picklist.
Local Currency refers to the ability to plan in more than one currency if your business operates in multiple countries with different currencies. Multiple currencies and their exchange rates can be managed within Assortment Planning, allowing the planner to choose which currency they would like to plan in. Data will be stored in the one global currency, and within a workbook, users can switch between currencies as business needs dictate.
This tab is used to select item attributes to view in an alternate hierarchy.
The Define Filter/Rollup view is used to select item attributes to view in an alternate hierarchy. This is available in views that display the item level. For example, if you select Color as a product attribute, in the Create and Review Assortment steps, you can click the Product Hierarchy tile to select the attribute as an alternate hierarchy, and view the proposed assortment by Black, Red, Navy, and so on. This allows you to roll up your items by different attributes to analyze and review the proposed assortment based on important attributes. You may select one attribute at a time from the alternate hierarchy.
The steps to complete this process:
Select up to three dynamic product attributes from the picklist.
Run the Refresh Attributes Rollup Application Action.
To set a filter:
In the Filter Items By measure picklist, select the real-time alert to filter by.
Click Calculate.
Go to a view that shows item level and has the Filter function available. Click Filter.
Measure Table
Table 15-15 Define Filter/Rollup View Measures
| Label | Definition |
|---|---|
|
Product Attribute 1, 2, 3 |
Picklist to present product attributes for a dynamic product hierarchy rollup. |
|
Location Attribute 1, 2, 3 |
Picklist to present location attributes for a dynamic product hierarchy rollup. |
|
Filter Items By |
Picklist used to select a real-time alert to filter items. |
Measure Profile
Default Profile
The Default profile is used to select dynamic product attributes and filter items.
Application Action
Refresh Product Rollup
The Refresh Product Rollup Application Action creates dynamically updated alternate hierarchies based on user defined attribute selections. After running the Application Action, the user may select the alternate product hierarchy to see rollups based on the attribute selections.
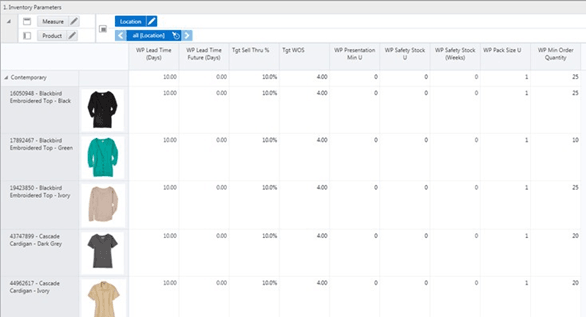
The third step in the In-Season Planning process is Receipts & Inventory. This step is used to define parameters for use in Real Time Alerts, replan receipts based on the updated sales plan, validate open-to-buy, and review and resolve Real Time Alerts. Note that Net Sales are used for the sales plan.
The steps to complete this process:
Review and update inventory parameters for use in inventory-driven Real Time Alerts, if necessary.
Adjust receipts and inventory based on the updated sales plan, in the context of the plan and/or open to buy.
Review and resolve Real Time Alerts.
Reconcile the plan to MFP.
Prior to Starting this Step:
Sales and margin should be replanned based on actuals and trends.
After Completing this Step:
Approve the updated sales and inventory plan to CP.
Tabs and Views in this Step:
Application Actions
Round Receipts
The Round Receipts Application Action uses the inputs of WP Pack Size U and WP Min Order Quantity to round receipts up to match these parameters.
Refresh Product Rollup
The Refresh Product Rollup Application Action creates dynamically updated alternate hierarchies based on user defined attribute selections. After running the Application Action, the user may select the alternate product hierarchy to see rollups based on the attribute selections.
This tab is used for receipts and inventory.
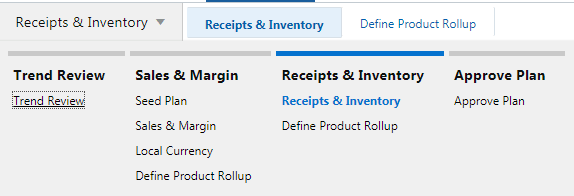
The Inventory Parameters view is used by the planner to update and assign inventory and receipt parameters if they have changed from the Item Pre-Season settings, or for new items for each location cluster.
The steps to complete this process:
In the WP Lead Time (Days) measure, enter the number of days it takes for product to arrive from your vendor/supplier to the warehouse or store.
This measure is used to generate the Immediate Need Real Time Alert, letting you know that your EOP is below your Safety Stock.
In the WP Lead Time Future (Days) measure, enter the number of buffer days it takes for product to arrive from your vendor/supplier to the warehouse or store.
This measure is used to generate the Lead Time Future Need Real Time Alert, letting you know that your future EOP is below your Safety Stock.
In the TGT Sell Thru % measure, enter the targeted Sell Thru %.
This measure is used to generate the Sell Thru Warning Real Time Alert, letting you know that your Sell Thru is higher or lower than your targeted Sell Thru.
In the TGT WOS measure, enter the targeted Weeks of Supply.
This measure is used to generate the Overage Real Time Alert, letting you know that your WOS is higher than your targeted WOS.
In the WP Presentation Min U measure, enter the minimum amount of inventory on the sales floor per store.
In the WP Safety Stock U measure, enter the quantity of units that should be maintained to mitigate the risk of stock-outs.
Use this measure if you know that a certain unit quantity should be kept on hand for safety stock.
It is recommended to use Safety Stock U or Safety Stock (Weeks), not both, as they are both used to generate a recommended initial buy and used in Real Time Alerts.
In the Safety Stock (Weeks) measure, enter the number of weeks of sales that the safety stock should cover.
Use this measure to use future weeks of sales to generate a dynamic safety stock recommendation. It is recommended to use Safety Stock U or Safety Stock (Weeks), not both, as they are both used to generate a recommended initial buy and used in Real Time Alerts.
In the WP Pack Size U measure, enter how many items come in a pack.
This measure is used in conjunction with the Round Receipt Application Action to round receipts up to the pack size entered.
For example, if your pack size is 10 and your receipts are 88, it will round up to 90 to meet the pack size.
In the WP Min Order Quantity measure, enter a minimum order quantity.
This measure is used in conjunction with the Round Receipt Application Action to round receipts up to the minimum order quantity entered.
For example, if your minimum order quantity is 100 and your receipts are 88, it will round up to 100.
Click Calculate.
Run the Round Receipts Application Action to round receipts using the Pack Size and/or Min Order Quantity measure inputs.
Review your WP EOP, WP WOS and WP Sell Thru % after running the Round Receipts Application Action to ensure that you are not over-inventoried due to rounding up.
Measure Table
Table 15-16 1. Inventory Parameters View Measures
| Label | Definition |
|---|---|
|
WP Lead Time (Days) |
The number of days it takes for product to arrive from your vendor/supplier to the warehouse or store, used in the Immediate Need Real Time Alert. |
|
WP Lead Time Future (Days) |
The number of buffer days it takes for product to arrive from your vendor/supplier to the warehouse or store, used in the Lead Time Future Need Real Time Alert. |
|
TGT Sell Thru % |
The planner entered targeted Sell Thru % by item/cluster, used in the Sell Thru Warning Real Time Alert. |
|
TGT WOS |
The planner entered targeted WOS by item/cluster, used in the Overage Real Time Alert. |
|
WP Presentation Min U |
The minimum amount of inventory on the sales floor per store, used in the Inventory Threshold Real Time Alert. |
|
WP Safety Stock U |
Unit quantity maintained to mitigate the risk of stockouts. It is used for the initial buy as well as for subsequent receipt drops, as well as used in the Inventory Threshold, Immediate Need, and Lead Time Future Need Real Time Alerts. |
|
WP Safety Stock (Weeks) |
The number of future weeks of sales that additional units should be maintained to mitigate the risk of stockouts, based on future sales weeks. It is used for the initial buy as well as for subsequent receipt drops as well as used in the Inventory Threshold, Immediate Need, and Lead Time Future Need Real Time Alerts. |
|
WP Pack Size U |
The number of units that come in a pack, used to round up receipts. |
|
WP Min Order Quantity |
The minimum order quantity, used to round up receipts. |
Measure Profile
Default Profile
The Default profile is used to update receipt parameters.
Application Action
Round Receipts
The Round Receipts Application Action uses the inputs of WP Pack Size U and WP Min Order Quantity to round receipts up to match these parameters.
The Plan Receipts & Inventory view is used by the planner to readjust the receipt plan to meet sales trends based on business knowledge or constraints.
The steps to complete this process:
Review the WP Receipts U and make adjustments to quantities or delivery weeks based on business knowledge and the updated sales plan.
Review the WP EOP U to ensure there are not over or under stock issues.
If the receipt plan does not support the sales plan, a Real Time Alert will be activated to alert you that action is needed.
The What-If Cover Weeks measure can be used to enter a number of weeks that receipts must cover sales, based on the sales plan and current week BOP.
For example, if you enter 3, the system will look at 3 future weeks of sales and subtract this week's planned sales, this week's BOP and any planned Safety Stock U.
The resulting receipt unit need will populate the What-if Receipts U measure.
The Needed Inventory U measure compares the WP EOP with Safety Stock U. If WP EOP is less than Safety Stock U, the measure will populate with the unit amount needed to be above the Safety Stock threshold.
Review the WP WOS to view the calculated Weeks of Supply based on the sales and receipt plan.
The WP WOS metric represents the number of future calendar positions that the current stock will cover. For example, If your calendar is aggregated to month, then WP WOS represents the future number of months that the stock will cover, if the calendar is aggregated to quarter, then it represents the number of quarters that the stock will cover.
The WP WOS Weeks metric represents the inventory available to cover the future weeks at week level irrespective of the calendar level selected.
For each week, WOS is calculated as the number of future weeks of sales covered by the current period's EOP U.
Review the WP Sell Thru % as a reference value to see how fast inventory is projected to sell through.
For each week, Sell Thru % is calculated as Net Sales Units / (BOP U + Receipts U).
Review the Cost measures.
Repeat this process for each item and cluster in the assortment.
Once all item/clusters have been planned, utilize the measure profiles to compare to LY, OP, and CP, as well as to reconcile to MFP.
Note that you can use Product Attributes to roll up your items by attributes. For example, this can be used to view inventory levels by attributes that are important to the category, to make sure that receipts are invested for important attributes.
Measure Table
Table 15-17 2. Plan Receipts & Inventory View Measures
| Label | Definition |
|---|---|
|
WP Event |
Populated after a What-if promotion or markdown event is applied after running the Apply WI Application Actions, or the planner can manually enter a value. |
|
WP BOP U, C, AUC |
The calculated Beginning of Period Units, Cost, and Average Unit Cost. |
|
WP Net Sales U, C, AUC |
Net Sales = Sales - Customer Returns Working Plan Net Sales Units, Cost, and Average Unit Cost. |
|
WP Receipts U, C, AUC |
Working Plan Receipts Units, Cost, and Average Unit Cost. |
|
WP EOP U, C, AUC |
The Working Plan calculated End of Period Units, Cost and Average Unit. |
|
What-If Cover Weeks |
The what-if number of weeks that receipts must cover based on the sales plan and current week BOP, used to populate the What-If Receipts U measure. |
|
What-If Receipts U |
The receipt units needed to cover the planner entered What-If Cover Weeks, based on the future sales, current BOP and Safety Stock U. |
|
Needed Inventory U |
Compares the WP EOP with Safety Stock U; if WP EOP is less than Safety Stock U, then the measure will populate with the unit amount needed to be above the Safety Stock threshold. |
|
WP WOS |
The number of future weeks of sales that will be covered by the current week's EOP U for the calendar level selected. |
|
WP WOS Weeks |
The number of future weeks of sales that will be covered by the current week's EOP U at the week level |
|
WP Sell Thru % |
The Working Plan percent of inventory that will be sold during a period, calculated as Net Sales Units / (BOP U + Receipts U). |
|
On Order U, C, AUC |
On Order Units, Cost, and Average Unit Cost. |
Real Time Alerts
Inventory Threshold
The alert will activate when current week EOP units fall below Pres Min, Safety Stock U, and Safety Stock (Weeks) measures. This alert is used in the Item Planning and In-Season Planning segments.
Immediate Need
The alert will activate when current week EOP units fall below Safety Stock U + Lead Time Days for an item/cluster/week. Note that lead time days are converted to week. This alert is used in the In-Season Planning segment.
Lead Time Future Need
The alert will activate when current week EOP units fall below Safety Stock U + Lead Time Days + Lead Time Future Days for an item/cluster/week. Note that lead time days are converted to week. This alert is used in the In-Season Planning segment.
Overage
The alert will activate when WP WOS between current week and current week + WP Lead Time Days is greater than the TGT WOS, and there are non-zero values in Receipt U or On Order U from current week + WP Lead Time Days for an item/cluster/week. This alert is used in the In-Season Planning segment.
On Order Reconciliation
The alert will activate when WP On Order U is greater than zero and does not match WP Receipt U for an item/cluster/week. This alert is used in the In-Season Planning segment.
Sell Thru Warning
The alert will activate green when WP Sell Thru % is higher than the planner entered TGT Sell Thru % and activate yellow when the WP Sell Thru % is lower than the TGT Sell Thru % for an item/cluster/week. This alert is used in the In-Season Planning segment.
Measure Profiles
Default Profile
The Default profile is used to plan weekly receipts to cover the sales plan based on the updated sales plan EOP inventory objectives.
Last Year Profile
The Last Year profile is used to compare the WP weekly receipts and inventory levels to last year values.
Original Plan Profile
The Original Plan profile is used to compare the WP weekly receipts and inventory levels to an approved Original Plan.
Current Plan Profile
The Current Plan profile is used to compare the WP weekly receipts and inventory levels to an approved Current Plan.
MFP vs WP Profile
The MFP vs WP profile is used to compare and reconcile the MFP Tgt to the Item Plan WP. Roll up to the Sub-class or category level to make the MFP plan visible.
MFP vs CP Profile
The MFP vs CP profile is used to compare and reconcile the MFP Tgt to the Item Plan CP. Roll up to the Sub-class or category level to make the MFP plan visible.
Application Action
Refresh Product Rollup
The Refresh Product Rollup Application Action creates dynamically updated alternate hierarchies based on user defined attribute selections. After running the Application Action, the user may select the alternate product hierarchy to see rollups based on the attribute selections.
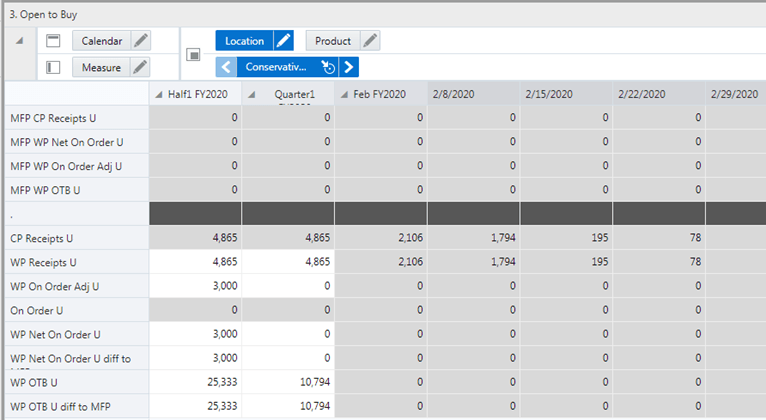
The Open to Buy view is used by the planner to set the BOP and EOP Units by setting values for Sales, Receipts and On Order Units. Thus, it decides how many units are Open to Buy (OTB).
The step to complete this process:
Set Sales, Receipts, On Order Units for each location.
Measure Table
Table 15-18 3. Open to Buy View Measures
| Label | Definition |
|---|---|
|
CP/WP BOP U |
Current Plan/Working Plan Units available at the Beginning of Period. |
|
CP/WP Net Sales U |
Current Plan/Working Plan Net Sales Units. |
|
CP/WP Receipts U |
Current Plan/Working Plan Receipts Units. |
|
On Order U |
On Order Units. |
|
WP On Order Adj U |
User-entered measure to plan updates to future weeks where Open To Buy needs to be updated to achieve the inventory plan, either due to high or low planned/ projected EOP. |
|
WP Net On Order U |
Read-only measure, calculated as WP On Order U + WP On Order Adj U. |
|
CP/WP EOP U |
Current Plan/Working Plan Units available at the End Of Period. |
|
WP OTB U |
Open to Buy Units, calculated as: CP EOP U - WP EOPU + WP Receipts U - WP Net On Order U. Elapsed periods are always 0. |
Measure Profiles
Default Profile
The Default Profile is used to gather information about the Open to Buy Units available based on BOP and EOP Units. All currency-related measures are reported in Retail in this profile.
OTB Cost Profile
The OTB Cost Profile is used to gather information about the Open to Buy Units available based on BOP and EOP Units. All currency-related measures are reported in Cost in this profile.
Reconcile to MFP Profile
The Reconcile to MFP Profile is used to compare OTB factors of the WP to MFP at the subclass/ cluster/ week level. All currency-related measures are reported in Retail in this profile.
Reconcile to MFP Cost Profile
The Reconcile to MFP Profile is used to compare OTB factors of the WP to MFP at the subclass/ cluster/ week level. All currency-related measures are reported in Cost in this profile.
This tab is used to select item attributes to view in an alternate hierarchy.
The Define Filter/Rollup view is used to select item attributes to view in an alternate hierarchy. This is available in views that display the item level. For example, if you select Color as a product attribute, in the Create and Review Assortment steps, you can click the Product Hierarchy tile to select the attribute as an alternate hierarchy, and view the proposed assortment by Black, Red, Navy, and so on. This allows you to roll up your items by different attributes to analyze and review the proposed assortment based on important attributes. You may select one attribute at a time from the alternate hierarchy.
The Filter Items By picklist allows you to select one of the Real-Time Alerts and use it to filter the items on each view. One filter may be used at a time in the segment.
The Filter Markdown % Max and Min measures can be used to enter maximum and/or minimum markdown percents used to filter items within the segment.
The steps to complete this process:
Select up to three dynamic product attributes from the picklist.
Run the Refresh Attributes Rollup Application Action.
To view the product attribute:
In a view that displays item level, click the Product Hierarchy tile.
Select the attribute that you want to view in the alternate hierarchy.
Click OK.
To set a filter:
In the Filter Items By measure picklist, select the real-time alert to filter by.
Click Calculate.
Measure Table
Table 15-19 Define Filter/Rollup View Measures
| Label | Definition |
|---|---|
|
Product Attribute 1, 2, 3 |
Picklist to present product attributes for a dynamic product hierarchy rollup. |
|
Filter Items By: |
Picklist used to select a real-time alert to filter items. |
|
Filter Markdown Max and Min % |
Measures used to enter markdown percentages to filter items. |
Measure Profile
Default Profile
The Default profile is used to select dynamic product attributes and filter items.
Application Action
Refresh Product Rollup
The Refresh Product Rollup Application Action creates dynamically updated alternate hierarchies based on user defined attribute selections. After running the Application Action, the user may select the alternate product hierarchy to see rollups based on the attribute selections.
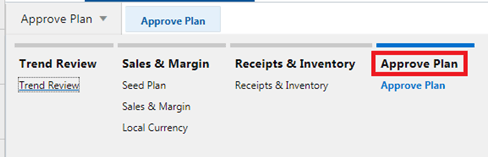
The fourth and final step in the In-Season Planning process is Approve Plan. This step approves the item plans that you have created, analyzed, and reviewed for accuracy.
The output of this step is an approved Item Plan Current Plan.
The step to complete this process:
Approve the item plan.
Prior to Starting this Step:
Thoroughly analyze and review the item plans by cluster to ensure they meet the financial goals of the category.
After Completing this Step:
Replan In-Season results as necessary.
Tab and View in this Step:
Application Action
Approve Plan
The Approve Plan Application Action copies data from the Working Plan (WP) to the Current Plan (CP).
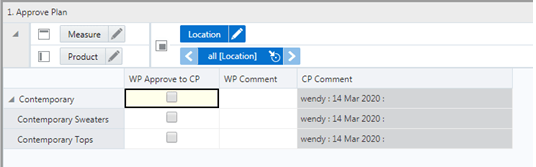
This tab is used to approve the plan.
The steps to complete this process:
In the WP Approve to OP/CP measure, check the Boolean flag for the subcategories and clusters that should be approved.
If all subcategories and clusters should be approved at once, roll up to All Product and All Location and check the Approve to OP measure at that level.
In the WP Comment measure, enter approval comments.
The WP Approval Comments will be copied to the OP Approval Comments and concatenated with the approver's ID, for future reference in this view.
Run the Approve Application Action.
Note that the Approve Application Action creates the OP and CP versions of the plan.
Measure Table
Table 15-20 1. Approve Plan View Measures
| Label | Definition |
|---|---|
|
WP Approve to CP |
Boolean flag measure required to be checked in order to approve the Working Plan Item Plan to the Current Plan. |
|
WP Comments |
Comments entered here will be copied to the CP Approval Comments and concatenated with the approver's ID, for future reference in this view. |
|
CP Comments |
Current Plan comments used as a reference. |
Measure Profile
Default Profile
The Default profile is used to approve the Item Plan to the CP version.
Application Action
Approve Plan
The Approve Plan Application Action copies data from the Working Plan (WP) to the Current Plan (CP).