| Oracle® Retail Invoice Matching User Guide Release 16.0.2 F10136-01 |
|


 Previous |
 Next |
Predefined reports are packaged with Operational Insights and are available for ReSA, Allocation, ReIM, and RMS as dashboard and In-context BI reports.
ReIM Operational Insights reports can be divided into the Dashboard Reports and In-context BI Reports. There reports are embedded within the ReIM ADF application.
The dashboard surfaces information in a manner that will help users (Finance Manager and Accounts Payable specialist) understand invoice match workload, view supplier performance, manage employee workload and provide quick visibility into cost, quantity and tax discrepancies. The dashboard allows you to contextually launch into the Summary Match, Detail Match and Discrepancy Review list to take quick action on the insights presented.
ReIM Dashboard Reports:
Upcoming Invoices
Automatch Rate
Supplier Site Performance
Employee Workload
Invoices
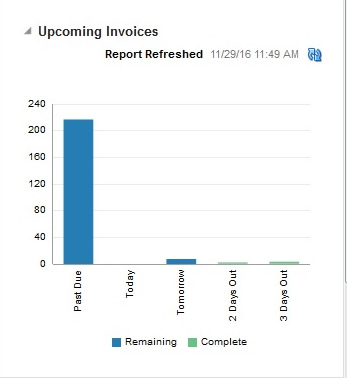
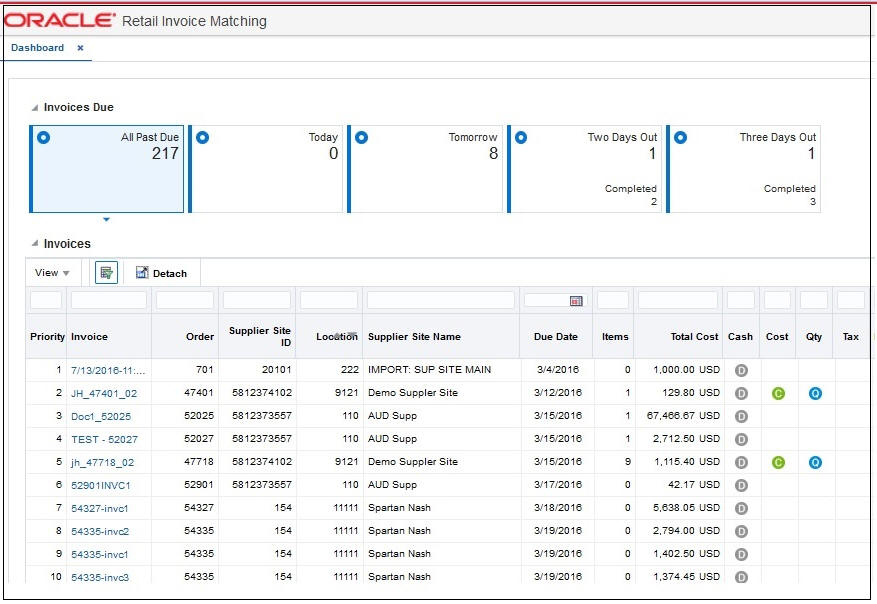
The Upcoming Invoices Report provides visibility into the upcoming workload for either the Accounts Payable Specialist or a group of employees for the Finance Manager.
The report shows the number of Completed and Remaining Invoices with the invoice due date equal to:
Today
Tomorrow
2 days out
3 days out
The report also shows the number of Remaining Invoices with the invoice due date in the past:
Past Due
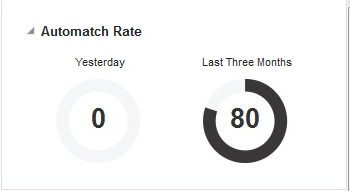
The AutoMatch Rate report will allow you to quickly see the total percent of invoices in matched status that were matched by the automatch batch in comparison with the total number of invoices that were manually matched by the ReIM user. This metric is shown by using a gauge report.
The number shown and represented by the black bar is the percent that is Automatched.
The remaining percentage represented by the light gray bar is the percent that was manually matched.
The report is calculated for you and can be viewed 2 different ways.
Yesterday
Last 3 months
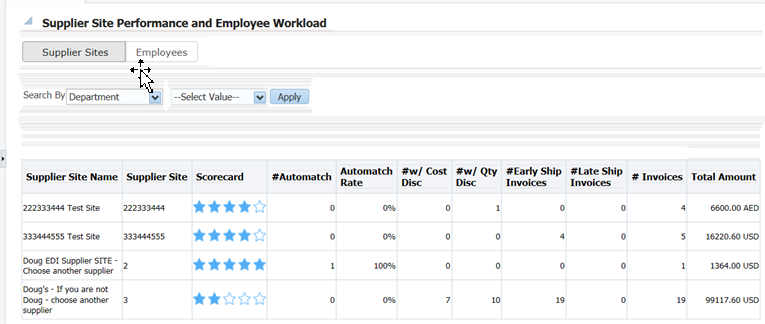
The Supplier site report lists each individual supplier that the employee is responsible for. This is only available on the Finance Manager dashboard. This report serves as a quick glance to see how the supplier site is performing and all the data that is shown is for the past 12 weeks (84 days).
Supplier site
Supplier site ID
Scorecard* (See below for more details)
# Automatch
Auto Match Rate
# w cost discrepancy
# w unit discrepancy
# early ship invoices
# late ship invoices
# invoices
Total amount
You are able to sort and filter based off of Supplier site ID.
The Finance Manager will see a list of the supplier sites of the employees that roll up to that role.
*Scorecard: The supplier site rating based on certain parameters such as discrepancy occurrence rate, exact matches vs matches within tolerance and shipping performance.
Weightage assigned to each of the criteria is stored in a configuration table. See Compliance Metric for more details.
Search By: You will be able to search by the levels below in order to do a quick look up of supplier site performance:
Dept
Supplier Site
When the down arrow of the Search By box is clicked; you are given the option to select either department or supplier site. Then you must enter in the ID of the corresponding level you want to search. When you click the Apply box, any supplier site that has items in the level that was searched is returned for review of your performance. This search gives the Finance Manager a way to search at the department or supplier site for ease of use.
If you enter an incorrect ID for any of the levels, an error message is provided letting you know that the ID entered is inaccurate.
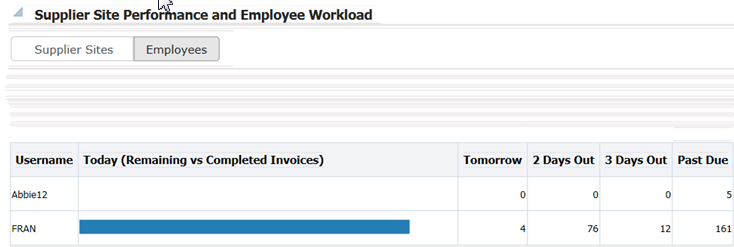
On the Finance Manager dashboard, this user has the option to toggle between the supplier site performance report and the employee workload report. The employee workload report provides a way for the finance manager to track their employee's performance. This report is not available on the Accounts Payable Specialist Dashboard.
The Finance Manager will see a list of employees that report to them and date for 5 data ranges associated with manual matching of invoices.
Invoices due needing manual matching will be shown for the following time ranges, and in this order:
Today (Remaining vs Completed)
Tomorrow
2 days out
3 days out
Past due
For the Today (Remaining vs Completed) column, there is a horizontal bar graph that shows the Completed vs. Remaining workload for each employee.
Completed Invoices: The blue horizontal bar represents the number invoices that have already been completed by manual matching.
Remaining Invoices: The light gray horizontal shaded bar represents the remaining workload that the employee needs to match.
For the Remaining time frame, ie: Tomorrow, 2 Days out, 3 Days out and Past Due columns, the data is represented as a number that is the remaining invoices that each employee is responsible for.
The main purpose of the Invoices report is to allow the Accounts Payable team to manage their work-load. The list of invoices can be sorted and filtered to allow you to resolve and match the highest priority invoices first.
The report will be initially sorted based on a pre-determined set of criteria that is listed below but you can use the sort and filter capability to change the way the invoices are sorted.
The columns that are displayed to you and available for viewing are as follows and are further detailed in the Metrics section of this document.
Priority (detailed below)
Invoice
Order
Supplier site Name
Location
Due Date
Items
Total Cost
Cash Discount
Cost
Qty
Tax
Five pre-defined tiles are used to filter the report. The five tiles are:
Past Due
Due Today
Due Tomorrow
2 Days Out
3 Days Out
In addition, within the filters applied by the tiles, you can also use standard ADF QBE filtering on each column of the report.
On the Invoices report there are 3 opportunities for you to contextual launch directly into the ReIM application for discrepancy resolution or invoice matching. In all 3 instances, we need to pass certain parameters to ReIM for ease of navigation.
TAX Discrepancy: When you click the TAX icon (T) on the Invoices Report, they will be launched into the Tax Discrepancy Review List in the ReIM application. If the RMS system setting has a tax type= sales, then the Tax Discrepancy filter or the Tax column will not be visible on the report.
|
Note: When there is a Tax Discrepancy, the contextual launch for Invoice ID will be disabled as you will not be able to match an invoice that has a tax discrepancy. |
Parameters: None
When user launches to the Tax Review list, they will see all invoices associated with their ID that have tax discrepancies.
Cost and Qty Discrepancy: When you click either the Cost (C) Or Qty (Q) discrepancy on the Invoices Report, they will be launched into the Discrepancy Review List in the ReIM application. From this window they will be able to resolve discrepancies for items on the invoice. If discrepancies are resolved for all items on an invoice, the invoice goes to a matched status.
Parameters: Document ID
Summary Match Window: When user clicks on the invoice number in the Invoices report, they will be launched into the Summary Match window in the ReIM application. On the Summary Match window, you will be able to match invoices.
Parameters: PO number, Location, Document ID Supplier ID, Supplier Site ID
The priority metric that will be used to sort invoices is based on pre defined criteria. By using the priority invoice sorting, invoices having the highest priority are brought to the users' attention first thus helping them prioritize their work for the day and pick the most important invoices first for manual matching and for discrepancy resolution. The following metrics are considered for deriving the priority of the invoice:
Due Date (in order of: Past due, Due today, Due tomorrow 2 days out, 3 days out)
Cash Discount= Y
Total Cost amount (Descending order)
Cost Discrepancy= Y
Unit Discrepancy= Y
Group by date in this order: Past Due, Today, Tomorrow, 2 days out, 3 days out.
Within each group, show invoices with a cash discount first. Within the cash discount invoices show highest Total cost invoices first then descending order.
For invoices not having cash discount, prioritize the ones having cost discrepancy and unit discrepancy first, the ones with only cost discrepancy next and then the ones with only unit discrepancy last. Within each group prioritize by the Total Cost of the invoice in descending order.
The next group will be Invoices due today, use the same logic to prioritize these next.
In-context BI Reports are displayed in the contextual pane of some ReIM windows. In-context BI reports provide additional In-context insights to the data being viewed in the ReIM window.
The following ReIM windows have In-context BI reports displayed in the right pane:
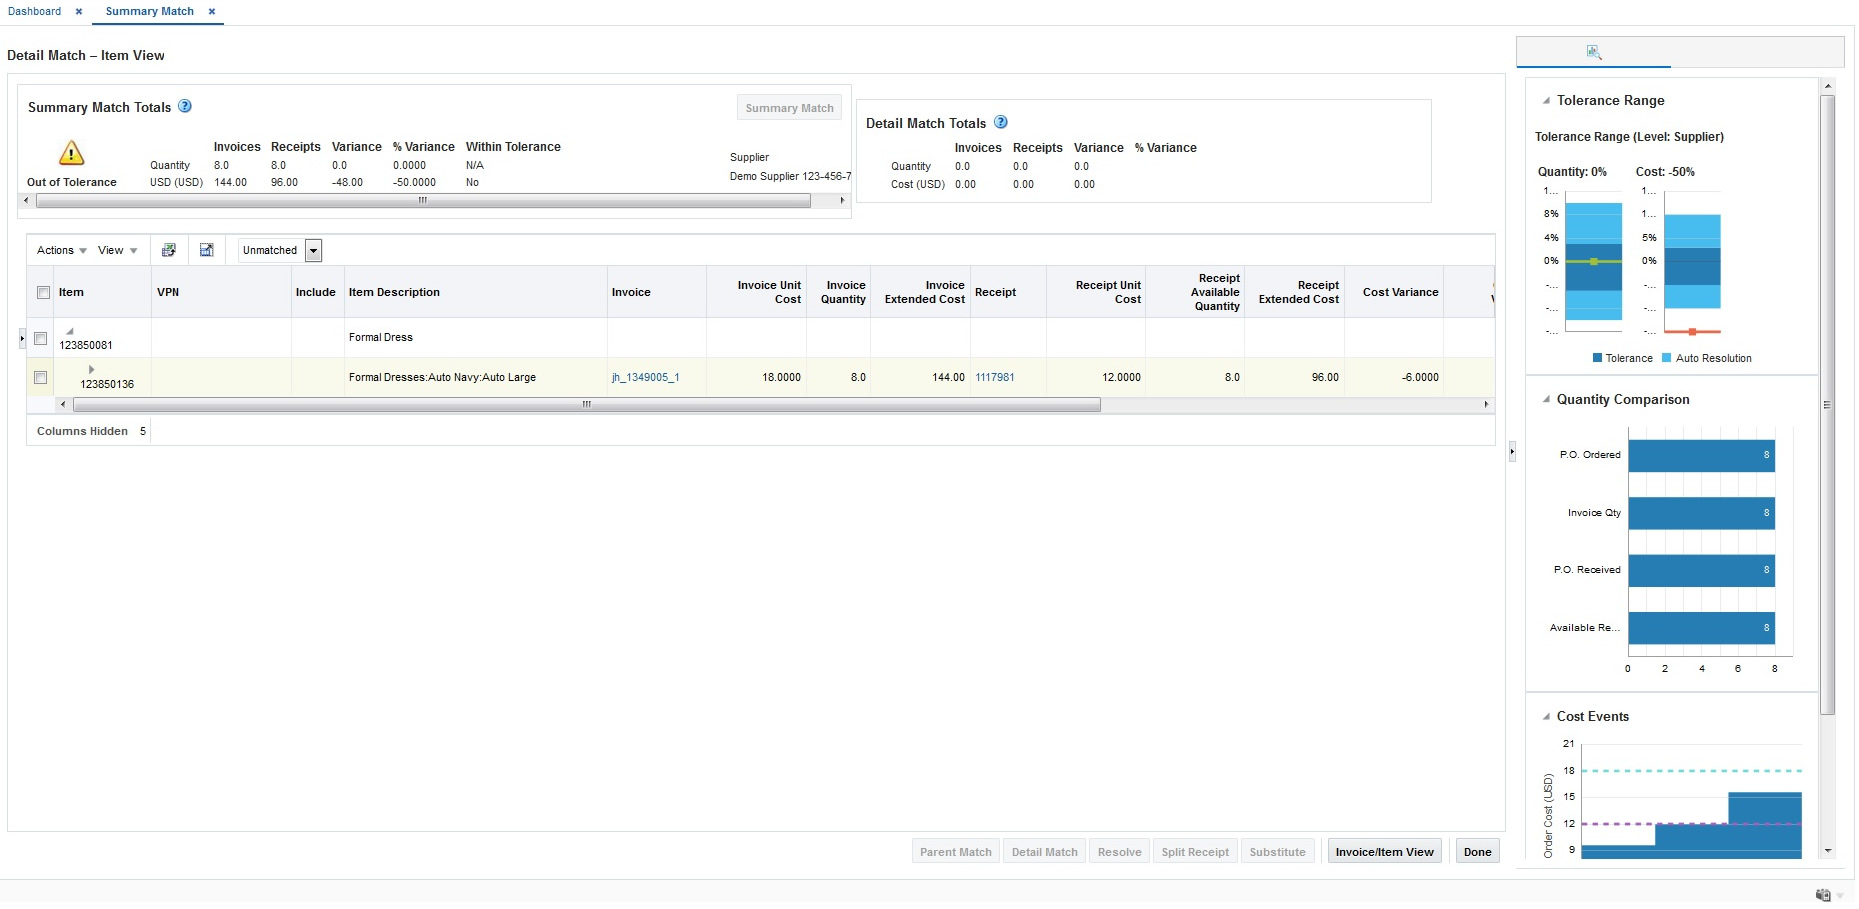
Detail Match
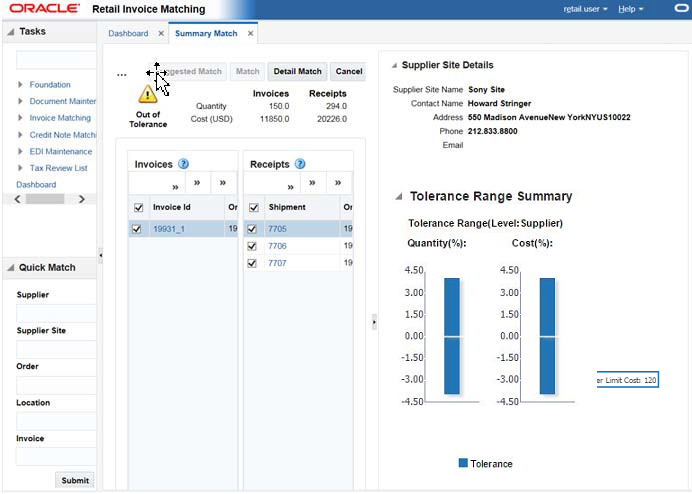
Summary Match
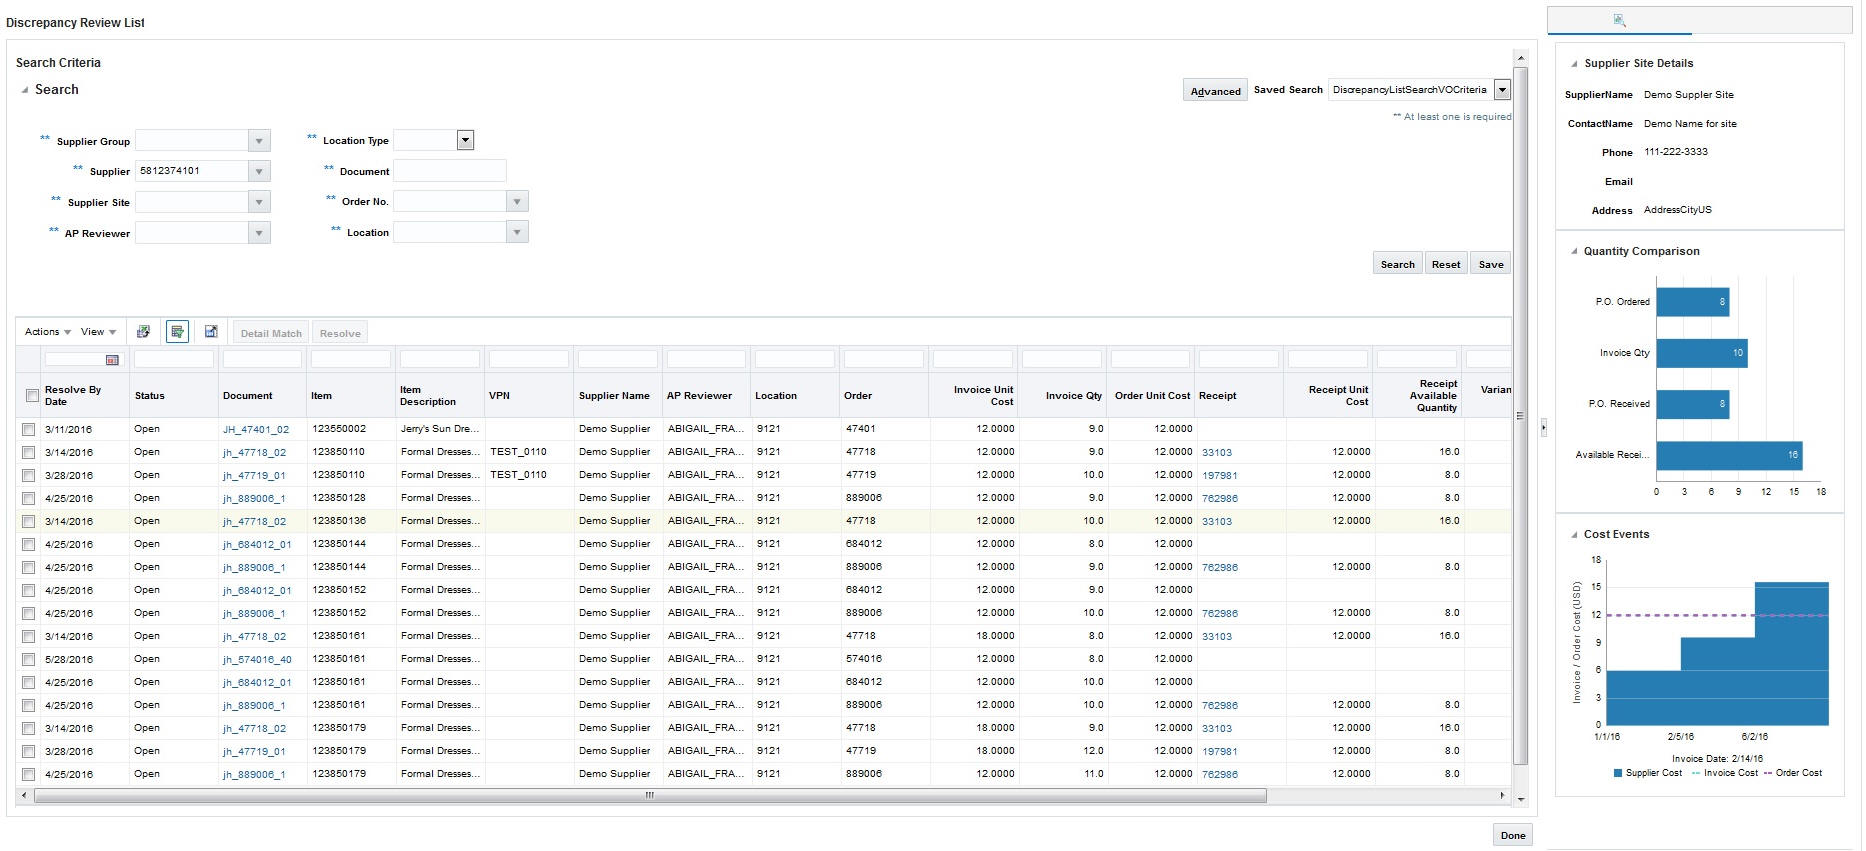
Discrepancy Review List
The following are In-context BI reports displayed on the Detail Match window:
Quantity Comparison
Cost Events
Tolerance Range
The following are In-context BI reports displayed on the Summary Match window:
Supplier Site Details
Tolerance Range
The following are In-context BI reports displayed on the discrepancy review list window:
Supplier Site Details
Cost Events
Quantity Comparison
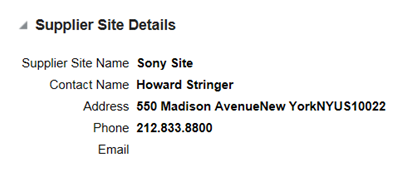
The Supplier Site Details report will provide you the necessary information to get in contact with the supplier site they are working with. This report will be visible in the BI pane when you are in the Discrepancy Review List window as well as the Summary Match window.
The details provided in the report are as follows:
Supplier Name
Contact Name
Address
Phone number
E-mail address
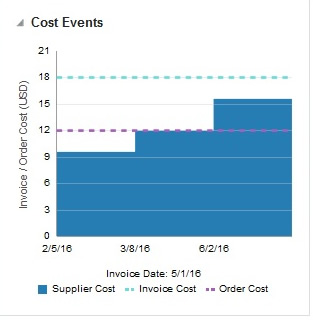
This report will provide you the visibility into the last two cost changes and one in the future using the invoice date as a reference. This may help explain why an invoice has a cost variance in the ReIM application. This report is visible when user is on the Discrepancy Review List window and when user is on the Detail match window.
The X axis of the report shows the dates that the cost changes either occurred or will occur and the Y axis shows the price points of the cost events. There are 2 lines that represent both the P.O. Cost and the Invoice cost of the invoice that is selected so you can see where the variance is.
There are three cost events displayed; using the Invoice Date as the reference. There are two past cost changes and one future cost event.
The Detail Match window is a three-tiered table, If a parent row is in focus, the report is refreshed but will not show any data. If the SKU row is in focus, the report is refreshed and PO Cost and Invoice cost will update based on the SKU. If the focus is on a row below the SKU level, the report is not refreshed. The Discrepancy Review List is a single hierarchy table sowing the sku row, so the report will always be based on the row in focus.
Invoice Date: The Invoice date is listed and plotted on the graph using a tic mark. If the invoice date is outside of the cost changes listed (before first or after last), the tic mark will be right outside of the graph so it will not impact the scale of the graph.
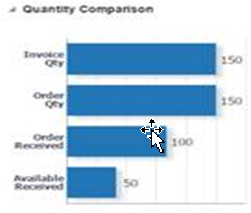
This Report gives you a quick glance at where the discrepancy lies in terms of Quantity.
The report is visible when user is on the Discrepancy window in ReIM and when user is on the Detail Match window.
The report is made up of 4 horizontal bars:
Invoice Qty
P.O. Ordered Qty
P.O. Received Qty
Available Received Qty
On the bar graph, show the numerical value for each metric, all bar graphs are the same color but the size of the bar will reflect the variances.
When you are on the Detail Match window and focus is on a sku row, the report will populate with data associated with the highlighted sku. If a parent row is in focus, the report will be populated with totals selected for the parent. The Discrepancy Review List is a single hierarchy table showing the sku row, so the report will always be based on the row in focus.
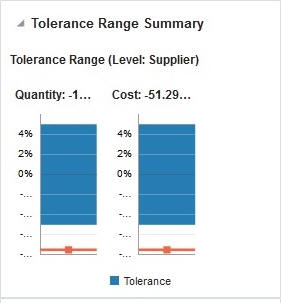
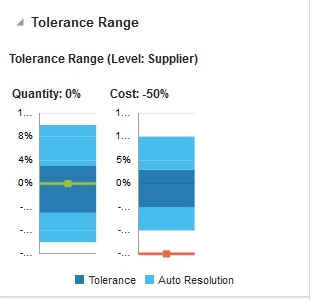
The Tolerance Range report shows you what the current tolerance ranges (both Qty and Cost) are for the invoice that they are reviewing in the application. This could be at the supplier site level or higher. This report is visible on the Summary Match window as well as the Detail Match window.
The Tolerance Range report is triggered when ever an invoice or receipt is selected. The variance shown in the report is a visual representation of the variance shown in the Summary Match totals table in the top left quadrant of the window.
The report consists of two bars, one for the quantity tolerance range, and the other for the cost $ tolerance range. The cost (or quantity) variance is shown on the graph as a red line if it is out of tolerance or a green line if it is within tolerance.
The Tolerance Range Level shows the level that is currently being used for the invoice that is selected in the application. Available options for the Tolerance Range Level are: Supplier Site, Supplier, Supplier Group, Department or System.
The Tolerance Range report should be triggered when a parent row or a sku row is highlighted. The tolerance range is based on the tolerance setting for the selected group of documents, and does not change as various sku rows are selected. When a parent row is highlighted, the tolerance report uses parent level tolerances instead of line level tolerances. The variance however reflects the specific value from the highlighted row.
If an Auto Resolution threshold has been defined (for line item level tolerance setting), in the Detail Match window, the inner-bounds of that tolerance are displayed in a different color shade with the levels displayed. These levels show the split-out by tolerance and auto resolution tolerance. The Auto Resolution threshold is not shown in the report for the Summary match window, as this does not apply to this level. Move the cursor over the tolerance range bar to view the actual tolerance and auto resolution levels.