Alarms provide information pertaining to a system's operational condition that a network manager may need to act upon. An alarm might represent a change in an external condition, for example, a communications link has changed from connected to disconnected state. Alarms can have these severities:
- Critical application error
- Major application error
- Minor application error
- Cleared
An alarm is considered inactive once it has been cleared and cleared alarms are logged on the Alarms & Events > View History page of the GUI.
Events note the occurrence of a transient condition. Events have a severity of Info and are logged on the View History page.
Note: Some events may be throttled because the frequently generated events can overload the MP or OAM server's system or event history log (e.g., generating an event for every ingress message failure). By specifying a throttle interval (in seconds), the events will appear no more frequently than once during the interval duration period (e.g., if the throttle interval is 5-seconds, the event will be logged no frequently than once every 5-seconds).
Figure 1 shows how Alarms and Events are organized in the application.
Flow of Alarms
Alarms and events are recorded in a database log table. Application event logging provides an efficient way to record event instance information in a manageable form, and is used to:
- Record events that represent alarmed conditions
- Record events for later browsing
- Implement an event interface for generating SNMP traps
Alarm indicators, located in the User Interface banner, indicate all critical, major, and minor active alarms. A number and an alarm indicator combined represent the number of active alarms at a specific level of severity. For example, if you see the number six in the orange-colored alarm indicator, that means there are six major active alarms.
Alarm Indicators Legend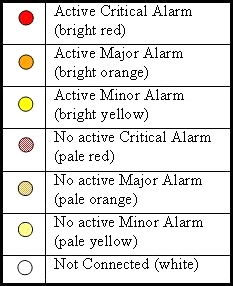
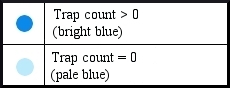
Trap Count Indicator Legend