| Oracle® Retail Operational Insights User Guide Release 15.0 E65905-01 |
|

 Previous |
 Next |
Predefined reports are packaged with Operational Insights and are available for ReSA, Allocation, and ReIM as dashboard and contextual BI reports. You can use these packaged reports without modifications to begin reporting on your retail measures. You can also use these reports as foundation or examples for building your own custom reports. In addition to the predefined reports, Operational Insights includes a variety of predefined fundamental metrics for Allocation and ReIM that can be used for creating custom reports.
ReSA Operational Insights reports can be divided into the Dashboard Reports and Contextual BI Reports. There reports are embedded within the ReSA ADF application. Ad-hoc creation of reports and dashboards in a standalone OBIEE environment is not an out of box feature.
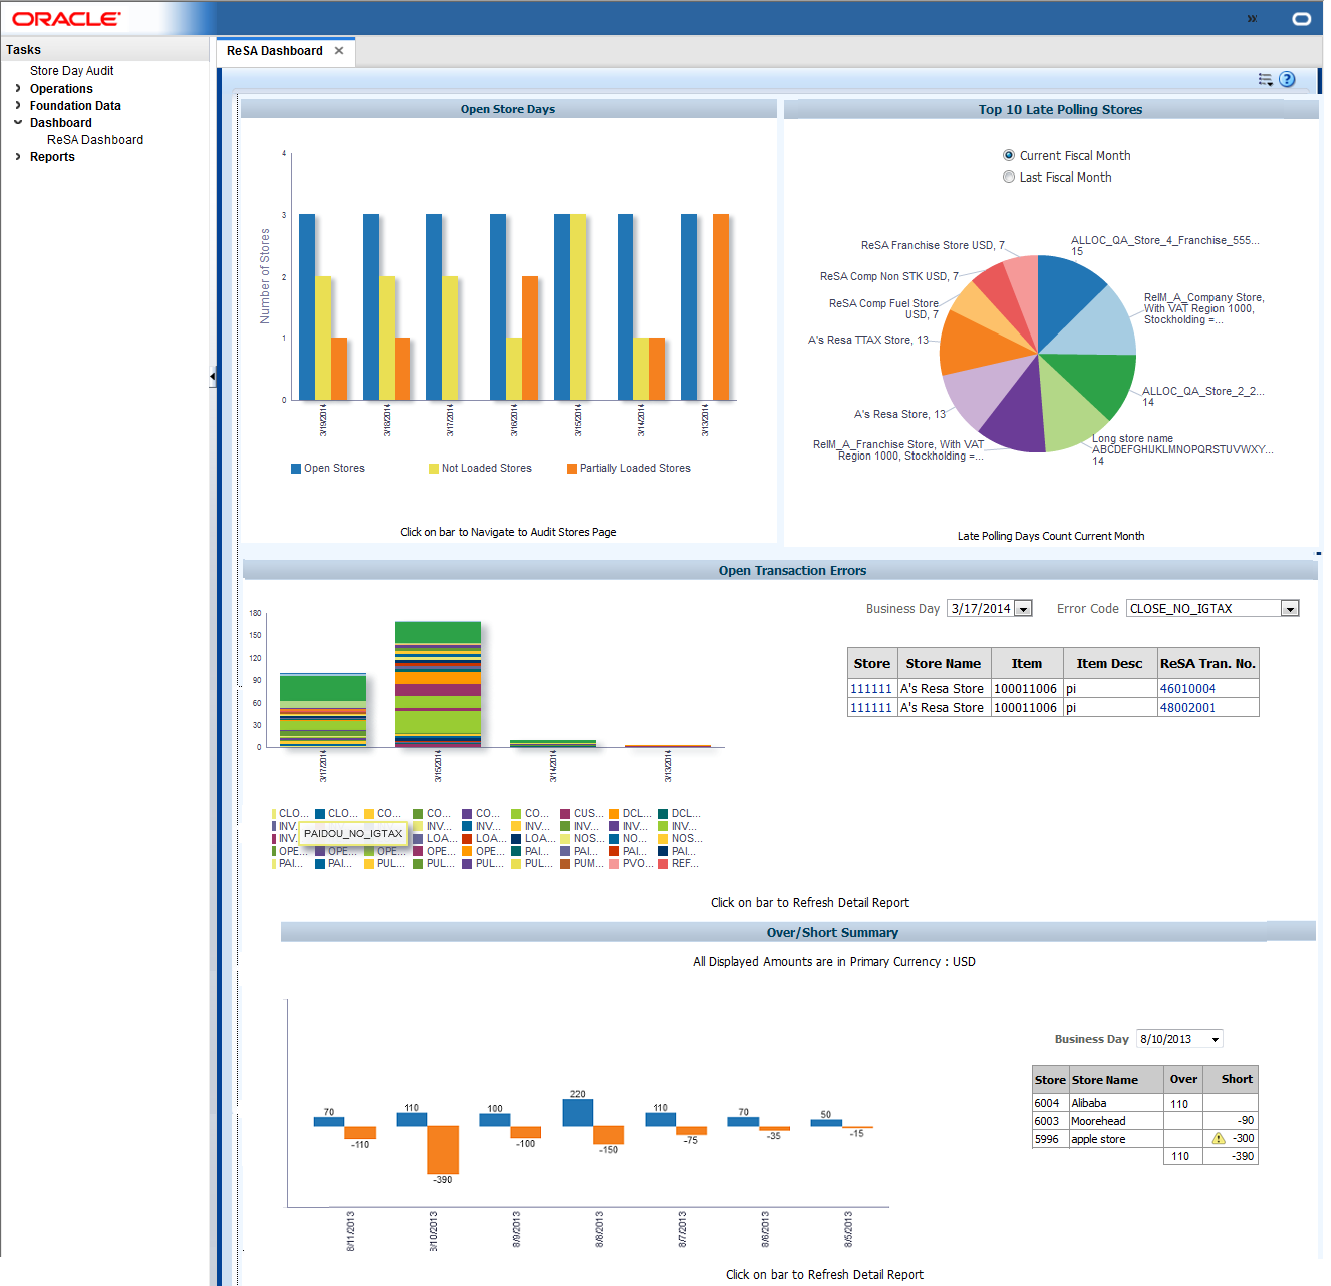
The dashboard surfaces information in a manner that will help users - Sales auditors - prioritize their day-to-day activities as well as quickly identify areas of concern. The dashboard allows a user to look at a consolidated view of their 'to-dos' and then directly and contextually launch into the corresponding ReSA screens to take an action. The Dashboard Reports show data across the user assigned stores i.e the stores assigned to the logged in user.
Via the dashboard, a Sales Auditor can at a glance identify store days that are still open due to errors or late polling by stores and can resolve or escalate the issues.
A view of all open transactional errors across his stores for the last seven days is available that helps him see error patterns and helps estimate his workload in fixing them. The auditor can then start fixing the errors by launching the respective ReSA screens directly from the links provided in the dashboard reports.
The over short summary report helps the sales auditor in the important function of tracking the overages or shortages at his stores and identifying fraudulent behavior.
The dashboard reports can be viewed by navigating to Tasks > Dashboard > ReSA Dashboard in ReSA.
ReSA Sales auditor Dashboard Reports:
Open Store Days Report
Top 10 Late Polling Stores Report
Open Transaction Errors Report
Over/Short Summary Report
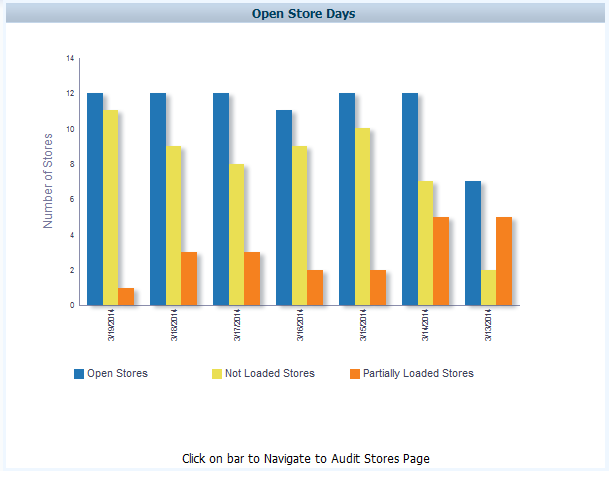
The open store days report indicates a sales auditor's open store days and color codes them by whether they have not been audited, not been loaded or only partially loaded for the last seven days. There are three different actions that can be taken from this report:
The user is able to click on an 'Open Stores' bar in the report and will be contextually launched into the ReSA Store Day Search screen. Therefore, the ReSA screen will be auto-populated for all the user's store-days with a status of 'Sales Audit In-Progress'.
The user is also able to click on a 'Not Loaded Stores' bar in the report and will be contextually launched into the ReSA Store Day Search screen. Therefore, the ReSA screen will be auto-populated for all the user's store-days with a status of 'Ready for Import.'
The user is able to click on a 'Partially Loaded Stores' bar in the report and will be contextually launched into the ReSA Store Day Search screen. Therefore, the ReSA screen will be auto-populated for all the user's store-days with a status of Partially Loaded.
|
Note: Only days for which data exists will be shown in the report. |
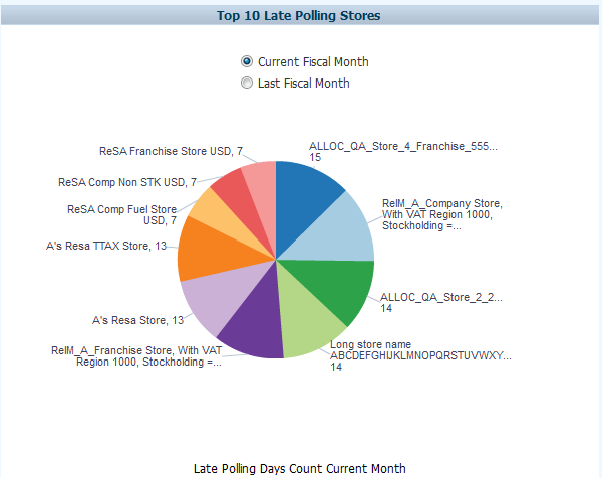
The top 10 late polling report gives the auditor a view of top 10 stores that have the highest number of late polling days in a given fiscal month. This report shows the count of store days in status 'Ready to Import' or 'Partially loaded' per store for the Current Fiscal Month or Last Fiscal Month based on the user view selected. This will display the stores that have the maximum number of data loading issues for a given time period. Based on this analysis the Auditor can contact these stores or escalate them as high issue stores to management.
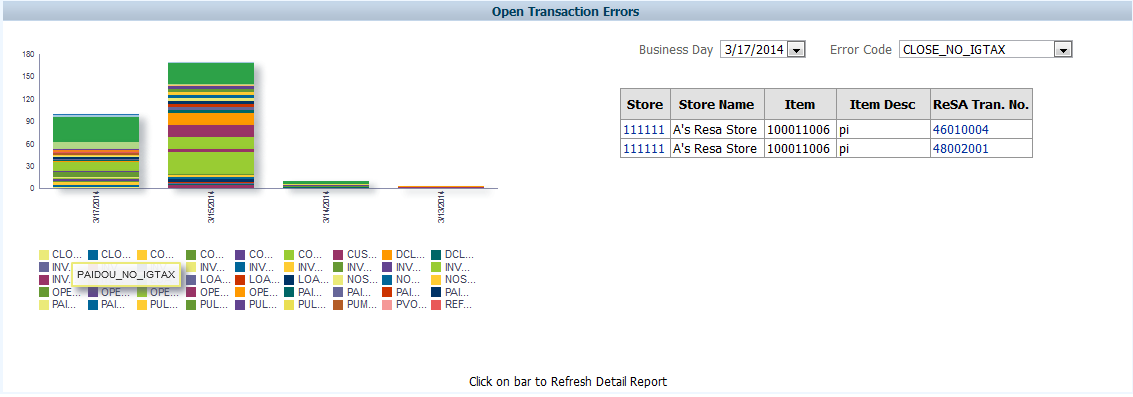
The Open Transaction Errors report displays the number of open transactional errors across all stores color coded by error code over the last seven days.
The user can hover over a section of the stacked bar to see the count of errors for a given error code on a given business date.
The user is able to click on the stacked bar for a specific error code and business day to refresh the tabular detail report on the right. The tabular report shows the store, item and transaction number details of all errors existing for the given business date and error code. The user can also view the appropriate detail data in the tabular report by choosing the business date or error code from the user prompts provided.
|
Note: Item details are displayed in the tabular report only for item level errors (i.e. errors with rec_type = TITEM, IDISC, IGTAX>). |
The user can click on the data in the Store column in the open transaction error detail table and will be contextually launched into the ReSA Transaction Search screen. The ReSA screen will be auto populated with all transactions for the given store and business date where transaction level errors exist.
The user can click on the data in the ReSA Tran. No. column in the open transaction error detail table and will be contextually launched into the ReSA Transaction Maintenance screen for the given transaction. The screen will be launched either in the 'View' mode or 'Edit' Mode based on the ReSA privileges that the user role has.
|
Note: Only days for which data exists will be shown in the report. |
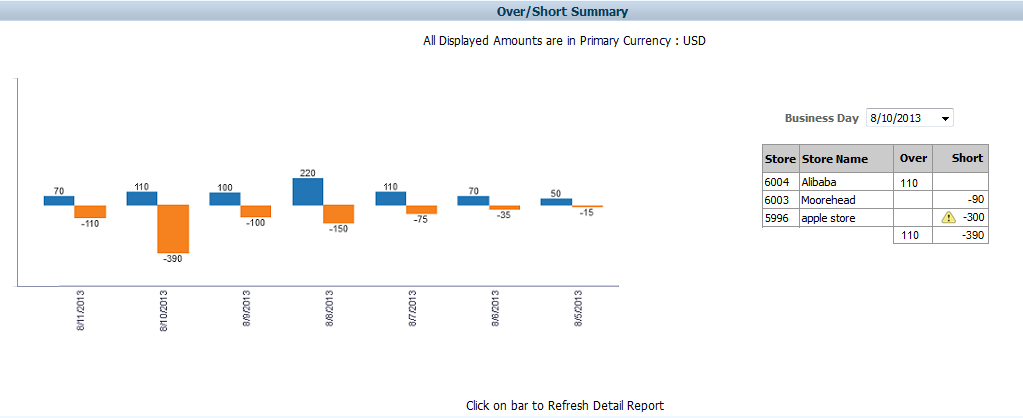
The Over/Short Summary report displays the sum of overage amounts for all stores that have an over amount and the sum of shortage amounts for all stores that have a short amount per business day for the last seven days.
The user is able to click on the over or short bar for a given business day which refreshes the tabular detail report on the right. The tabular report shows the store and the corresponding over amount or short amount for the store and given business day. The user can also view over and short amounts across stores for a given business day in the detailed tabular report by choosing the Business Day in the prompt provided.
If the over amount or short amount at a store exceeds the configured threshold amount, a warning symbol is displayed against the given row.
|
Note: The threshold for over amount and short amount can be configured through the Oracle BI administration tool through two session variables; Ovr_Thres and Short_Thres>. |
If the stores have varied local currencies, the amounts are displayed in primary currency only. If all stores have the same common local currency, the amounts are displayed in local currency.
The user is able to click on the data in the Store column in the over/short detail report and will be contextually launched into the ReSA Store Day Audit screen with the Over/Short Totals tab highlighted for the selected store and business day. The screen will be launched either in the 'View' mode or 'Edit' Mode based on the ReSA privileges that the user role has.
|
Note: Only days for which data exists will be shown in the report. |
Contextual BI Reports are displayed in the contextual pane of some ReSA screens. Contextual BI reports provide additional in context insights to the data being viewed in the ReSA screen.
The BI reports embedded into the ReSA screens help the sales auditor grasp data displayed in a graphical format and also helps see pattern across last seven business days giving him an insight into the occurrence of similar kinds of issues in the past.
The following ReSA screens have contextual BI reports displayed in the right pane:
Store Day Search Screen
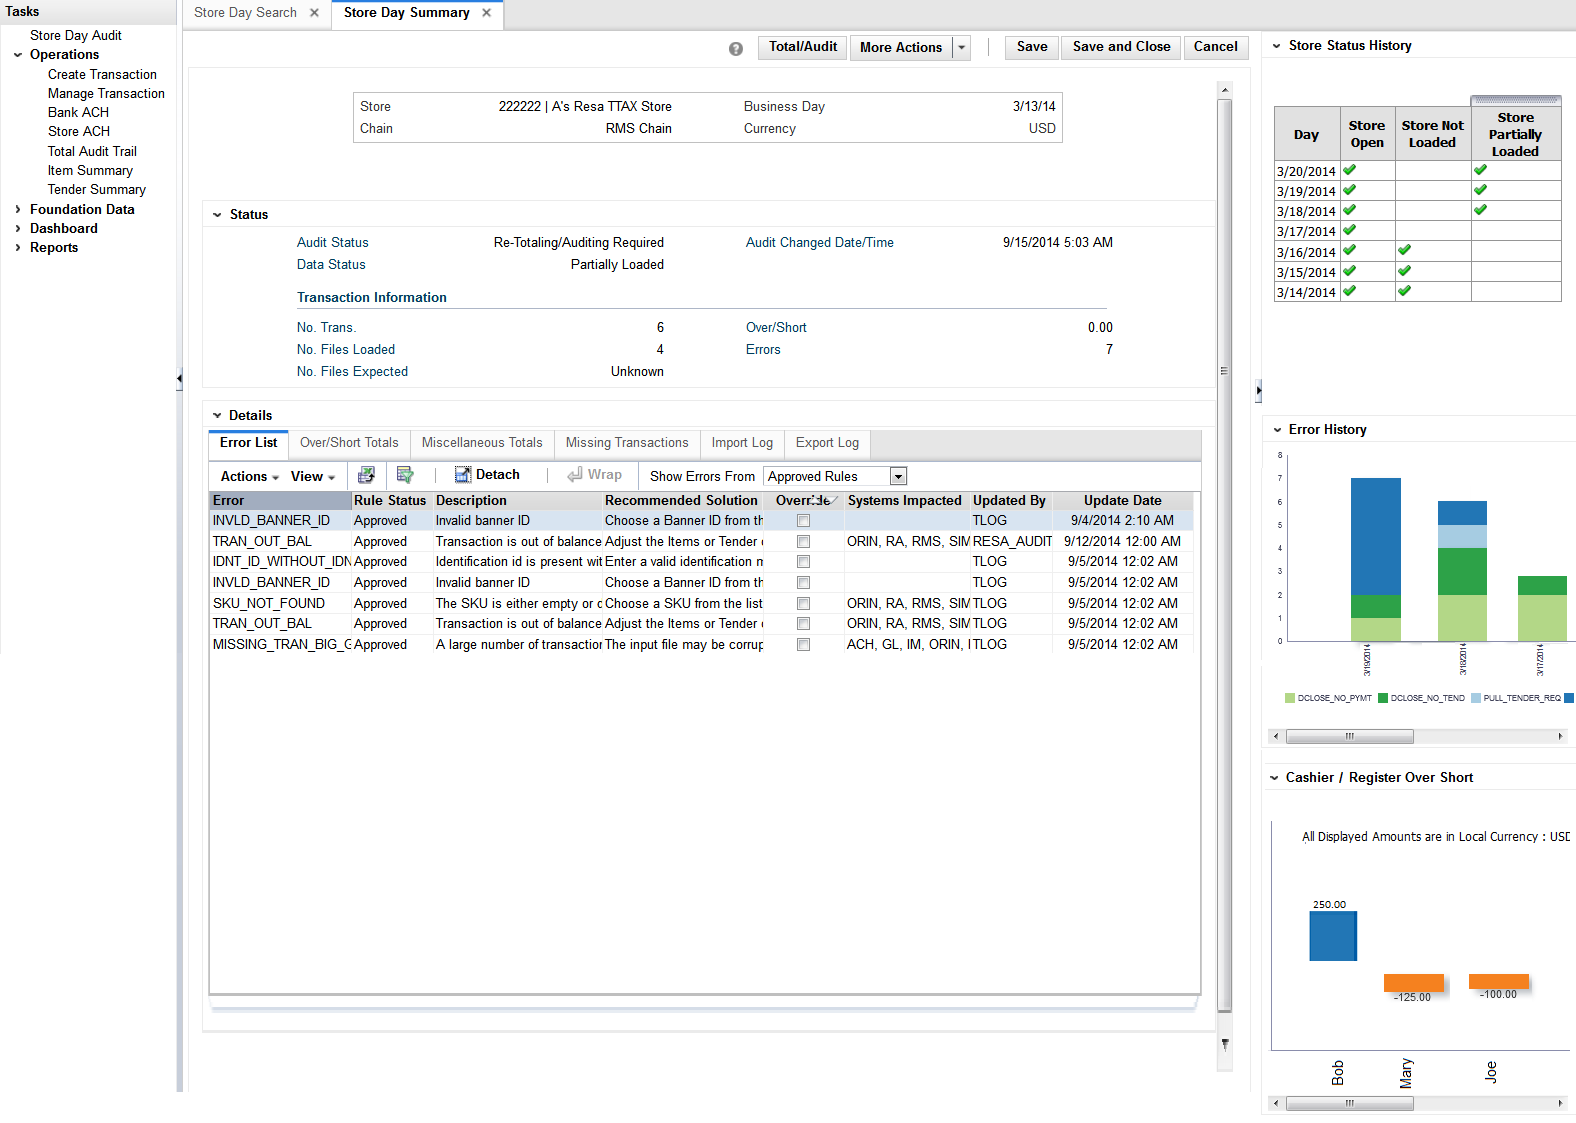
Store Day Summary Screen
Transaction Maintenance Screen
Tender Summary Screen
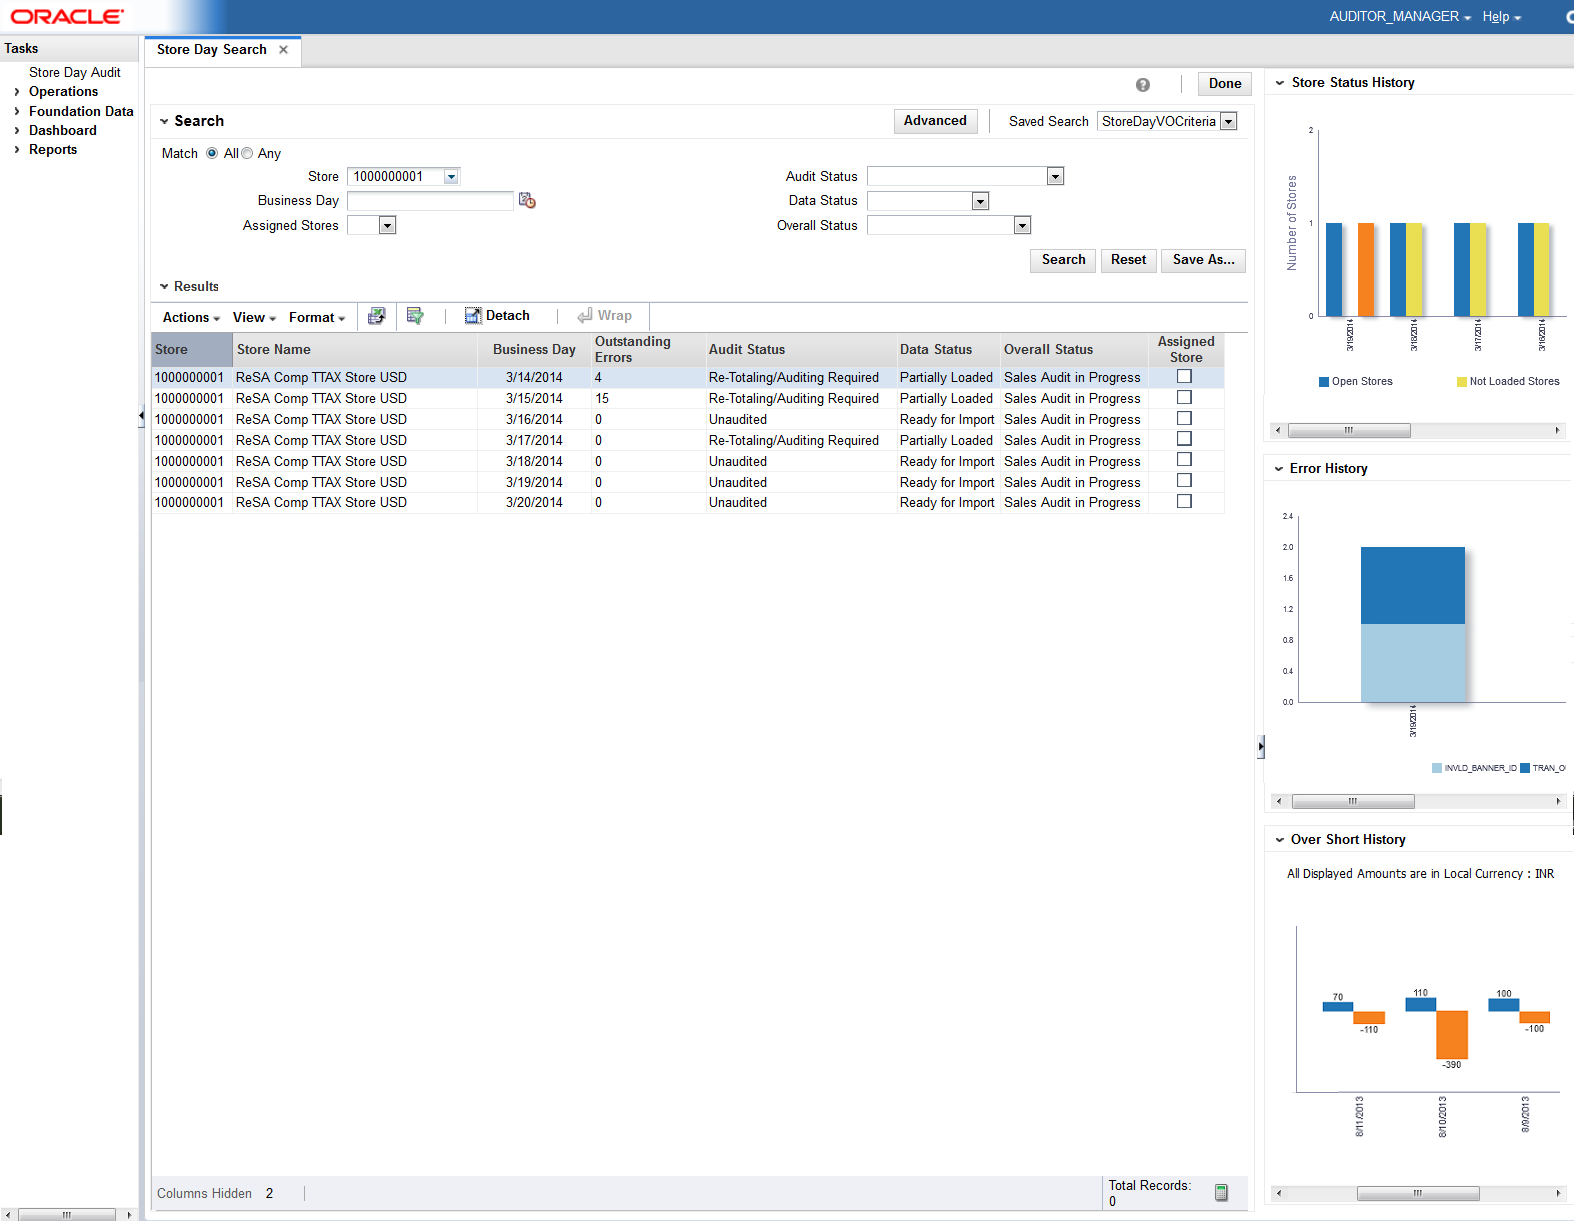
The following are the contextual BI reports displayed on the Store Day Search Screen of ReSA:
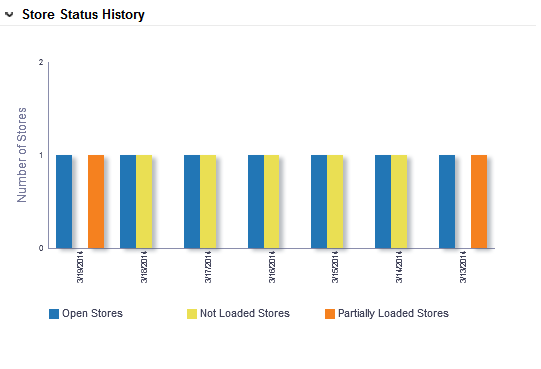
Store Status History Report
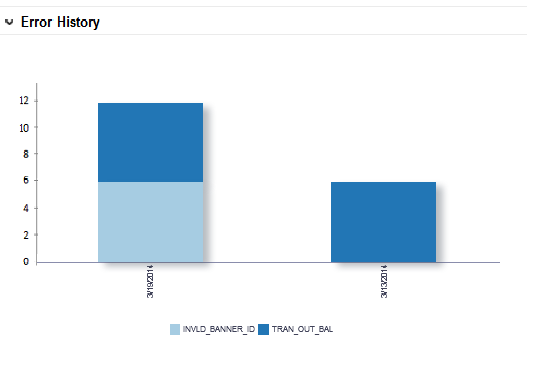
Error History Report
Over/Short History Report
The store status history report on store day search screen indicates a sales auditor's open store days and color codes them by whether they have not been audited, not been loaded or only partially loaded for the last seven days. The user can also hover over the bar charts to view the count.
|
Note: Only days for which data exists will be shown in the report. |
The Error History report on store day search screen of ReSA indicates the total number of errors for all auditor stores per business day for the last seven days. The error count includes current open errors and errors that were resolved. This would give the auditor insight into the occurrence of similar kinds of errors in the past that were resolved or that are still open. The errors are color coded by error code.
The user can hover over the respective section of the chart to view the error count for the given error code.
|
Note: Only days for which data exists will be shown in the report. |
The Over/Short Summary report displays the sum of overage amounts for all stores that have an over amount and the sum of shortage amounts for all stores that have a short amount per business day for the last seven days.
If the stores have varied local currencies, the amounts are displayed in primary currency only. If all stores have the same common local currency, the amounts are displayed in local currency.
|
Note: Only days for which data exists will be shown in the report. |
The following are the contextual BI reports displayed on the Store Day Summary Screen of ReSA:
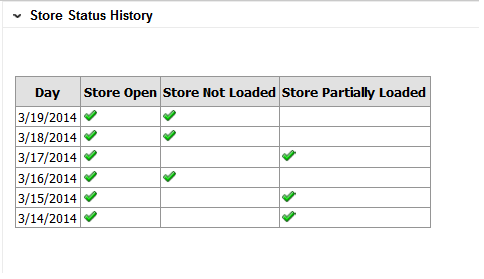
Store Status History Report
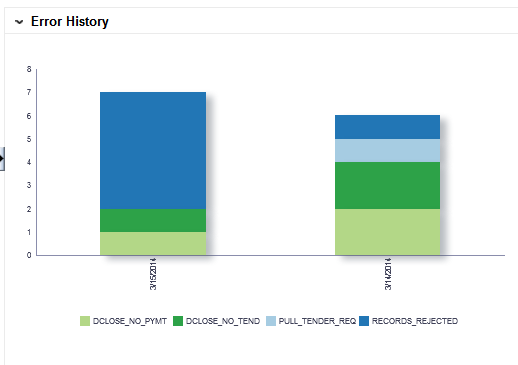
Error History Report
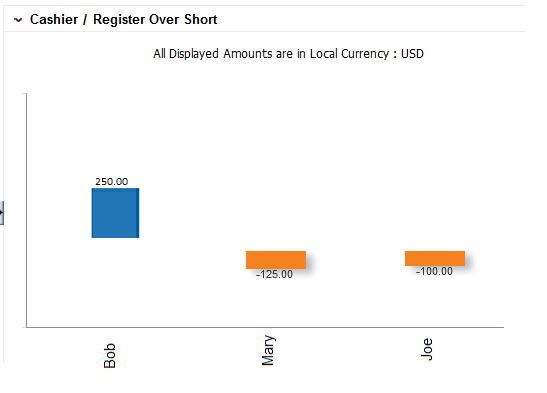
Cashier/Register Over Short Report
The store status history report on store day summary screen indicates the presence of not audited store days, not loaded store days, and partially loaded store days across the last seven days for the store that is being viewed in store day summary screen. An indicator signifies if the given store is not audited, is not loaded or is partially loaded for the last seven business days.
|
Note: Only days for which data exists will be shown in the report. |
The error history report on store day summary screen indicates the pattern of the errors existing for the store day being viewed in the store day summary screen of ReSA over that last seven days.
The report indicates the number of occurrences of errors similar to the errors open for the selected store day over the last seven days.
The error count includes both open errors and errors that were resolved for the store days. This would give the auditor insight into the occurrence of similar kinds of errors in the past that were resolved or that are still open. The errors are grouped and color coded by error code.
The user can hover over a section of the chart to view the error count for the given error code and business day.
|
Note: Only days for which data exists will be shown in the report. |
The cashier/register over short report on store day summary screen displays the overage or shortage amounts by cashier for the given store - business day being viewed in the store day summary screen of ReSA if the ReSA system option - Balance Level Indicator is set to cashier.
The report displays the overage or shortage amounts by register for the given store - business day being viewed in the store day summary screen of ReSA if the ReSA system option - Balance Level Indicator is set to register.
The amounts in the report are displayed in the RMS primary currency or the store's local currency based on the currency toggle in the store day summary screen.
|
Note: Only days for which data exists will be shown in the report. |
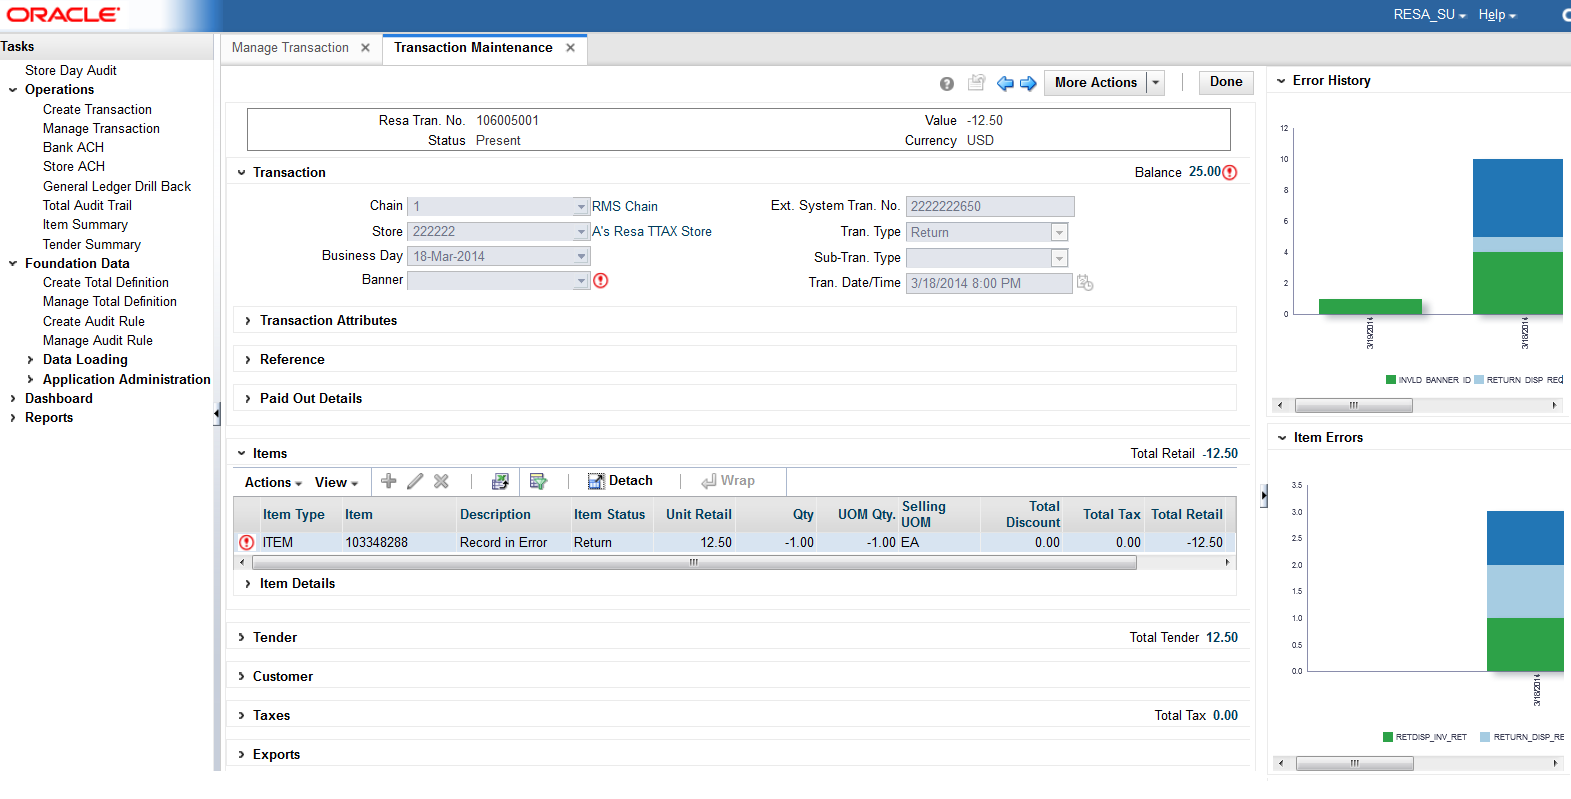
The following are the contextual BI reports displayed on the Transaction Maintenance screen of ReSA:
Error History Report
Item Errors Report
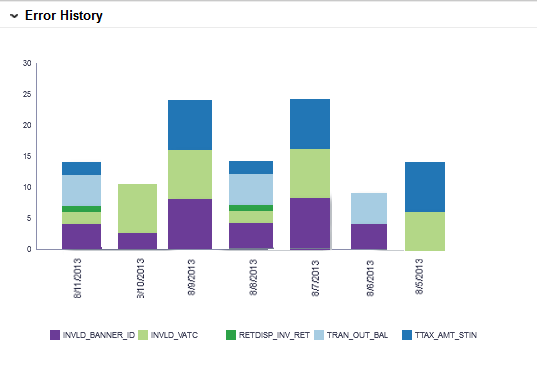
The error history report on transaction maintenance screen indicates the pattern of the errors existing for the transaction being viewed over the last seven business days. The report indicates the number of occurrences of errors similar to the errors open for the selected transaction for the given store over the last seven days.
The error count includes both open transactional errors and transactional errors that were resolved. This would give the auditor insight into the occurrence of similar kinds of errors in the past that were resolved or that are still open. The errors are grouped and color coded by error code.
The user can hover over a section of the chart to view the error count for the given error code and business day.
|
Note: Only days for which data exists will be shown in the report. |
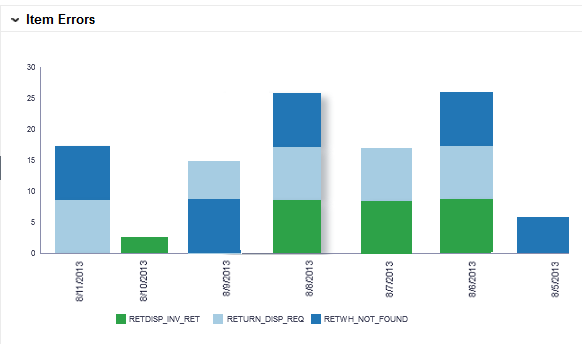
This item errors report on transaction maintenance screen indicates the pattern of the errors existing for the item selected on the ReSA screen for the given store over the last seven business days. The report indicates the number of occurrences of errors similar to the errors open for the selected item for the given store over the last seven days.
The error count includes both open errors and errors that were resolved. The errors are grouped and color coded by error code.
The user can hover over a section of the chart to view the error count for the given error code and business day for the selected item.
|
Note: Only item level errors (that is, errors with rec_type = TITEM, IDISC, IGTAX) are considered in this report. |
The report appears only when an item is selected in the Items panel of the Transaction Maintenance screen.
|
Note: Only days for which data exists will be shown in the report. |
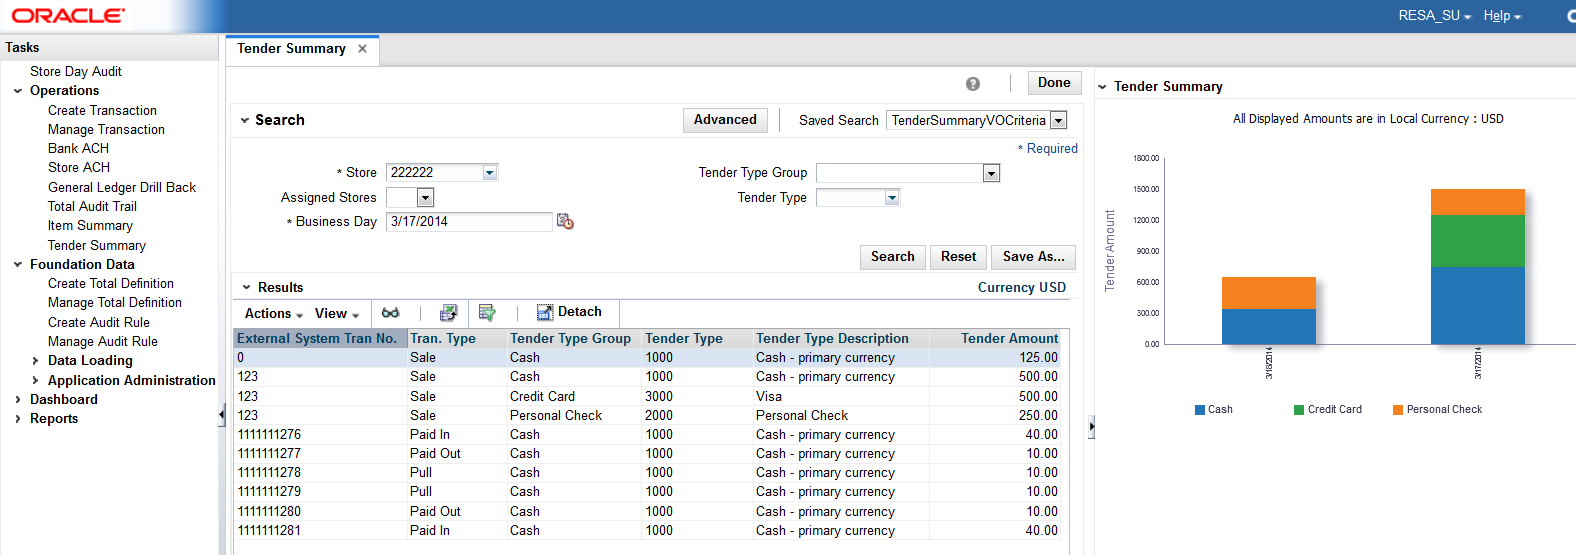
The following are the contextual BI reports displayed on the Tender Summary screen of ReSA:
Tender Summary Report
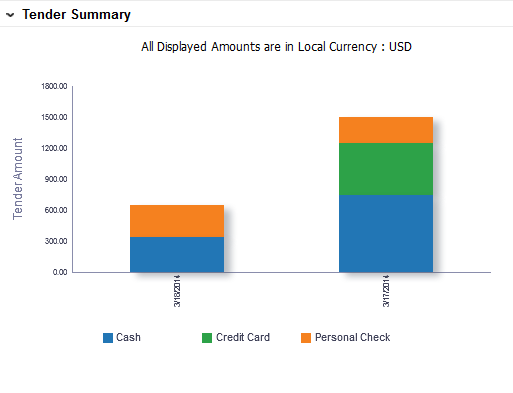
The tender summary report on tender summary screen displays the net tender amount by tender types -Cash, Credit Card and Check per business day over the last seven days for the store selected in tender summary screen.
The amounts in the report are displayed in the RMS primary currency or the store's local currency based on the currency toggle in the Tender Summary screen.
|
Note: The report appears only after the search has been executed. |
|
Note: Only days for which data exists will be shown in the report. |
ReSA supports viewing amounts both in RMS primary currency and in the store local currency. The Operational insights reports support this in the following way.
For the following reports where amounts are aggregated across stores, if the auditor has stores assigned that have varied local currencies, the amounts are displayed in primary currency only. If all stores have the same common local currency, the amounts are displayed in local currency.
Over/Short Summary Report on Dashboard
Over/Short History Report on Store Day Search Screen
For the following reports where amounts are displayed for a single store selected in the ReSA screen, the values are displayed in the currency selected in the currency toggle of the corresponding ReSA screen (Primary or Local). On screen launch, Local Currency is the default.
Cashier/Register Over Short Report on Store Day Summary Screen
Tender Summary Report on Tender Summary Screen
Allocation Operational Insights reports can be divided into the Dashboard Reports and Contextual BI Reports. These reports are embedded within the Allocation ADF application if the Allocation application has been installed with the Operational Insights turned on. Ad-hoc creation of reports and dashboards utilizing the metrics created in a standalone OBIEE environment by the Administrator is supported.
The data reported and the alert conditions in some of the reports is configurable via a database table. This chapter details out the configuration parameters for OI reports for Allocation.
The ALC_SYSTEM_OPTIONS_OI table drives the configuration parameters for these reports.
Table 2-1 ALC_SYSTEM_OPTIONS_OI
| System Option | Definition |
|---|---|
|
Need Calculation Type |
The Allocated to Plan/Forecast report has the ability to compare the allocated quantity to either the Forecast or the Plan data. Retailers can configure this parameter based on the data they have available for their items. Values - P;F |
|
Simple Promo Only |
When set to 'Y' the promotion flag is displayed only for simple promotions in the PO Arrival report. When set to 'N' the promotion flag is displayed for both simple and complex promotions in the PO Arrival report. |
|
PO Allocation Time threshold |
Number of days before the not after date of the purchase order that the retailer expects a quantity greater than the Percentage Allocated PO Threshold to be allocated. |
|
Percentage Allocated PO Threshold |
The percentage of the warehouse order quantity against the given PO that is expected to be allocated within the PO Allocation Time Threshold defined. |
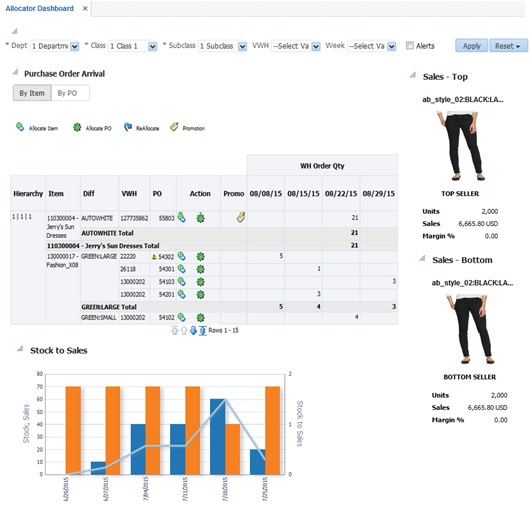
The dashboard surfaces information in a manner that will give allocators visibility to the highest priority tasks, such as incoming POs that need allocating or re-allocating and visibility to potential stock shortages in stores based on sales forecasts. The dashboard also provides a quick way for the allocator to take action on these alerts by launching them contextually into the appropriate Allocation screens.
The dashboard reports can be viewed by navigating to Tasks > Dashboard > Allocator Dashboard in Allocation. The dashboard is the default landing page for Allocation.
Users can filter data across the dashboard reports by selecting appropriate values in the prompts provided. The users can select the department, class, or subclass, along with a virtual warehouse (VWH) from the dashboard which prompts to filter the data displayed in the reports. The Alerts' checkbox can be used to display only the data in the reports that have an alert against it. The week prompt is applied to the PO Arrival report to only view records that have order quantities in the selected week.
Allocator Dashboard Reports:
Purchase Order Arrival Report
Stock to Sales Report
Sales – Top Report
Sales – Bottom Report
The PO Arrival report has two views that the user can choose from:
By Item
By PO
The Purchase Order Arrival - View by Item can be viewed by selecting the 'By Item' toggle.
The report displays the order quantities expected to be received via incoming PO's at the parent item - diff aggregate - virtual warehouse level for fashion items and at item-virtual warehouse level for staple items. The order quantity is listed against the week in which they are expected to be received based on the PO's not after date for the next 4 weeks.
It also indicates if the given parent item - diff aggregate or item is on a promotion during the next 4 weeks providing additional guidance in the allocation process and flag where additional quantities may be required.
An alert is displayed against the POs that have not yet been allocated above the defined Percentage Allocated PO Threshold beyond the PO Allocation Time threshold. For example, if the percentage allocated PO threshold is set to 80% and the PO Allocation Time threshold is set to 5 days and if the order quantity expected to be received is 100 then an alert is displayed for a PO that has a Not After Date that is less than 5 days from today and if the already allocated quantity against the PO is less than 80.
Using the below action links, the allocator can launch the Allocation Maintenance screen to create or edit allocations.
Allocate Item – The user can click on the allocate item icon to initiate a workflow to create an allocation for the specific parent item - diff aggregate (or item) for the quantity expected to be received on the PO. The allocate item icon is displayed only if the quantity against the given item on the PO that is yet to be received has not yet been completely allocated.
Allocate PO – The user can click on the allocate PO icon to initiate a workflow to create an allocation for all items on the Purchase Order for the quantities expected to be received on the PO. The allocate PO is displayed only if the quantity against the PO that is yet to be received has not yet been completely allocated.
Reallocate - The user can click on the Reallocate icon to initiate a workflow to edit an existing allocation associated to the given PO. This is displayed only if an allocation already exists for the given PO. In case multiple allocations exist against the same PO, the allocation that was created most recently will be launched.
The user can click on the purchase order number hyperlink and contextually launch the PO Header Maintenance screen of RMS and view the purchase order details.
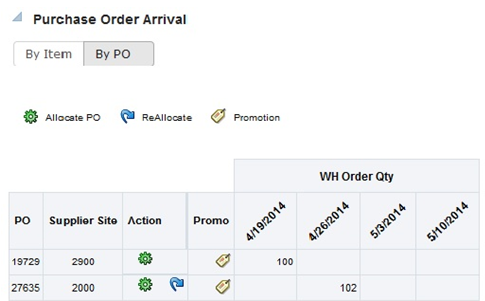
The Purchase Order Arrival - View by PO can be viewed by selecting the 'By PO' toggle.
This report lists the incoming POs and the order quantities that are expected to be delivered in the next 4 weeks based on the PO's not after date.
An alert is displayed against the POs that have not yet been allocated above the defined Percentage Allocated PO Threshold beyond the PO Allocation Time threshold For example, if the percentage allocated PO threshold is set to 80% and the PO Allocation Time threshold is set to 5 days and if the order quantity expected to be received is 100 then an alert is displayed for a PO that has a Not After Date that is less than 5 days from today and if the already allocated quantity against the PO is less than 80. It also indicates if any of the items on the given PO is on a promotion during the next 4 weeks providing additional guidance in prioritizing the allocation process
Using the below action links, the allocator can launch the Allocation Maintenance screen to create or edit allocations.
Allocate PO – The user can click on the allocate PO icon to initiate a workflow to create an allocation for all items on the Purchase Order for the quantities expected to be received on the PO. The Allocate PO link is displayed only if the quantity against the PO that is yet to be received has not yet been completely allocated.
Reallocate - The user can click on the Reallocate icon to initiate a workflow to edit an existing allocation associated to the given PO. This is displayed only if an allocation already exists for the given PO. In case multiple allocations exist against the same PO, the allocation that was created most recently will be launched.
The user can click on the purchase order number hyperlink and contextually launch the PO Header Maintenance screen of RMS and view the purchase order details.
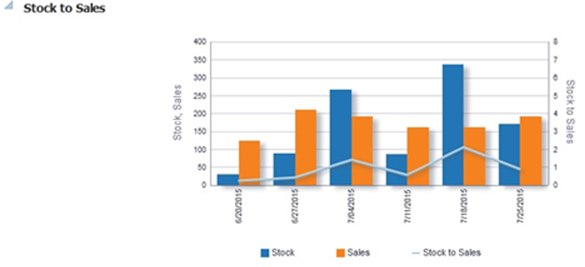
The Stock to Sales report compares the stock available for sale at the beginning of the given week and the corresponding sales achieved by the end of the same week. Data for six weeks prior to the current week can be viewed in this report. The stock and sales is aggregated across all items belonging to the Department/Class/Subclass selected in the prompts and group of stores that source from the selected VWH.
The report also plots the trend of Stock to Sales ratio for six previous weeks to provide historical context to the allocator of the inventory levels in their stores and help gauge where overage or shortage situations occurred.
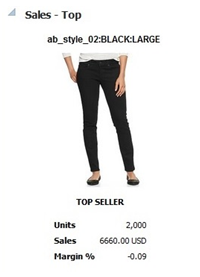
The Sales - Top report displays the top selling item across the Department/Class/Subclass selected in the prompts for a day prior to the current business day.
Additional data on the given item such as the item image, total sales units, retail value of sales and the margin can be viewed.
|
Note: For fashion items, the top seller will represent an item parent - diff aggregate. |
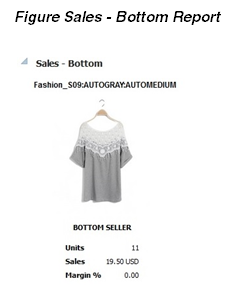
The Sales - Bottom report displays the least selling item across the Department/Class/Subclass selected in the prompts for a day prior to the current business day.
Additional data on the given item such as the item image, total sales units, retail value of sales and the margin can be viewed.
|
Note: For fashion items, the bottom seller will represent an item parent - diff aggregate. |
Contextual BI Reports are displayed in the contextual pane of some Allocation screens. Contextual BI reports provide additional in context insights to the data being viewed in the Allocation screen.
The following Allocation screens have contextual BI reports displayed in the right pane:
Allocation Maintenance Screen
What If Allocation Screen
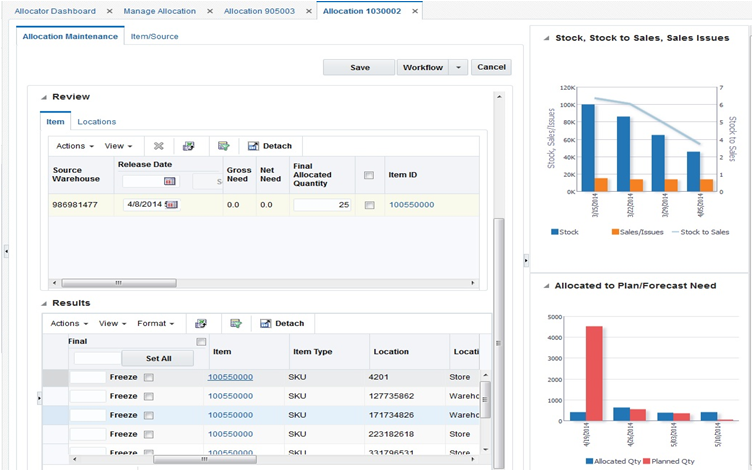
The following are the contextual BI reports displayed on the Allocation Maintenance screen:
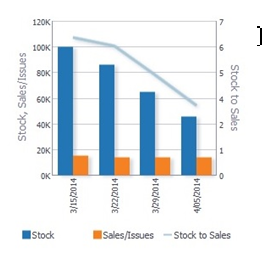
Stock to Sales/Issues Report
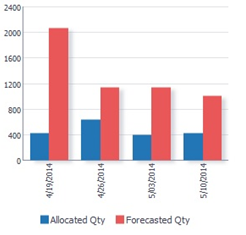
Allocated to Plan/Forecast Report
The stock to Sales/Issues report displays the stock available for sale at the beginning of the given week and the corresponding sales at the given store or issues at the given warehouse achieved by the end of the same week. Data for four weeks prior to the current week can be viewed in this report. The report also plots the trend of Stock to Sales ratio across four previous weeks.
As a user moves between rows in the 'Results' table in the Allocation Maintenance screen, the report will refresh to show information contextual to the item and the 'to' location corresponding to the row highlighted.
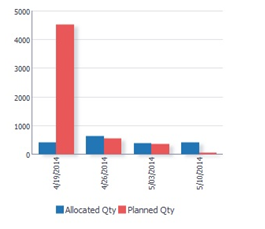
The Allocated to Plan/Forecast report is to be used primarily for pre-season allocation decision-making, before there is stock available at the stores. It shows the relationship between the need at a location, displayed as the sales forecast or sales plan for the next 4 weeks, and the allocations that are scheduled for delivery in those weeks. The forecasted item need is used if the NEED CALCULATION TYPE = Forecast and the plan need is used if NEED CALCULATION TYPE = Plan.
As a user moves between rows in the 'Results' table in the Allocation Maintenance screen, the report will refresh to show information contextual to the item and the 'to' location corresponding to the row highlighted.
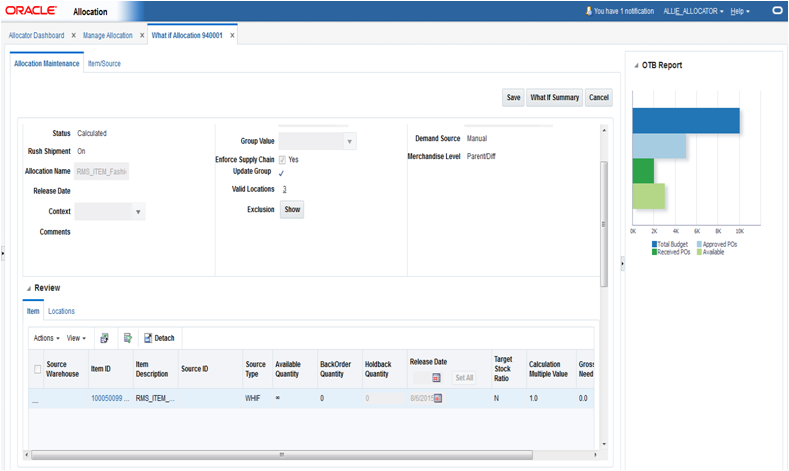
The following are the contextual BI reports displayed on the What If Allocation screen:
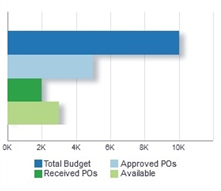
OTB Report
What-if allocations allow an allocator to look at options for creating a PO in Allocation. If the PO is created and approved in RMS, it would impact the OTB budget for the subclass or subclasses of the items present on the PO.
The OTB report provides an early visibility to the allocator on whether there is budget available to create a purchase order for the given item.
It lists the total budget, budget taken up by Approved POs, budget taken up by Received POs and the total remaining (available) budget.
As a user moves between rows in the 'Review' table in the Allocation Maintenance UI, the OTB report will refresh to show information contextual to the subclass of the item corresponding to the row highlighted.
ReIM Operational Insights reports can be divided into the Dashboard Reports and Contextual BI Reports. There reports are embedded within the ReIM ADF application if the application has been installed with the Operational Insights turned on. Ad-hoc creation of reports and dashboards utilizing the metrics created in a standalone OBIEE environment by the Administrator is supported.
The dashboard surfaces information in a manner that will help users (Finance Manager and Accounts Payable specialist) understand invoice match workload, view supplier performance, manage employee workload and provide quick visibility into cost, quantity and tax discrepancies. The dashboard allows the user to contextually launch into the Summary Match, Detail Match and Discrepancy Review list to take quick action on the insights presented.
ReIM Dashboard Reports:
Upcoming Invoices
Automatch Rate
Supplier Site Performance
Employee Workload
Invoices
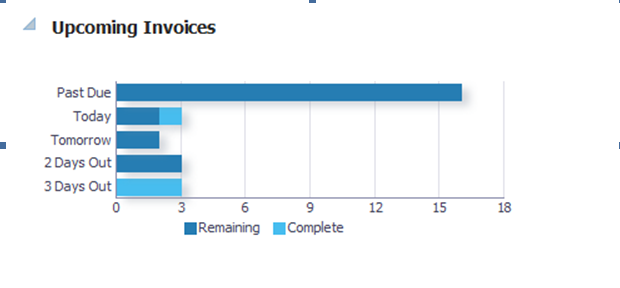
The Upcoming Invoices Report provides visibility into the upcoming workload for either the Accounts Payable Specialist or a group of employees for the Finance Manager.
The report shows the number of Completed and Remaining Invoices with the invoice due date equal to:
Today
Tomorrow
2 days out
3 days out
The report also shows the number of Remaining Invoices with the invoice due date in the past:
Past Due
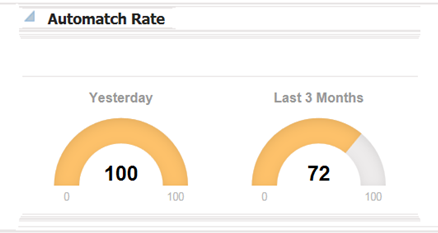
The AutoMatch Rate report will allow the user to quickly see the total number of invoices in matched status that were matched by the automatch batch in comparison with the total number of invoices that were manually matched by the ReIM user. This metric is shown by using a semi-gauge report.
The number shown and represented by the orange bar is the number that is Automatched.
The remaining percentage represented by the light gray bar is the number that was manually matched.
The report will be calculated for the user and can be viewed 2 different ways.
Yesterday
Last 3 months
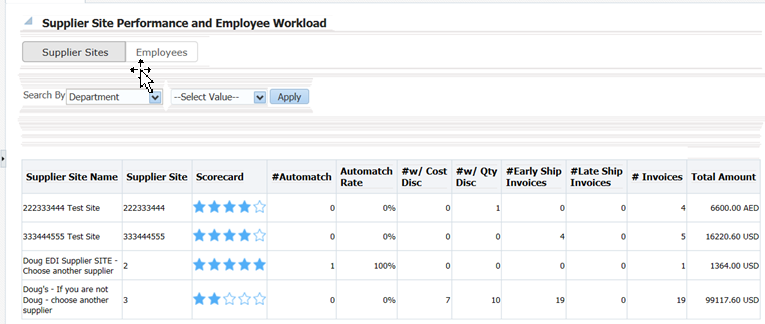
The Supplier site report lists each individual supplier that the employee is responsible for. This is only available on the Finance Manager dashboard. This report serves as a quick glance to see how the supplier site is performing and all the data that is shown is for the past 12 weeks (84 days).
Supplier site
Supplier site ID
Scorecard* (See below for more details)
# Automatch
Auto Match Rate
# w cost discrepancy
# w unit discrepancy
# early ship invoices
# late ship invoices
# invoices
Total amount
User will be able to sort and filter based off of Supplier site ID.
The Finance Manager will see a list of the supplier sites of the employees that roll up to that role.
*Scorecard: The supplier site rating based on certain parameters such as discrepancy occurrence rate, exact matches vs matches within tolerance and shipping performance.
Weightage assigned to each of the criteria will be stored in a configuration table. See Compliance Metric for more details.
Search By: The user has the ability to search by any of the 5 levels below in order to do a quick look up of supplier site performance:
Dept
Class
Subclass
Item
Supplier Site
When the down arrow of the Search By box is clicked; the user will be given the option to select any of the 5 levels. Then they must enter in the ID of the corresponding level they want to search. When they click the Apply box, any supplier site that has items in the level that was searched will be returned for review of their performance. This search gives the Finance Manager a way to search at the hierarchy level or supplier site for ease of use.
If the user enters an incorrect ID for any of the levels, an error message will be provided letting the user know that the ID entered is inaccurate.
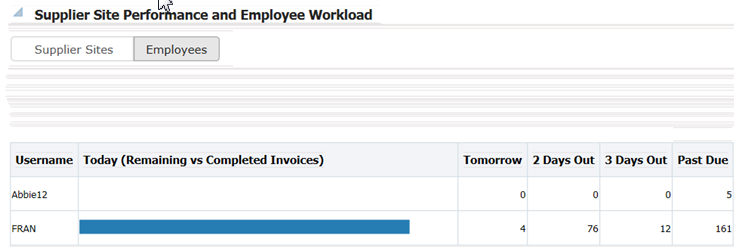
On the Finance Manager dashboard, this user has the option to toggle between the supplier site performance report and the employee workload report. The employee workload report provides a way for the finance manager to track their employee's performance. This report is not available on the Accounts Payable Specialist Dashboard.
The Finance Manager will see a list of employees that report to them and date for 5 data ranges associated with manual matching of invoices.
Invoices due needing manual matching will be shown for the following time ranges, and in this order:
Today (Remaining vs Completed)
Tomorrow
2 days out
3 days out
Past due
For the Today (Remaining vs Completed) column, there is a horizontal bar graph that shows the Completed vs. Remaining workload for each employee.
Completed Invoices: The blue horizontal bar represents the number invoices that have already been completed by manual matching.
Remaining Invoices: The light gray horizontal shaded bar represents the remaining workload that the employee needs to match.
For the Remaining time frame, ie: Tomorrow, 2 Days out, 3 Days out and Past Due columns, the data is represented as a number that is the remaining invoices that each employee is responsible for.
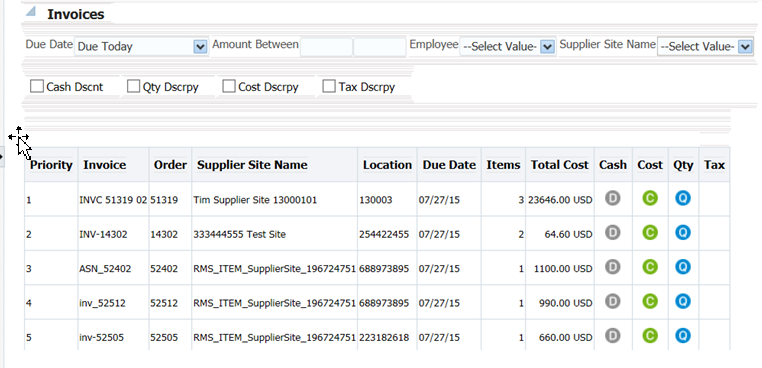
The main purpose of the Invoices report is to allow the Accounts Payable team to manage their work-load. The list of invoices can be sorted and filtered to allow the user to resolve and match the highest priority invoices first.
The report will be initially sorted based on a pre-determined set of criteria that is listed below but the user can use the sort and filter capability to change the way the invoices are sorted.
The columns that are displayed to the user and available for viewing are as follows and are further detailed in the Metrics section of this document.
Priority (detailed below)
Invoice
Order
Supplier site Name
Location
Due Date
Items
Total Cost
Cash Discount
Cost
Qty
Tax
The filter bar allows a drop down selection by the following filters:
Due date (Due today, Past Due, Due tomorrow, 2 days out, 3 days out)
Amount
When user clicks the Amount filter, they will be given a pop-up where they can enter a range of Invoice Cost amounts to filter the invoices that are displayed. User can enter lower and/or upper threshold for filtering. If lower or upper threshold are left blank, filter will assume either 0 or max Invoice cost amount.
Employee
Supplier site
The user is also able to apply a filter and include only invoices with a Cash Discount, Cost Discrepancy, Qty Discrepancy or Tax Discrepancy. These filters should be multi-select.
On the Invoices report there are 3 opportunities for the user to contextual launch directly into the ReIM application for discrepancy resolution or invoice matching. In all 3 instances, we need to pass certain parameters to ReIM for ease of navigation.
TAX Discrepancy: When the user clicks on the TAX icon (T) on the Invoices Report, they will be launched into the Tax Discrepancy Review List in the ReIM application. If the RMS system setting has a tax type= sales, then the Tax Discrepancy filter or the Tax column will not be visible on the report.
|
Note: When there is a Tax Discrepancy, the contextual launch for Invoice ID will be disabled as the user will not be able to match an invoice that has a tax discrepancy. |
Parameters: None
When user launches to the Tax Review list, they will see all invoices associated with their ID that have tax discrepancies.
Cost and Qty Discrepancy: When the user clicks on either the Cost (C) Or Qty (Q) discrepancy on the Invoices Report, they will be launched into the Discrepancy Review List in the ReIM Application. From this screen they will be able to resolve discrepancies for items on the invoice. If discrepancies are resolved for all items on an invoice, the invoice goes to a matched status.
Parameters: Document ID
Summary Match Screen: When user clicks on the invoice number in the Invoices report, they will be launched into the Summary Match screen in the ReIM application. On the Summary Match screen, the user will be able to match invoices.
Parameters: PO number, Location, Document ID Supplier ID, Supplier Site ID
The priority metric that will be used to sort invoices is based on pre defined criteria. By using the priority invoice sorting, invoices having the highest priority are brought to the users attention first thus helping them prioritize their work for the day and pick the most important invoices first for manual matching and for discrepancy resolution. The following metrics are considered for deriving the priority of the invoice:
Due Date (in order of: Past due, Due today, Due tomorrow 2 days out, 3 days out)
Cash Discount= Y
Total Cost amount (Descending order)
Cost Discrepancy= Y
Unit Discrepancy= Y
Group by date in this order: Past Due, Today, Tomorrow, 2 days out, 3 days out.
Within each group, show invoices with a cash discount first. Within the cash discount invoices show highest Total cost invoices first then descending order.
For invoices not having cash discount, prioritize the ones having cost discrepancy and unit discrepancy first, the ones with only cost discrepancy next and then the ones with only unit discrepancy last. Within each group prioritize by the Total Cost of the invoice in descending order.
The next group will be Invoices due today, use the same logic to prioritize these next.
Contextual BI Reports are displayed in the contextual pane of some ReIM screens. Contextual BI reports provide additional in context insights to the data being viewed in the ReIM screen.
The following ReIM screens have contextual BI reports displayed in the right pane:
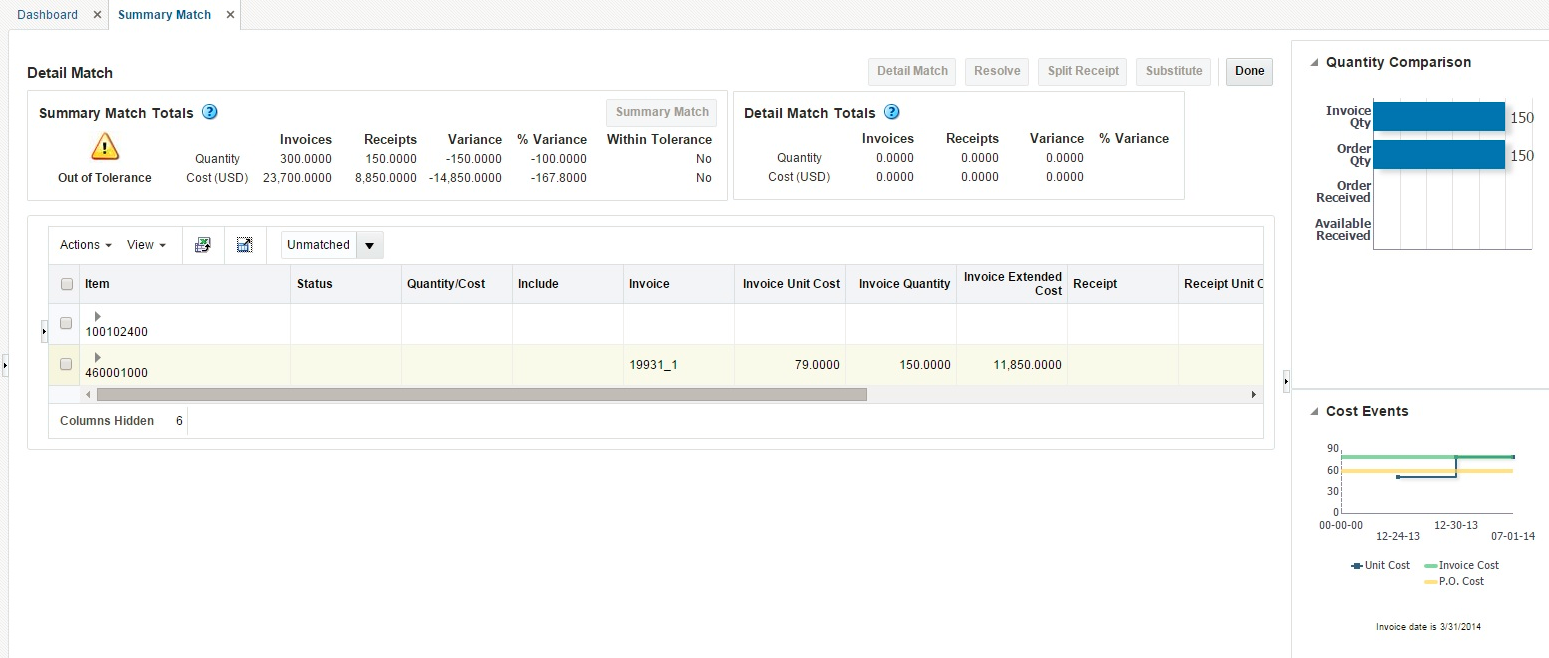
Detail Match
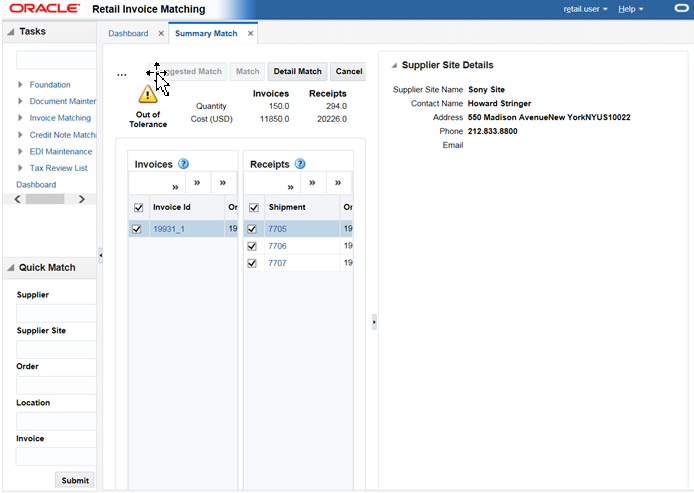
Summary Match
Discrepancy Match
The following are the contextual BI reports displayed on the detail match screen:
Quantity Comparison
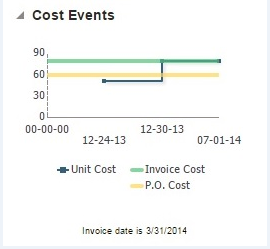
Cost Events
The following are the contextual BI reports displayed on the Summary Match screen:
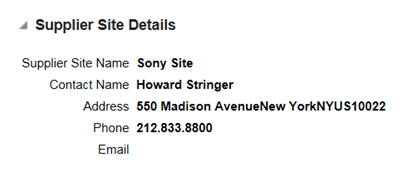
Supplier Site Details
The following are the contextual BI reports displayed on the discrepancy screen:
Supplier Site Details
Cost Events
Quantity Comparison
The Supplier Site Details report will provide the user necessary information to get in contact with the supplier site they are working with. This report will be visible in the BI pane when the user is in the Discrepancy screen as well as the Summary Match screen.
The details provided in the report are as follows:
Supplier Name
Contact Name
Address
Phone number
Email address
This report will provide the user visibility into the last 2 cost changes and one in the future using the approval date of the invoice date as a reference. This may help explain why an invoice has a cost variance in the ReIM application. This report is visible when user is on the discrepancy screen and when user is on the Detail match screen.
The X axis of the report shows the dates that the cost changes either occurred or will occur and the Y axis shows the price points of the cost events. There are 2 lines that represent both the P.O. Cost and the Invoice cost of the invoice that is selected so the user can see where the variance is.
There are 3 cost events displayed; using the Purchase Order date as the reference. There are 2 past cost changes and 1 future cost event.
The Detail Match Screen is a 3 tiered table, If a style row is in focus, the report is refreshed but will not show any data. If the SKU row is in focus, the report is refreshed and PO Cost and Invoice cost will update based on the SKU. If the focus is on a row below the SKU level, the report is not refreshed. The Discrepancy Review List is a single hierarchy table sowing the sku row, so the report will always be based on the row in focus.
Invoice Date: The Invoice date is listed and plotted on the graph using a tic mark. If the invoice date is outside of the cost changes listed (before first or after last), the tic mark will be right outside of the graph so it will not impact the scale of the graph.
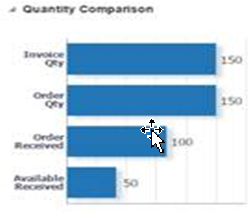
This Report gives the user a quick glance at where the discrepancy lies in terms of Quantity.
The report is visible when user is on the Discrepancy screen in ReIM and when user is on the Detail match screen.
The report is made up of 4 horizontal bars:
Invoice Qty
P.O. Ordered Qty
P.O. Received Qty
Available Received Qty
On the bar graph, show the numerical value for each metric, all bar graphs are the same color but the size of the bar will reflect the variances.
When the user is on the Detail Match screen and they have the focus on the sku row, the report will populate that date for that sku. If a style row is in focus, the report will not be populated. The Discrepancy Review List is a single hierarchy table showing the sku row, so the report will always be based on the row in focus.