Understanding the Experiment Results
This section shows how to use both the er_print command line and Thread Analyzer to display the following information about each detected data race:
-
The unique ID of the data race.
-
The virtual address, Vaddr, associated with the data race. If there is more than one virtual address, then the label Multiple Addresses is displayed in parentheses.
-
The memory accesses to the virtual address, Vaddr by two different threads. The type of the access (read or write) is shown, as well as the function, offset, and line number in the source code where the access occurred.
-
The total number of call stack traces associated with the data race. Each trace refers to the pair of thread call stacks at the time the two data race accesses occurred.
If you are using Thread Analyzer, the two call stacks are displayed in the Race Details window when you select an individual call stack trace in the Races view. If you are using the er_print utility, the two call stacks will be displayed by the rdetail command.
Data Races in prime_omp.c
To examine data races in prime_omp.c, you can use one of the experiments you created in Create a Data-Race-Detection Experiment.
To show the data race information in the prime_omp_instr.er experiment with er_print, type the following command.
% er_print prime_omp_inst.er
At the (er_print) prompt, type races to see output similar to the following:
(er_print) races

Total Races: 4 Experiment: prime_omp_inst.er

Race #1, Vaddr: 0x21850
    Access 1: Write, line 25 in "prime_omp.c",
                   is_prime
    Access 2: Read, line 22 in "prime_omp.c",
 is_prime
 Total Callstack Traces: 1

Race #2, Vaddr: (Multiple Addresses)
         Access 1: Write, line 49 in "prime_omp.c",
                   main
    Access 2: Write, line 49 in "prime_omp.c",
                   main
 Total Callstack Traces: 1

Race #3, Vaddr: 0xffbff534
         Access 1: Write, line 50 in "prime_omp.c",
                   main
    Access 2: Read, line 49 in "prime_omp.c",
                   main
 Total Callstack Traces: 1

Race #4, Vaddr: 0xffbff534
         Access 1: Write, line 50 in "prime_omp.c",
                   main
    Access 2: Write, line 50 in "prime_omp.c",
           main
Total Callstack Traces: 1
(er_print)
Four data races occurred during this particular run of the program.
To open the prime_omp_inst.er experiment in Thread Analyzer, type the following command:
% tha prime_omp_inst.er
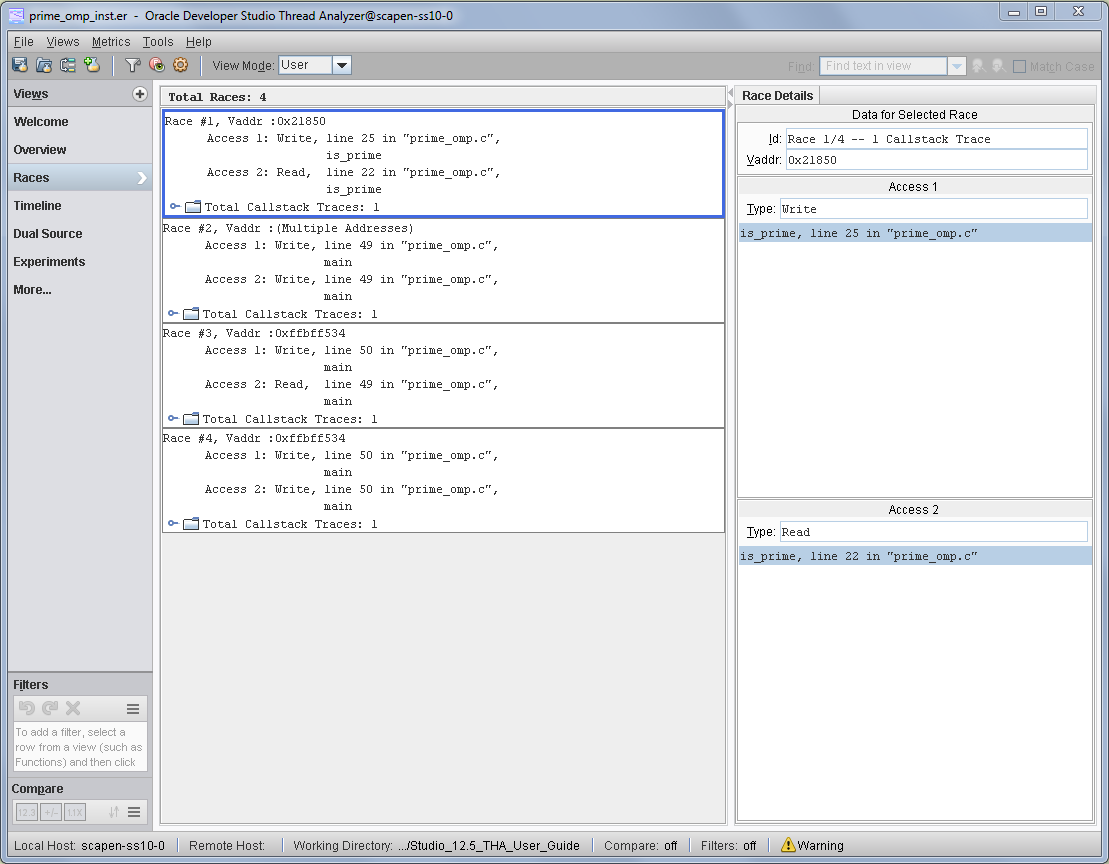
The following screen shot shows the races that were detected in prime_omp.c as displayed by Thread Analyzer.
Figure 1 Data Races Detected in prime_omp.c
-
Race #1 shows a race between a write in the functionis_prime() on line 25 and a read in the same function on line 22. If you look at the source code, you can see that on these lines the pflag[ ] array is being accessed. In Thread Analyzer, you can click the Dual Source view to easily see the source code at both line numbers along with metrics showing the number of race accesses on the affected lines of code.
-
Race #2 shows a race between two writes on line 49 in the main function. Click the Dual Source view to see that there are multiple attempts to access elements of the primes [ ] array on line 49. Race #2 represents a group of data races that occur in different elements of the array primes[ ]. This is indicated by the Vaddr specified as Multiple Addresses.
-
Race #3 a race between a write in the main function on line 50 and a read in the same function on line 49 . If you look at the source code, you can see that on these lines the variable total is being accessed.
-
Race #4 shows a race between two writes on line 50 in the main function. If you look at the source code you can see that on these lines the variable total is being updated.
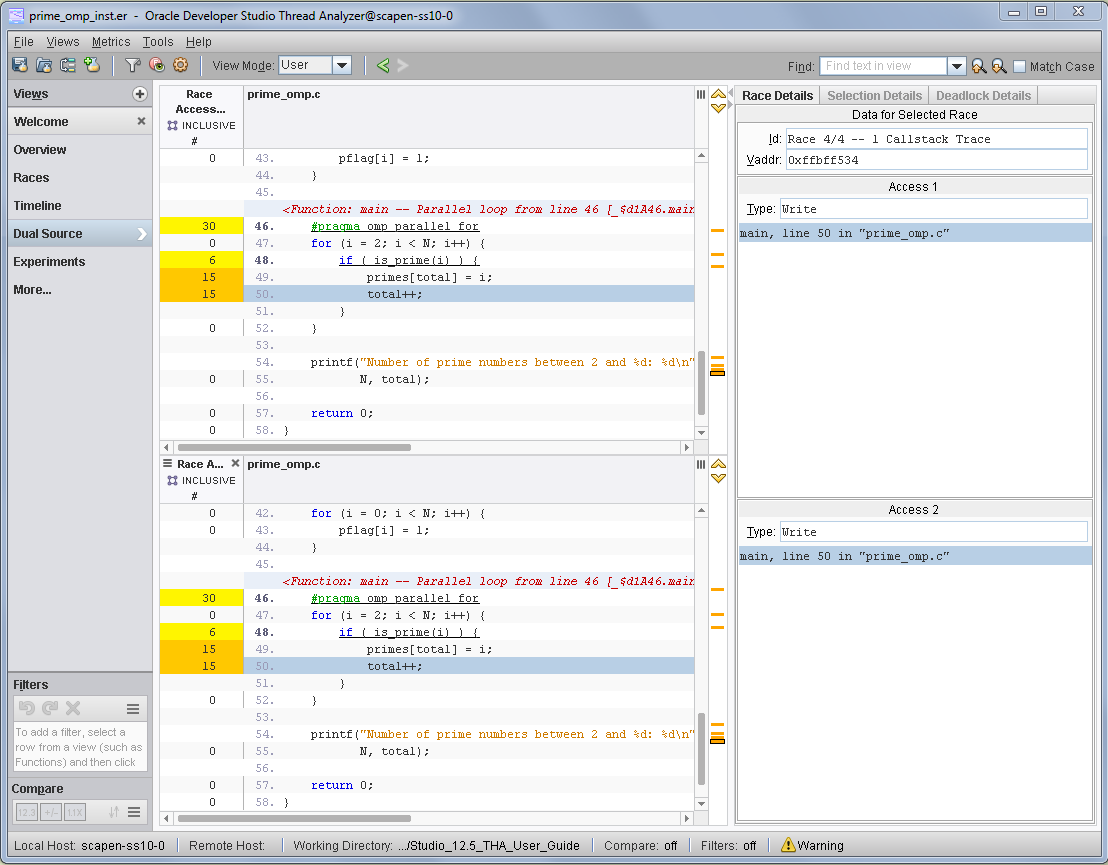
The Dual Source view in Thread Analyzer enables you to see the two source locations associated with a data race at the same time. For example, select Race #1 for prime_omp.c in the Races view, and then click on the Dual Source view. You will see something similar to the following.
Four data races are shown in prime_omp.c:
The Dual Source view in Thread Analyzer enables you to see the two source locations associated with a data race at the same time. For example, select Race #3 for prime_pthr.c in the Races view and then click on the Dual Source view. You will see something similar to the following.
Figure 2 Source Code of Data Races Detected in prime_omp.c
Data Races in prime_pthr.c
To examine data races in prime_pthr.c, you can use one of the experiments you created in Create a Data-Race-Detection Experiment.
To show the data race information in the prime_pthr_instr.er experiment with er_print, type the following command:
% er_print prime_pthr_inst.er
At the (er_print) prompt, type races to see output similar to the following:
(er_print) races

Total Races:  5 Experiment:  prime_pthr_inst.er

Race #1, Vaddr: (Multiple Addresses)
Access 1: Write, line 26 in "prime_pthr.c",
          is_prime + 0x00000234
Access 2: Write, line 26 in "prime_pthr.c",
          is_prime + 0x00000234
Total Callstack Traces: 2

Race #2, Vaddr: 0xffbff6dc
Access 1: Write, line 59 in "prime_pthr.c",
          main + 0x00000208
Access 2: Read, line 39 in "prime_pthr.c",
          work + 0x00000070
Total Callstack Traces: 1

Race #3, Vaddr: 0x21620
Access 1: Write, line 44 in "prime_pthr.c",
          work + 0x000001C0
Access 2: Read, line 43 in "prime_pthr.c",
        work + 0x0000011C
Total Callstack Traces: 2

Race #4, Vaddr: 0x21620
Access 1: Write, line 44 in "prime_pthr.c",
          work + 0x000001C0
Access 2: Write, line 44 in "prime_pthr.c",
          work + 0x000001C0
Total Callstack Traces: 2

Race #5, Vaddr: (Multiple Addresses)
Access 1: Write, line 43 in "prime_pthr.c",
          work + 0x00000174
Access 2: Write, line 43 in "prime_pthr.c",
          work + 0x00000174
Total Callstack Traces: 2
(er_print)
Five data races occurred during this particular run of the program.
To open the prime_pthr_inst.er experiment in Thread Analyzer, type the following command:
% tha prime_pthr_inst.er
The following screen shot shows the races detected in prime_pthr.c as displayed by Thread Analyzer. Notice that they are the same as the races shown by er_print.
Figure 3 Data Races Detected in prime_pthr.c
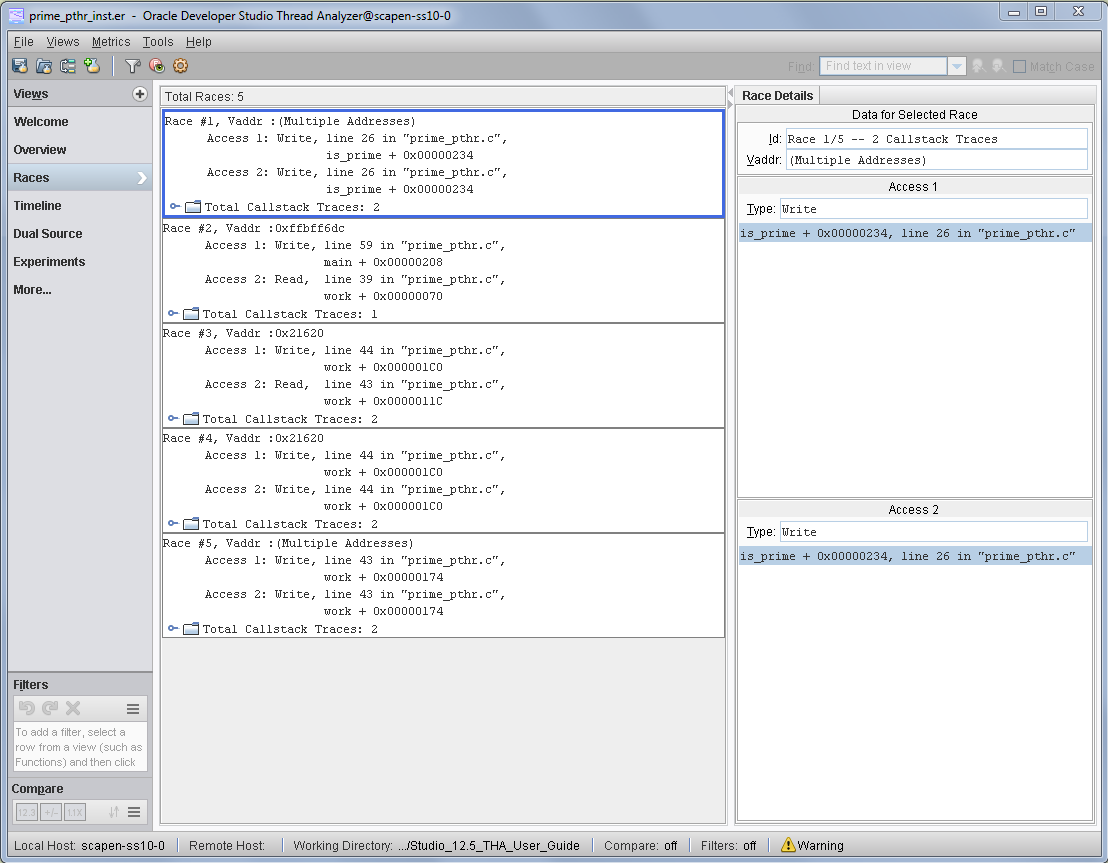
Five data races are shown in prime_pthr.c:
-
Race #1 is a data race between two writes to an element of the pflag[ ] array in function is_prime() on line 26.
-
Race #2 is a data race between a write on line 59 to the memory location named i in main() and a read on line 39 of the same memory location named *arg in work().
-
Race #3 is a data race between a write to total on line 44 and a read of total on line 43.
-
Race #4 is a data race between a write to total on line 44 and another write to total on the same line.
-
Race #5 is a data race between two writes on line 43 in the main() function. Race #5 represents a group of data races that occur in different elements of the array primes[ ]. This is indicated by the Vaddr specified as Multiple Addresses.
If you select Race #3 and then click the Dual Source view, you see the two source locations, similar to the following screen shot.
Figure 4 Source Code Details of a Data Race
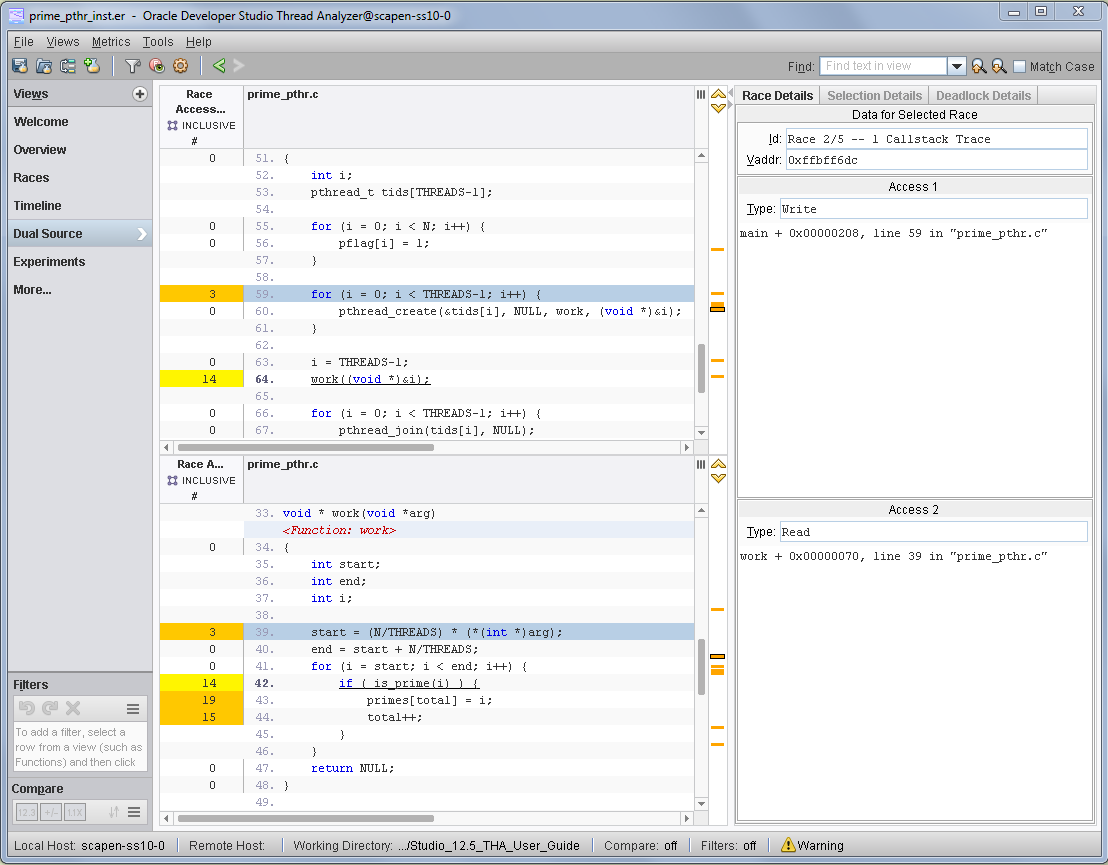
The first access for Race #2 is at line 59 and is shown in the top panel. The second access is at line 39 and is shown in the bottom panel. The Race Accesses metric is highlighted at the left of the source code. This metric gives a count of the number of times a data race access was reported on that line.
Call Stack Traces of Data Races
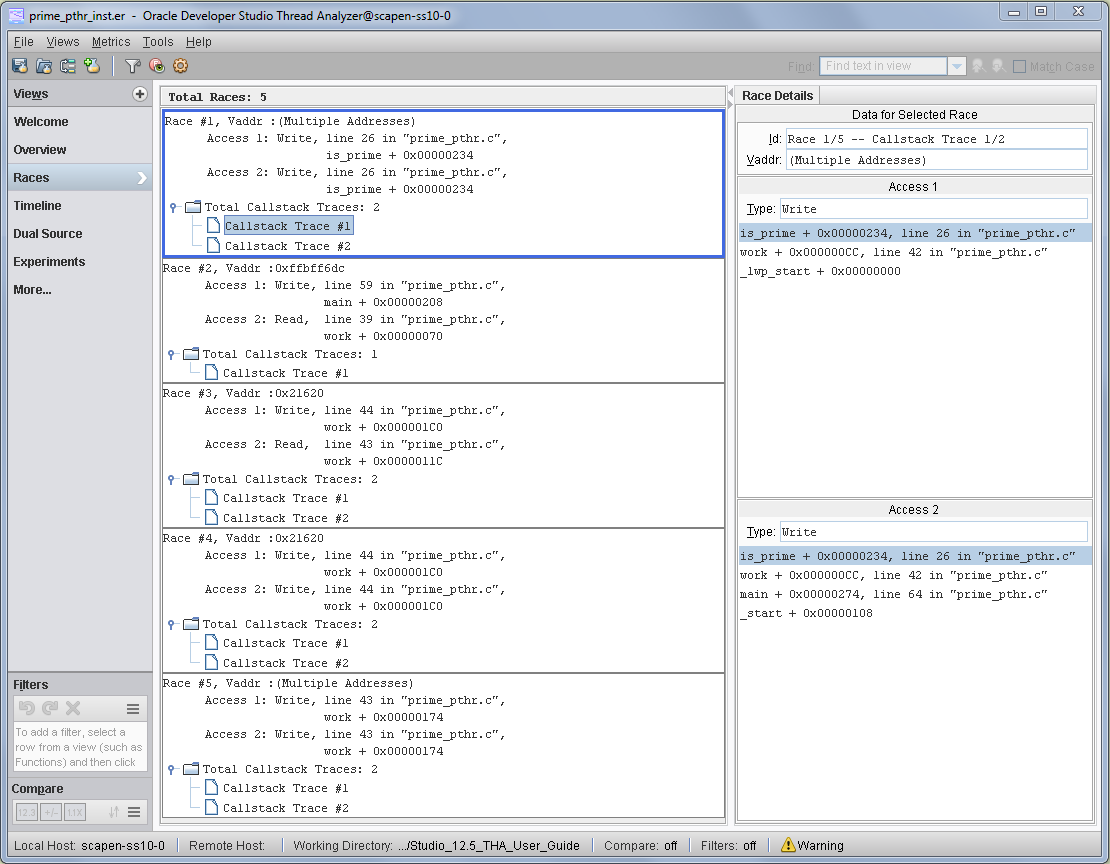
Each data race listed in the Races view of Thread Analyzer also has one or more associated Call Stack Traces. The call stacks show the execution paths through the code that lead to a data race. When you click a Call Stack Trace, the Race Details window in the right panel shows the function calls that lead to the data race.
Figure 5 Races View with Call Stack Traces for prime_omp.c
