| Oracle® Retail Sales Audit (ReSA) User Guide Release 16.0 E78113-02 |
|


 Previous |
 Next |
ReSA Operational Insights reports can be divided into the Dashboard Reports and in-context BI Reports. These reports are embedded within the ReSA application.
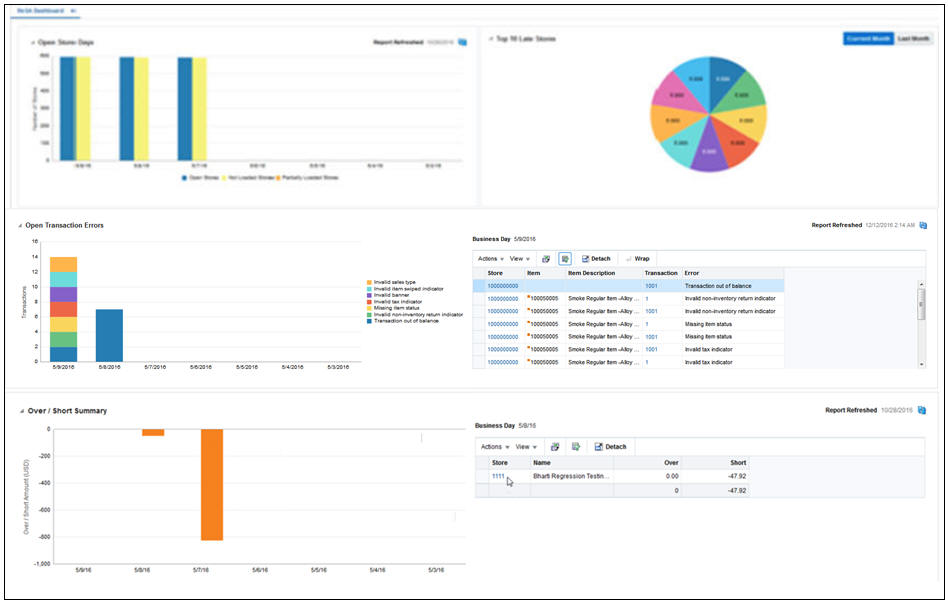
The dashboard surfaces information in a manner that will help users - sales auditors - prioritize their day-to-day activities as well as quickly identify areas of concern. The dashboard allows a user to look at a consolidated view of their 'to-dos' and then directly and contextually launch into the corresponding windows to take an action. The Dashboard Reports show data across assigned stores that is the stores assigned to the logged in user.
Through the dashboard, a Sales Auditor can at a glance identify store days that are still open due to errors or late polling by stores and can resolve or escalate the issues.
A view of all open transactional errors across his stores for the last seven days is available that helps him see error patterns and helps estimate his workload in fixing them. The auditor can then start fixing the errors by launching the respective windows directly from the links provided in the dashboard reports.
The over short summary report helps the sales auditor in the important function of tracking the overages or shortages at his stores and identifying fraudulent behavior.
The dashboard reports can be viewed by navigating to Reports menu > ReSA Dashboard.
The Open Store Days report indicates a sales auditor's open store days and whether they have not been audited, not been loaded or only partially loaded for the last seven days. There are three different actions that can be taken from this report:
Click 'Open Stores' bar in the report and the report contextually launches into the Store Day Search window. Therefore, the window is auto-populated for all store-days with a status of 'Sales Audit In-Progress'.
You will also be able to click 'Not Loaded Stores' bar in the report and the report contextually launches into the Store Day Search window. Therefore, the window is auto-populated for all store-days with a status of 'Ready for Import.'
Click 'Partially Loaded Stores' bar in the report and the report contextually launches into the Store Day Search window. Therefore, the window is auto-populated for all store-days with a status of Partially Loaded.
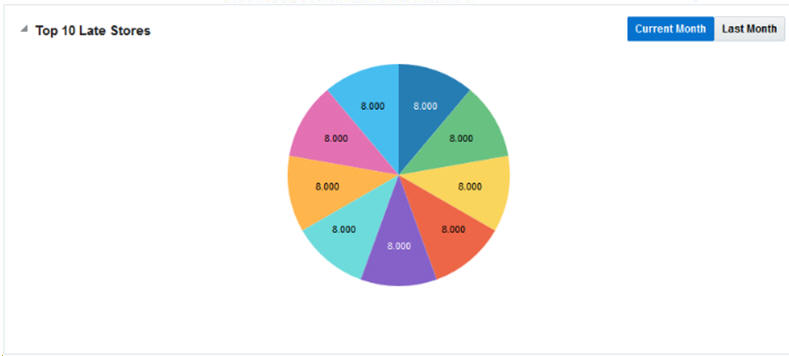
The Top 10 Late Stores report gives the auditor a view of the 10 stores that have the highest number of late polling days in the current or last month. This report shows the count of store days in status Ready to Import or Partially Loaded per store for the Current Month or Last Month based on view selected. Based on this analysis the Auditor can contact these stores or escalate them as high issue stores to management.
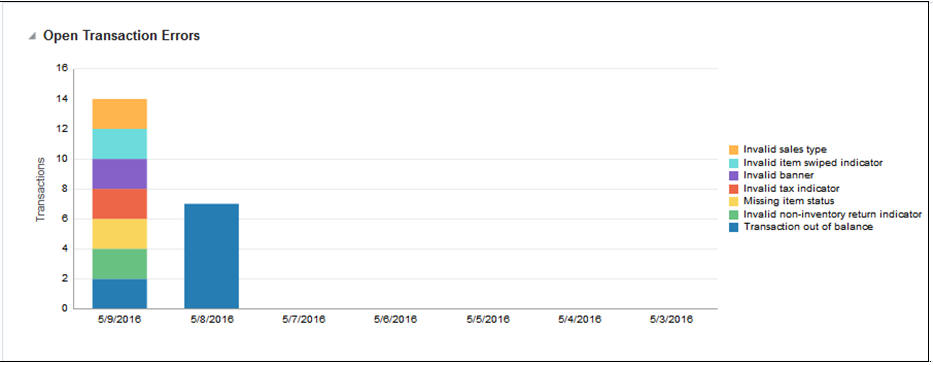
The Open Transaction Errors report displays the number of open transactional errors across all stores color coded by error code over the last seven days.
You can hover over a section of the stacked bar to see the count of errors for a given error code on a given business date.
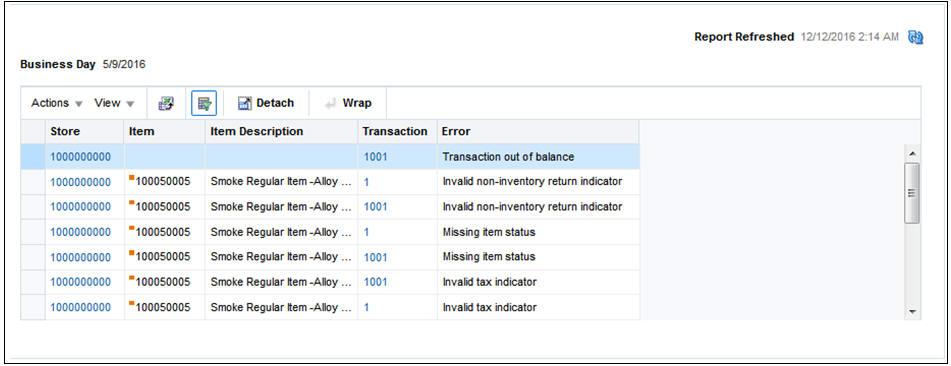
Click the stacked bar for a specific business day to refresh the tabular detail report on the right. The tabular report shows the store, item and transaction number details of all errors existing for the given business date.
Click the data in the Store column in the Open Transaction Error detail table and is contextually launched into the Transaction Search window. The window is auto populated with all transactions for the given store and business date where transaction level errors exist.
Click the data in the Transaction column in the open transaction error detail table and is contextually launched into the Transaction Maintenance window for the given transaction. The window is launched either in the View mode or Edit mode based on the privileges that role has.
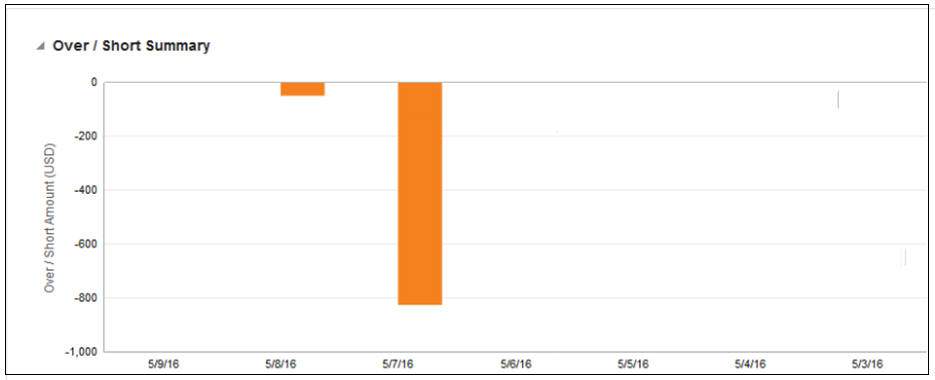
The Over/Short Summary report displays the sum of overage amounts for all stores that have an over amount and the sum of shortage amounts for all stores that have a short amount per business day for the last seven days.
Click the over or short bar for a given business day which refreshes the tabular detail report on the right. The tabular report shows the store and the corresponding over amount or short amount for the store and given business day.
If the over amount or short amount at a store exceeds the configured threshold amount, a warning symbol is displayed against the given row.
|
Note: The threshold for over amount and short amount can be configured through setting of system options. |
If the stores have varied local currencies, the amounts are displayed in primary currency only. If all stores have the same common local currency, the amounts are displayed in local currency.
Click the data in the Store column in the Over/Short Detail report and is contextually launched into the Store Day Audit window with the Over/Short Totals tab highlighted for the selected store and business day. The window is launched either in the 'View' mode or 'Edit' Mode based on the privileges of the user.
In-context BI Reports are displayed in in-context pane of some windows. In-context BI reports provide additional in-context insights to the data being viewed in the window.
The following windows have in-context BI reports displayed in the right pane:
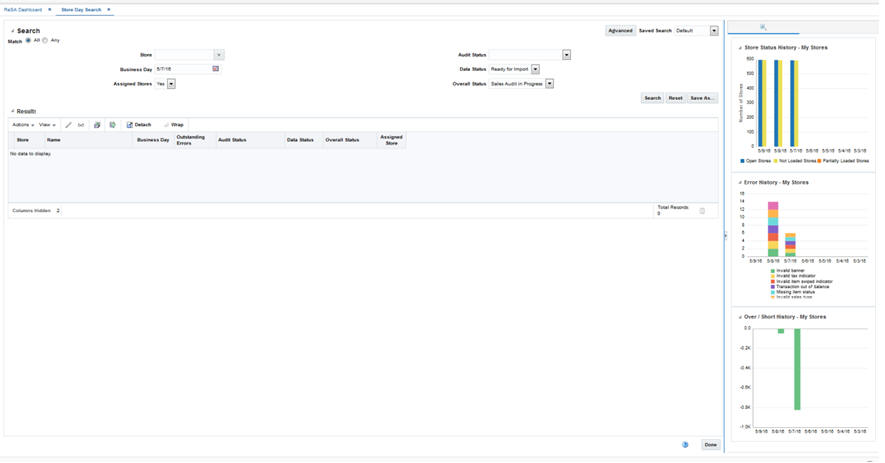
Store Day Search window
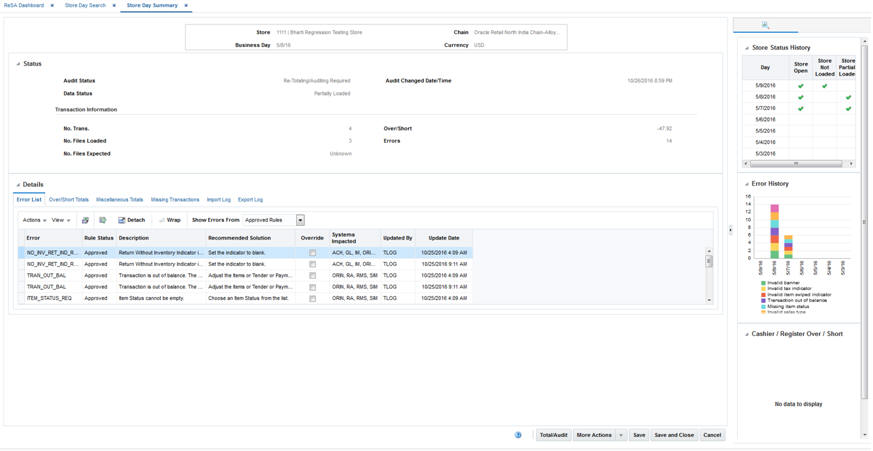
Store Day Summary window
Transaction Maintenance window
Tender Summary window
The following are in-context BI reports displayed on the Store Day Search window:
Store Status History Report
Error History Report
Over/Short History Report
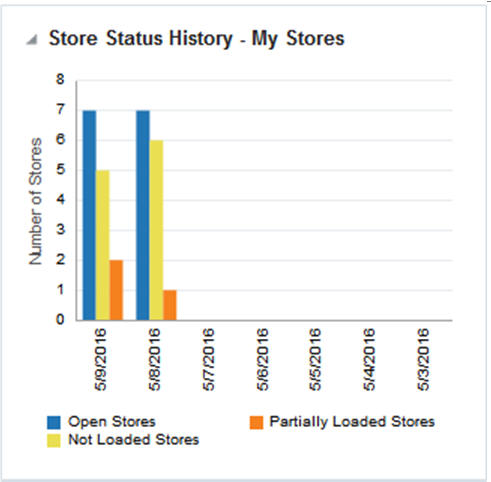
The Store Status History report on Store Day Search window indicates a sales auditor's open store days and represent them by color codes whether they have not been audited, not been loaded or only partially loaded for the last seven days. You can also hover over the bar charts to view the count.
The Error History report on Store Day Search window indicates the total number of errors for all auditor stores per business day for the last seven days. The error count includes current open errors and errors that were resolved. This would give the auditor insight into the occurrence of similar kinds of errors in the past that were resolved or that are still open. The errors are color coded by error code.
You can hover over the respective section of the chart to view the error count for the given error code.
The Over/Short Summary report displays the sum of overage amounts for all stores that have an over amount and the sum of shortage amounts for all stores that have a short amount per business day for the last seven days.
If the stores have varied local currencies, the amounts are displayed in primary currency only. If all stores have the same common local currency, the amounts are displayed in local currency.
The following are in-context BI reports displayed on the Store Day Summary window:
Store Status History Report
Error History Report
Cashier/Register Over Short Report
The Store Status History report on Store Day Summary window indicates the presence of not audited store days, not loaded store days, and partially loaded store days across the last seven days for the store that is being viewed in Store Day Summary window. An indicator signifies if the given store is not audited, is not loaded or is partially loaded for the last seven business days.
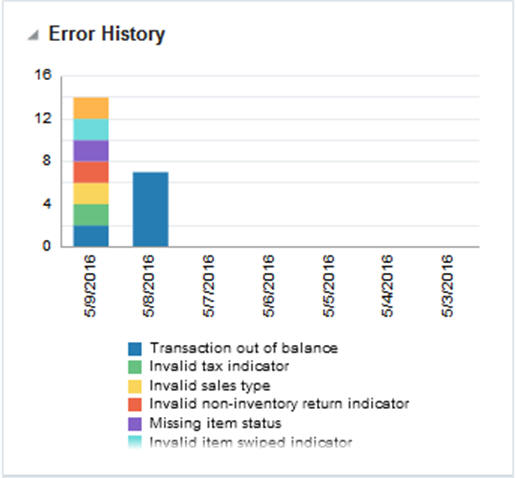
The Error History report on Store Day Summary window indicates the pattern of the errors existing for the store day being viewed in the Store Day Summary window.
The report indicates the number of occurrences of errors similar to the errors open for the selected store day over the last seven days.
The error count includes both open errors and errors that were resolved for the store days. This would give the auditor insight into the occurrence of similar kinds of errors in the past that were resolved or that are still open. The errors are grouped and color coded by error code.
You can hover over a section of the chart to view the error count for the given error code and business day.
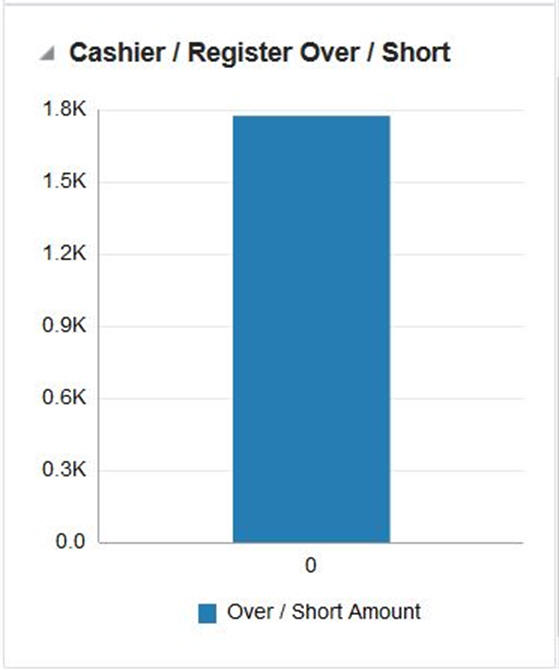
The Cashier/Register Over Short report on Store Day Summary window displays the overage or shortage amounts by cashier for the given store - business day being viewed in the Store Day Summary window if the system option - Balance Level Indicator is set to Cashier.
The report displays the overage or shortage amounts by register for the given store - business day being viewed in the Store Day Summary window if the system option - Balance Level Indicator is set to Register.
The amounts in the report are displayed in the RMS primary currency or the store's local currency based on the currency toggle in the store day summary window.
The following are in-context BI reports displayed on the Transaction Maintenance window:
Error History Report
Item Errors Report
The Error History report on Transaction Maintenance window indicates the pattern of the errors existing for the transaction being viewed over the last seven business days. The report indicates the number of occurrences of errors similar to the errors open for the selected transaction for the given store over the last seven days.
The error count includes both open transactional errors and transactional errors that were resolved. This would give the auditor insight into the occurrence of similar kinds of errors in the past that were resolved or that are still open. The errors are grouped and color coded by error code.
You can hover over a section of the chart to view the error count for the given error code and business day.
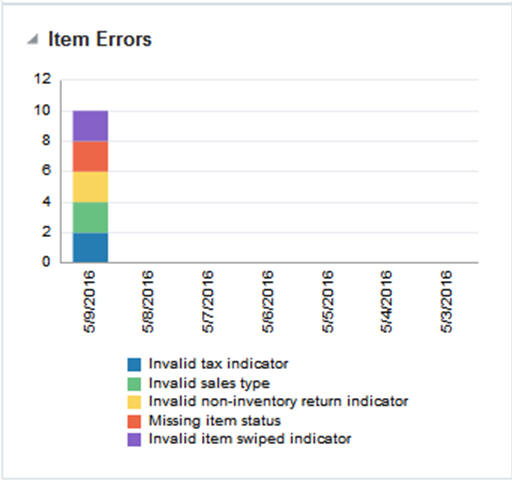
This Item Errors report on Transaction Maintenance window indicates the pattern of the errors existing for the item selected on the window for the given store over the last seven business days. The report indicates the number of occurrences of errors similar to the errors open for the selected item for the given store over the last seven days.
The error count includes both open errors and errors that were resolved. The errors are grouped and color coded by error code.
You can hover over a section of the chart to view the error count for the given error code and business day for the selected item.
|
Note: Only item level errors (that is, errors with rec_type = TITEM, IDISC, IGTAX) are considered in this report. |
The report appears only when an item is selected in the Items panel of the Transaction Maintenance window.
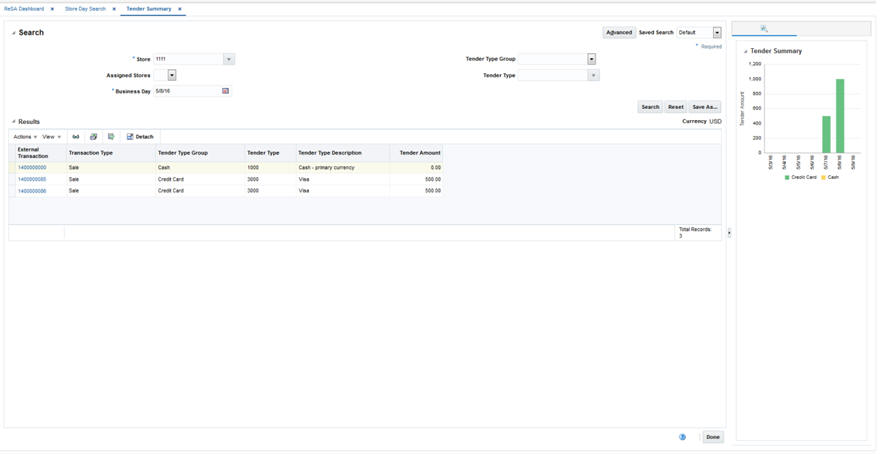
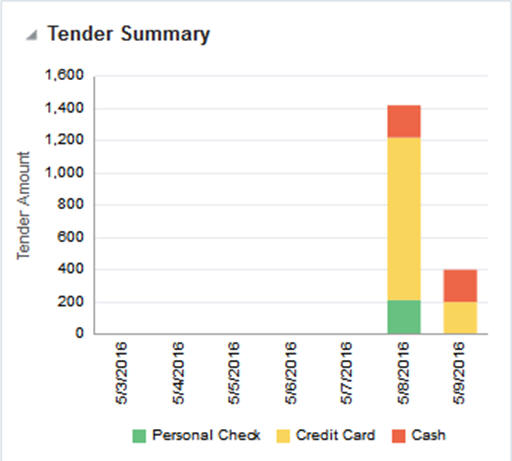
The following are in-context BI reports displayed on the Tender Summary window:
Tender Summary Report
The Tender Summary report on Tender Summary window displays the net tender amount by tender types -Cash, Credit Card and Check per business day over the last seven days for the store selected in Tender Summary window.
The amounts in the report are displayed in the primary currency or the store's local currency based on the currency toggle in the Tender Summary window.
|
Note: The report appears only after the search has been executed. |