Go to primary content
User Data Repository Alarms, KPIs, and Measurements
Release 12.4
E82598-01
Go To Table Of Contents
Contents

Previous
Previous
Next
Next

Alarms and events defined

Alarms provide information pertaining to a system's operational condition that a network manager may need to act upon. An alarm might represent a change in an external condition, for example, a communications link has changed from connected to a disconnected state. Alarms can have these severities:
  • Critical
  • Major
  • Minor
  • Cleared — An alarm is considered inactive once it has been cleared, and cleared alarms are logged on the Alarms & Events > View History page.

Events note the occurrence of an expected condition, such as an unsuccessful login attempt by a user. Events have a severity of Info and are logged on the View History page.

Figure 3-1 shows how alarms and events are organized in the application.

Figure 3-1 Flow of Alarms

Alarms and events are recorded in a database log table. Application event logging provides an efficient way to record event instance information in a manageable form, and is used to:
  • Record events that represent alarmed conditions
  • Record events for later browsing
  • Implement an event interface for generating SNMP traps

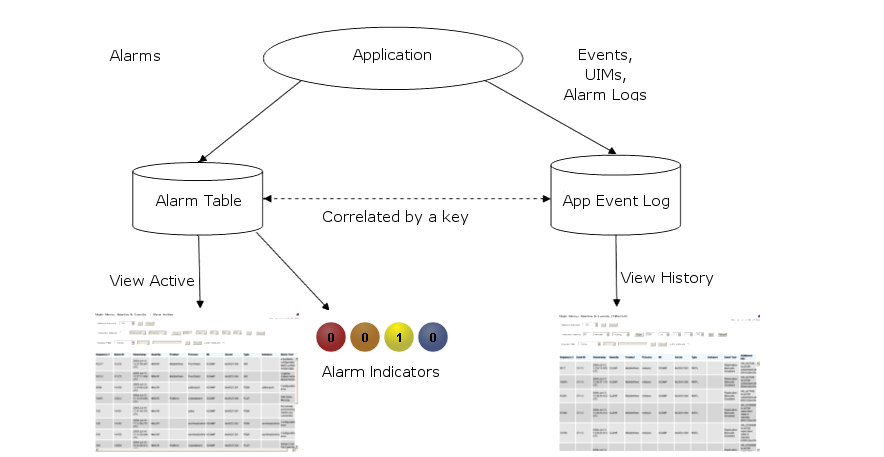
Alarm indicators, located in the User Interface banner, indicate all critical, major, and minor active alarms. A number and an alarm indicator combined represent the number of active alarms at a specific level of severity. For example, if you see the number six in the orange-colored alarm indicator, that means there are six major active alarms. This is shown in Figure 3-2 and Figure 3-3.

Figure 3-2 Alarm Indicators Legend


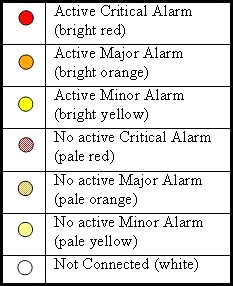
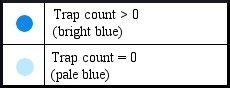
Figure 3-3 Trap Count Indicator Legend