Building a Basic Template Using the Template Builder
This section demonstrates the concepts of Excel templates by describing the steps to create a simple Excel template using the Excel Template Builder.
This procedure follows these steps:
Step 1: Load Sample Data to the Template Builder
Loading sample data provides a properly formatted base from which to build a template.
The method you choose for loading sample data depends on whether you are working in connected or disconnected mode.
-
To load data when working in connected mode, see Accessing the BI Publisher Catalog from the Template Builder.
-
To load data when working in disconnected mode, see Loading Sample Data in Disconnected Mode.
The sample data for this example is a list of employees by department. Note that employees are grouped and listed under the department.
<?xml version="1.0" encoding="UTF-8"?>
<! - Generated by Oracle BI Publisher 11.1.1.4.0 - >
<DATA>
 <DEPT>
   <DEPARTMENT_ID>20</DEPARTMENT_ID>
   <DEPARTMENT_NAME>Marketing</DEPARTMENT_NAME>
     <EMPS>
       <EMPLOYEE_ID>201</EMPLOYEE_ID>
       <EMP_NAME>Michael Hartstein</EMP_NAME>
       <EMAIL>MHARTSTE</EMAIL>
       <PHONE_NUMBER>515.123.5555</PHONE_NUMBER>
       <HIRE_DATE>1996-02-17T00:00:00.000+00:00</HIRE_DATE>
       <SALARY>13000</SALARY>
     </EMPS>
     <EMPS>
       <EMPLOYEE_ID>202</EMPLOYEE_ID>
       <EMP_NAME>Pat Fay</EMP_NAME>
       <EMAIL>PFAY</EMAIL>
       <PHONE_NUMBER>603.123.6666</PHONE_NUMBER>
       <HIRE_DATE>1997-08-17T00:00:00.000+00:00</HIRE_DATE>
       <SALARY>6000</SALARY>
     </EMPS>
  </DEPT>
<DEPT>
...
...
</DEPT>
</DATA>
To build the template described in this tutorial, use the sample data available in the Samples folder installed with BI Publisher Desktop. A very similar data set can be found in <Install Directory>\BI Publisher Desktop\Template Builder for Word\samples\Excel templates\Employee By Departments\EmpByDept Single Sheets\EmpbyDeptExcelData.xml
Step 2: Design the Layout in Excel
Use Excel to simplify a design layout.
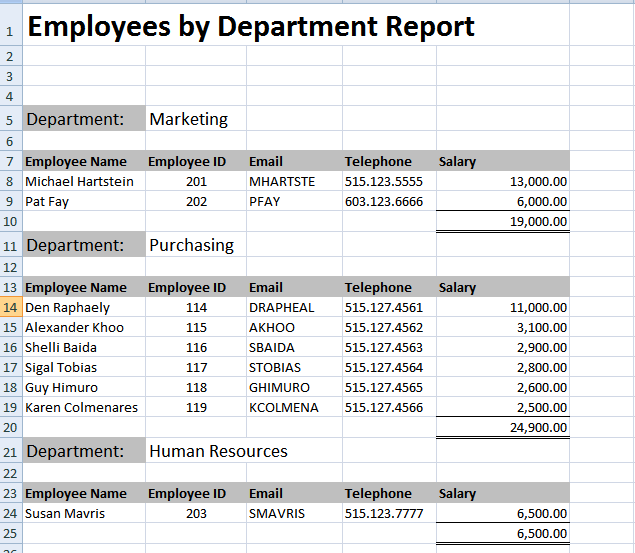
In Excel, determine how you want to render the data and create a sample design, as shown in the following illustration.
The design shows a department name and a row for each employee within the department. You can apply Excel formatting to the design, such as font style, shading, and alignment. Note that this layout includes a total field. The value for this field is not available in the data and requires a calculation.
Step 3: Use the Template Builder to Insert Fields
You can map data to data fields in the template.
In this layout design, the following fields must be mapped to the template from the data:
| Field in Layout | Element in Data |
|---|---|
|
Department |
DEPARTMENT_NAME |
|
Employee Name |
EMP_NAME |
|
Employee ID |
EMPLOYEE_ID |
|
|
|
|
Telephone |
PHONE_NUMBER |
|
Salary |
SALARY |
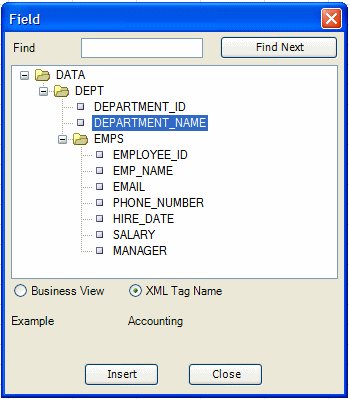
To insert field mappings using the Template Builder:
Step 4: Use the Template Builder to Insert Repeating Groups
A group is a set of data that repeats for each occurrence of a particular element.
In the sample template design, there are two groups:
-
For each occurrence of the <EMPS> element, the employee's data (name, e-mail, telephone, salary) is displayed in the worksheet.
-
For each occurrence of the <DEPT> element, the department name and the list of employees belonging to that department are displayed.
In other words, the employees are "grouped" by department and each employee's data is "grouped" by the employee element. To achieve this in the final report, insert a repeating group around the cells that are to repeat for each grouping element.
Note that the data must be structured according to the groups that you want to create in the template. The structure of the data for this example
<DATA>
   <DEPT>
      <EMPS>
establishes the grouping desired for the report.
To insert the repeating group for Employees:
-
Select the cells that make up the group. In this example, the first group is the Employee data that makes up a row in the table, the cells are A8 - E8.
-
On the BI Publisher tab, in the Insert group, click Repeating Group.
-
In the BI Publisher Properties dialog, select the following:
-
From the For Each list, select EMPS.
-
From the Group By list, select EMPLOYEE_ID.
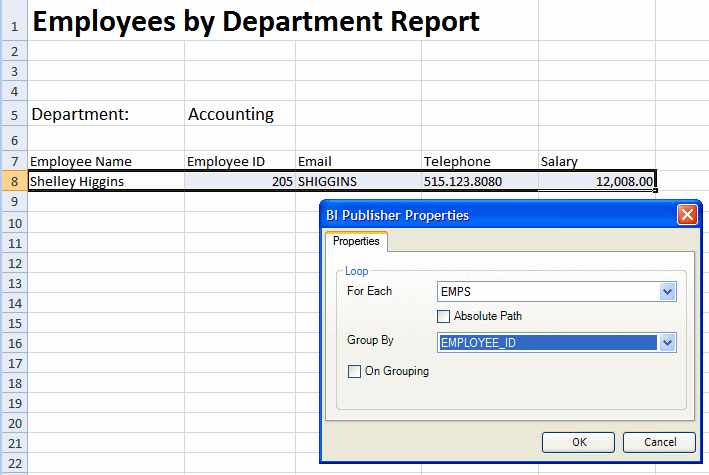
The following illustration shows BI Publisher Properties definitions for the Employees group. Notice that just the row of employee data is highlighted. Do not highlight the headers. Notice also that the total cell is not highlighted.
-
To insert the repeating group for Departments:
The following illustration shows the selections for the BI Publisher Properties dialog.
Step 5: Insert the Calculated Salary Field
Finally, insert the second Salary field that is to be an aggregated sum for each department.
To insert the calculated field:


